Cosine Similarity of Neighborhoods (Single-Source)
This algorithm calculates the similarity between a given vertex and every other vertex in the graph using cosine similarity.
For each vertex pair, the selected properties of each vertex are first represented as a vector.
For example, a property vector for a Person vertex could have the elements age, height, and weight.
Then the cosine function is applied to the two vectors.
The cosine similarity of two vectors A and B is defined as follows:
If A and B are identical, then \(cos(A, B) = 1\). As expected for a cosine function, the value can also be negative or zero. In fact, cosine similarity is closely related to the Pearson correlation coefficient.
For this implementation of the algorithm, the feature vector is the set of edge weights between the two vertices and their neighbors.
On a graph with many vertices, it is very likely that most vertices will be dissimilar to each other. For this reason, we can limit output with the top_k parameter.
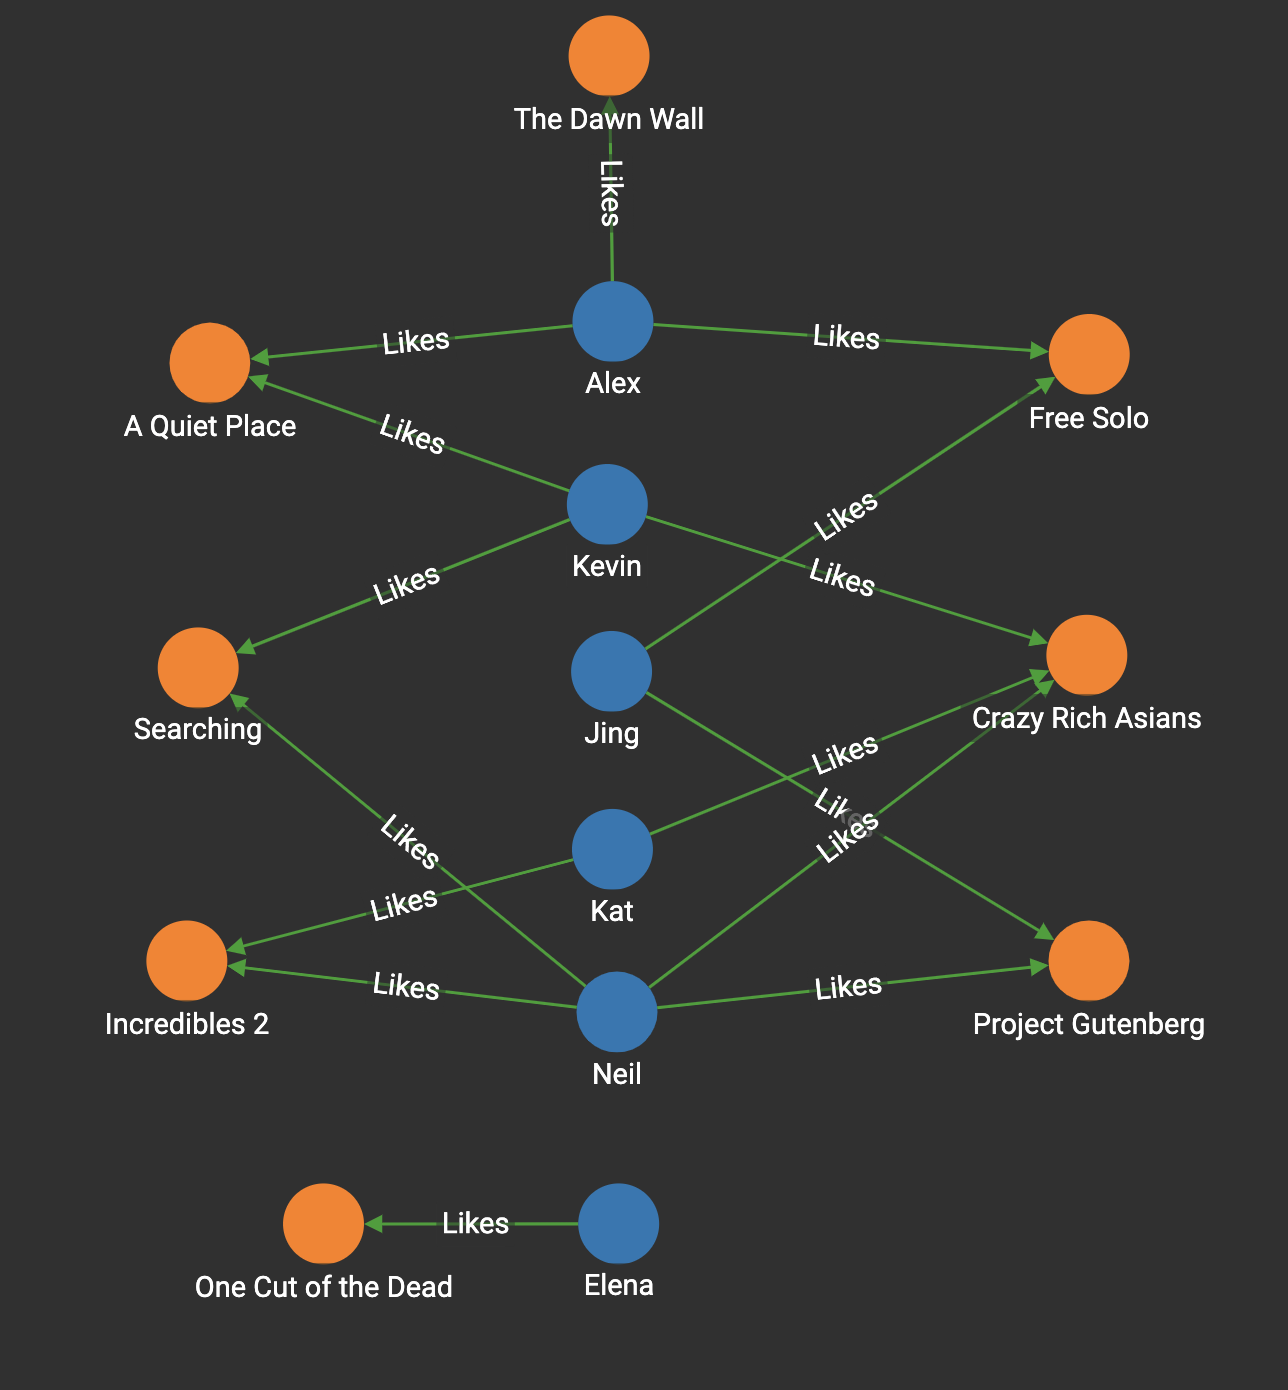
In the Movie Rating graph shown in the figure below, there are Person vertices and Movie vertices. Every person has given a rating to one or more movies. The rating score is stored on the Likes edge using the weight attribute (not shown in the diagram). For example, in the graph below, Alex gives a rating of 10 to the movie "Free Solo".
Specifications
tg_cosine_nbor_ss (VERTEX source, SET<STRING> e_type, SET<STRING> re_type,
  STRING weight, INT top_k, INT output_limit, BOOL print_accum = TRUE,
  STRING file_path = "", STRING similarity_edge = "")
RETURNS (MapAccum<VERTEX, FLOAT>)
Parameters
| Parameter | Description | Default value |
|---|---|---|
|
Source vertex |
(empty set of strings) |
|
Edge type to traverse |
(empty set of strings) |
|
Reverse edge type to traverse |
(empty set of strings) |
|
The edge attribute to use as the weight of the edge. |
(empty string) |
|
The number of vertices to return |
10 |
|
The maximum number of vertices to return |
10 |
|
Whether to output the final results to the console in JSON format |
True |
|
If provided, the algorithm will save the output in CSV format to this file |
(empty string) |
|
If provided, the similarity score will be saved to this edge |
(empty string) |
Output
The top \(k\) vertices in the graph that have the highest similarity scores, along with their scores.
The result is available in three forms:
-
streamed out in JSON format
-
written to a file in tabular format
-
stored as a vertex attribute value
Example
Still using a Movie Rating graph, one way to calculate similarity between two people would be to see which movies they both rated similarly.
Starting from one person’s name, this algorithm calculates the cosine similarity between the given person and every other person in the graph, as long as there is at least one movie they have both rated.
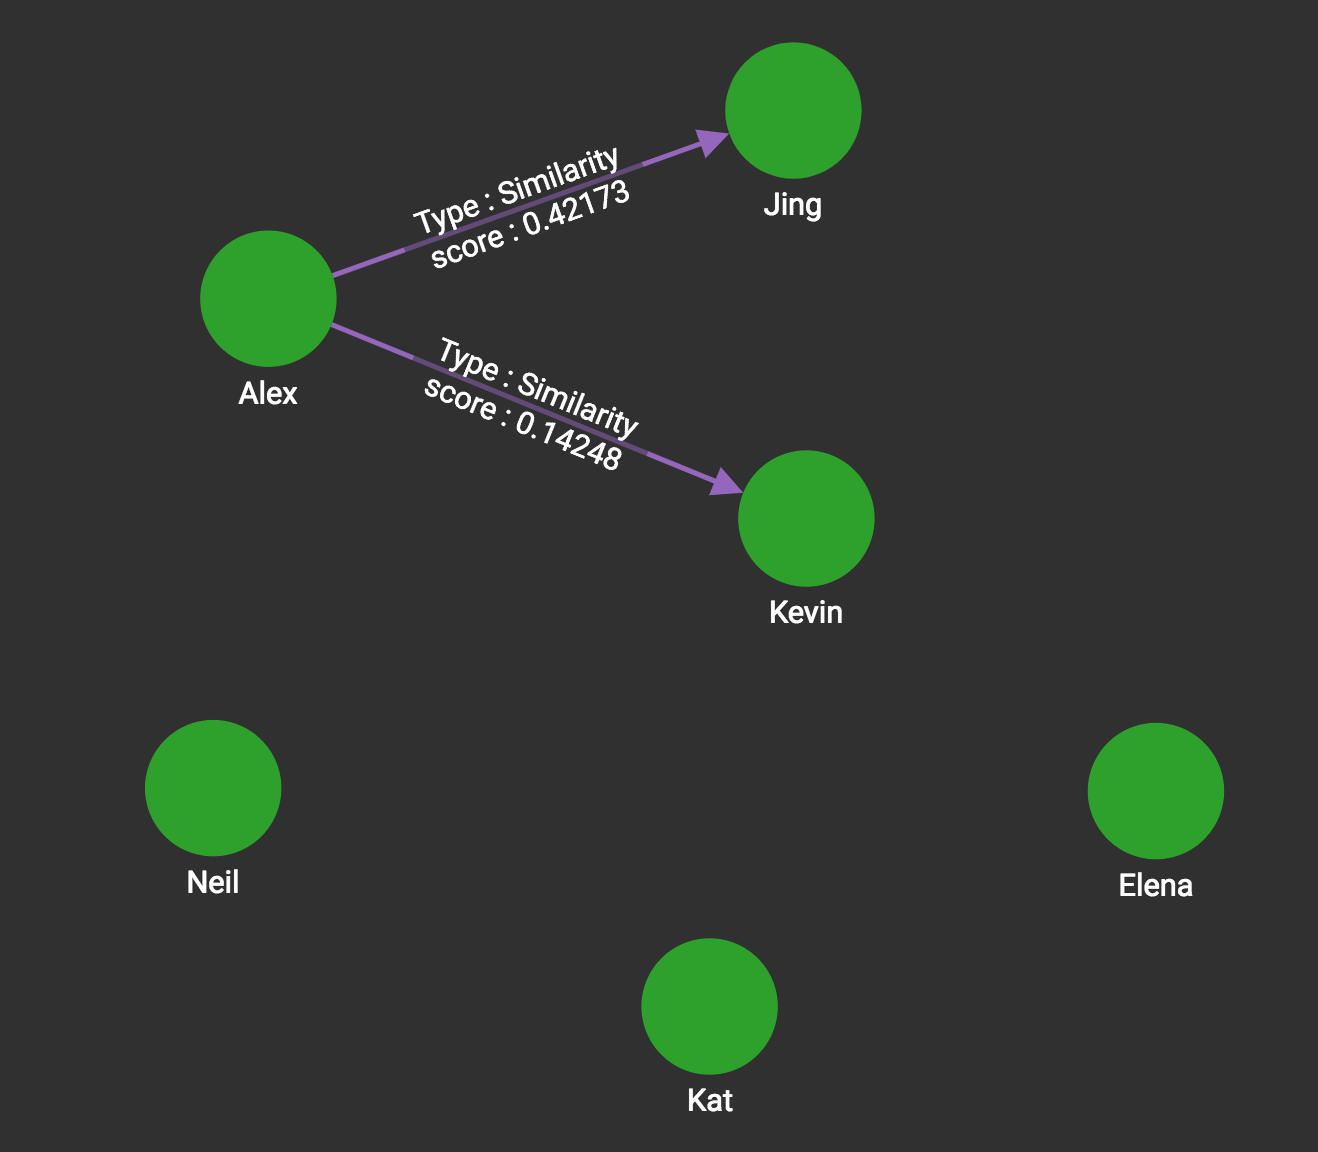
tg_cosine_nbor_ss ("Alex", "Likes", "Reverse_Likes", "weight", 5, 5,_,_,_)If the source vertex is Alex, and top_k is set to 5, then we calculate the cosine similarity between him and two other persons, Jing and Kevin (since our graph does not have enough data to return 5 Person vertices).
The JSON output shows the most similar vertices and their similarity scores in descending order.
The output limit is 5 persons, but we have only 2 qualified persons:
[
  {
    "neighbours": [
      {
        "attributes": {
          "neighbours.@sum_similarity": 0.42173
        },
        "v_id": "Jing",
        "v_type": "Person"
      },
      {
        "attributes": {
          "neighbours.@sum_similarity": 0.14248
        },
        "v_id": "Kevin",
        "v_type": "Person"
      }
    ]
  }
]
The CSV file version output, if selected, is not necessarily in descending order. It looks like the following:
Vertex1,Vertex2,Similarity
Alex,Kevin,0.142484
Alex,Jing,0.421731
The ATTR version inserts a new edge called Similarity into the graph with the similarity score as an edge attribute whenever the score is larger than zero. The result looks like this: