Map Data To Graph
Map Data To Graph
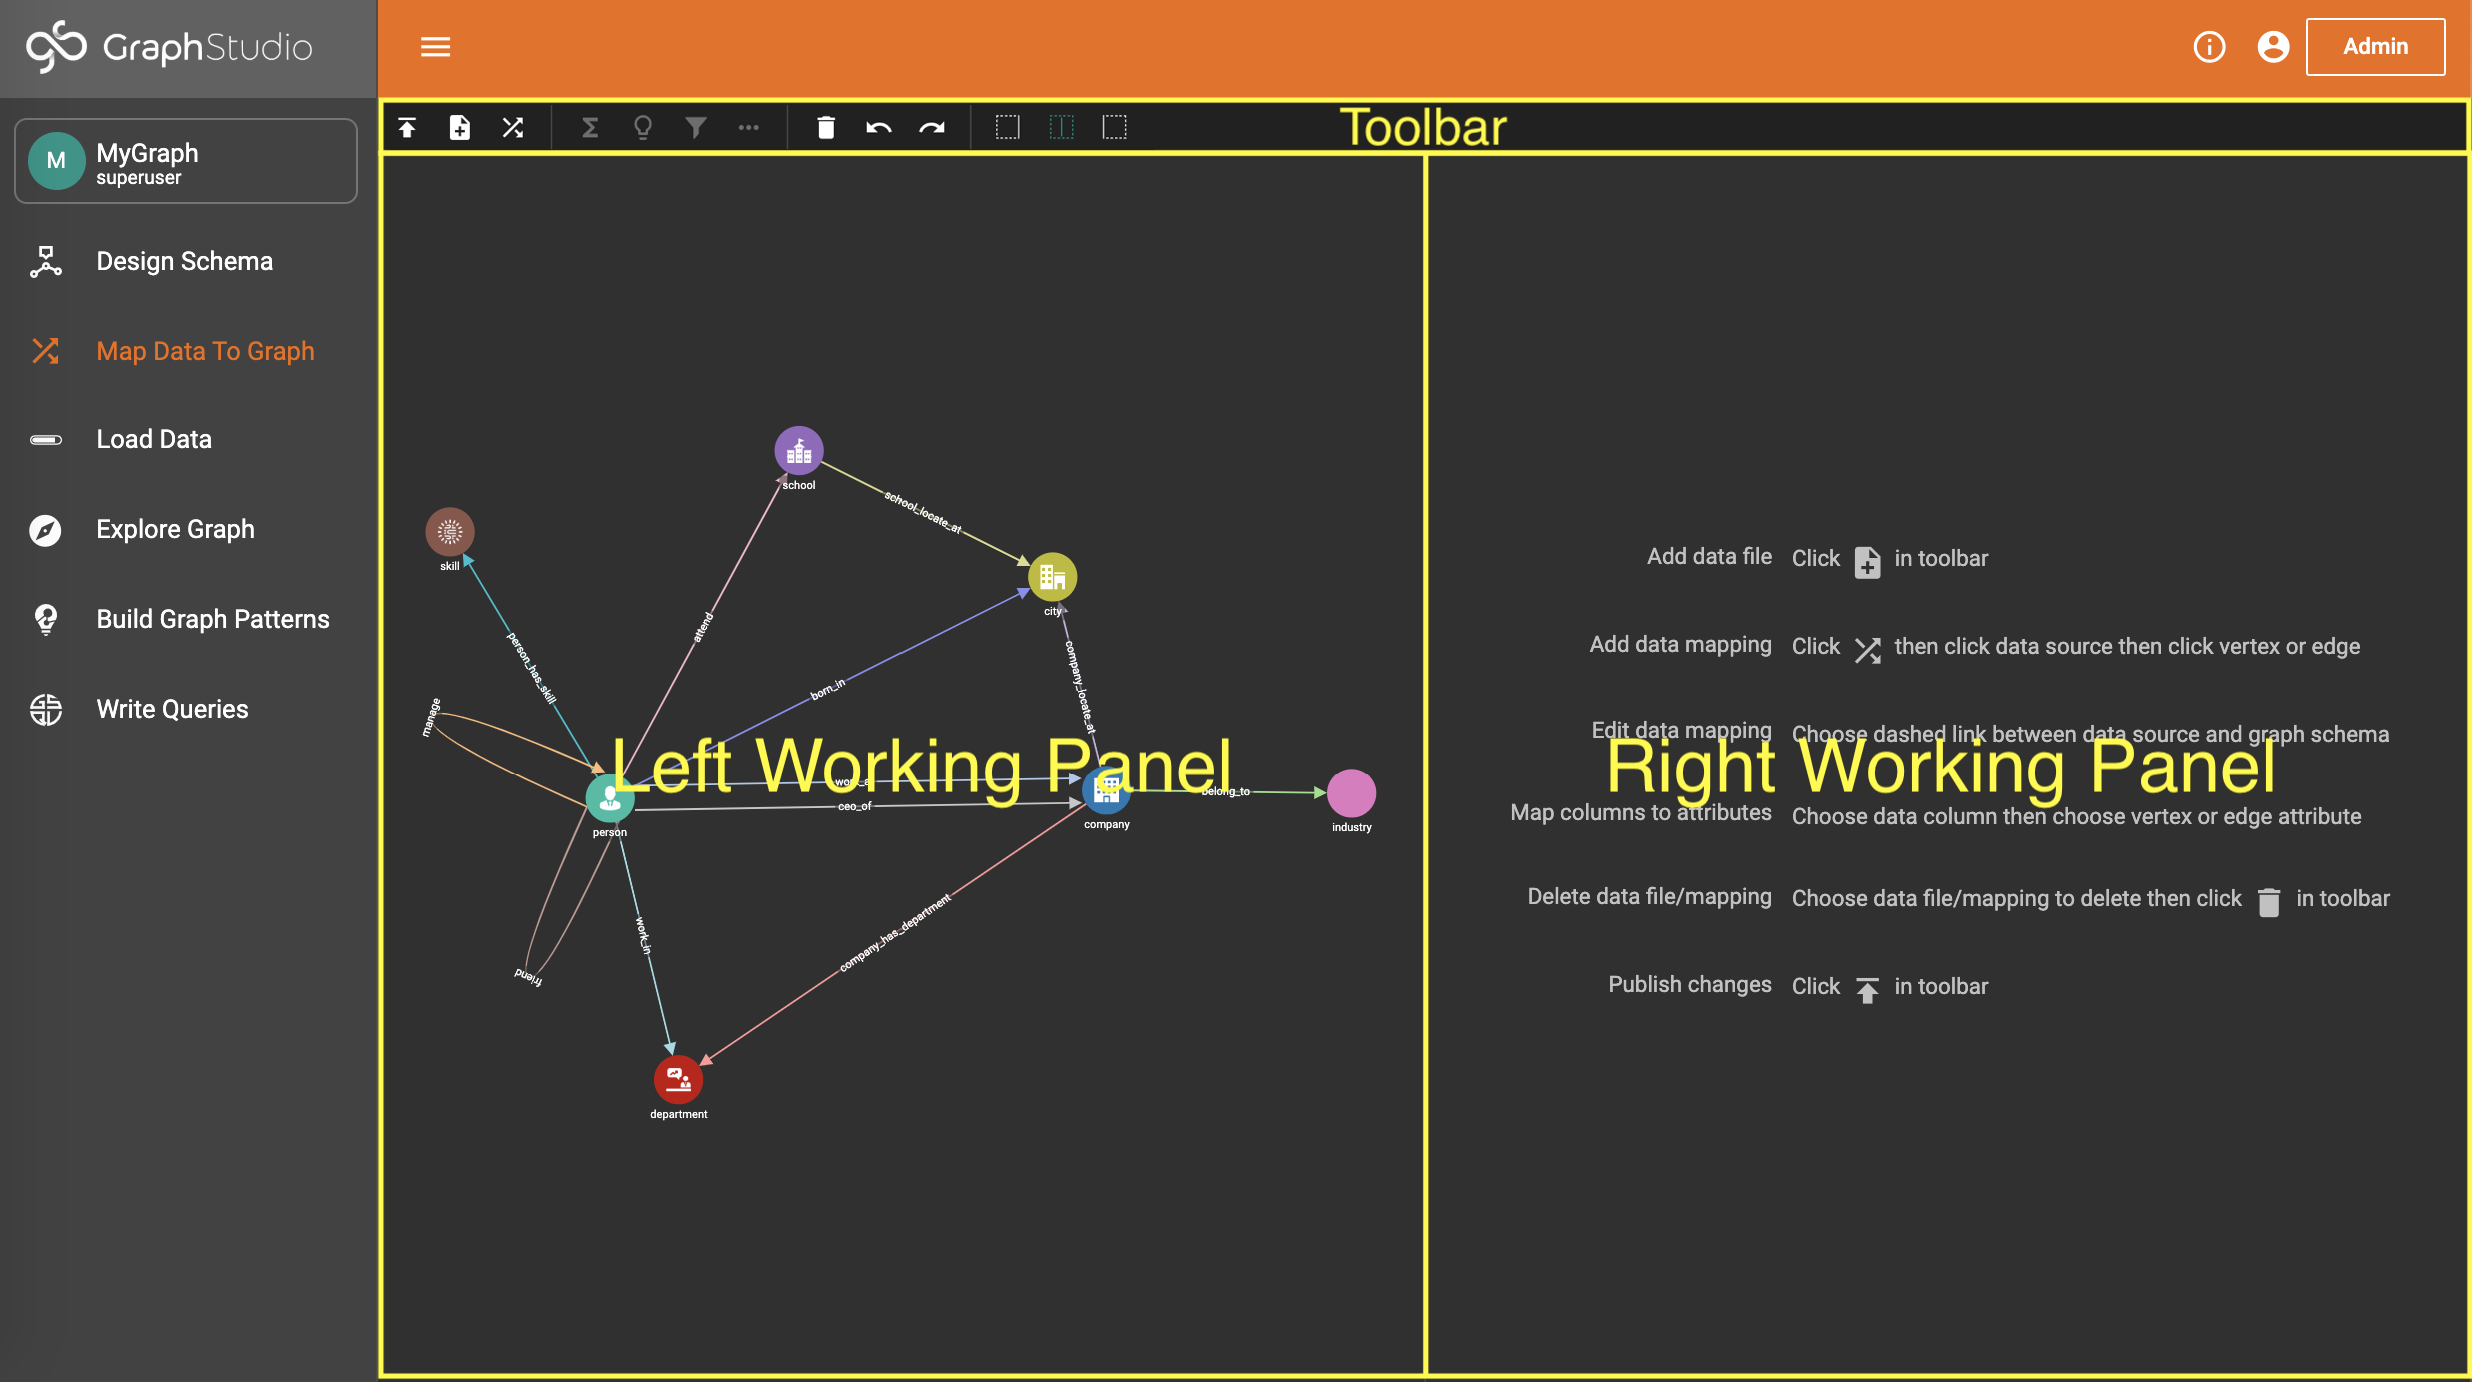
After you have created a graph schema, the next major step is to map your data to the schema. Click "Map Data To Graph" on the left side menu bar. The working panel is split into a left panel and a right panel. Initially when there is no data mapping yet, the left panel will display only the graph schema.
The main steps are
-
Select a data source.
-
Add data file(s)
-
Map data file(s) to vertex/edge types
-
Map data file columns to vertex/edge fields
-
Publish data mapping
1 Select a Data Source
Beginning with v2.4, GraphStudio supports loading data from either local files on the TigerGraph server or files stored on Amazon S3. In future releases, GraphStudio will support loading from other data sources.
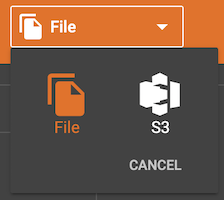
Click the data file type selector button on the banner of Add Data File window, and choose either File or S3 from the list:
-
If you select File, no more configuration is needed. Skip the sections for external sources and go to Map Data To Graph.
-
If you select S3, then read the section Create S3 data source.
2 Add Data Files
This section contains a subsection for each of the different data sources. Read the section which pertains to your data source:
-
Local File System - Add Local Data File
-
AWS S3 - Create S3 data source
Add Local Data File
In this step, you inform GraphStudio about your data files. A data file is a file containing structured data to be loaded into the graph, creating vertex and/or edge instances. The first step for data mapping is to specify your data files. Click the Add Data File button  to add data files. The Add Data File window will pop up:
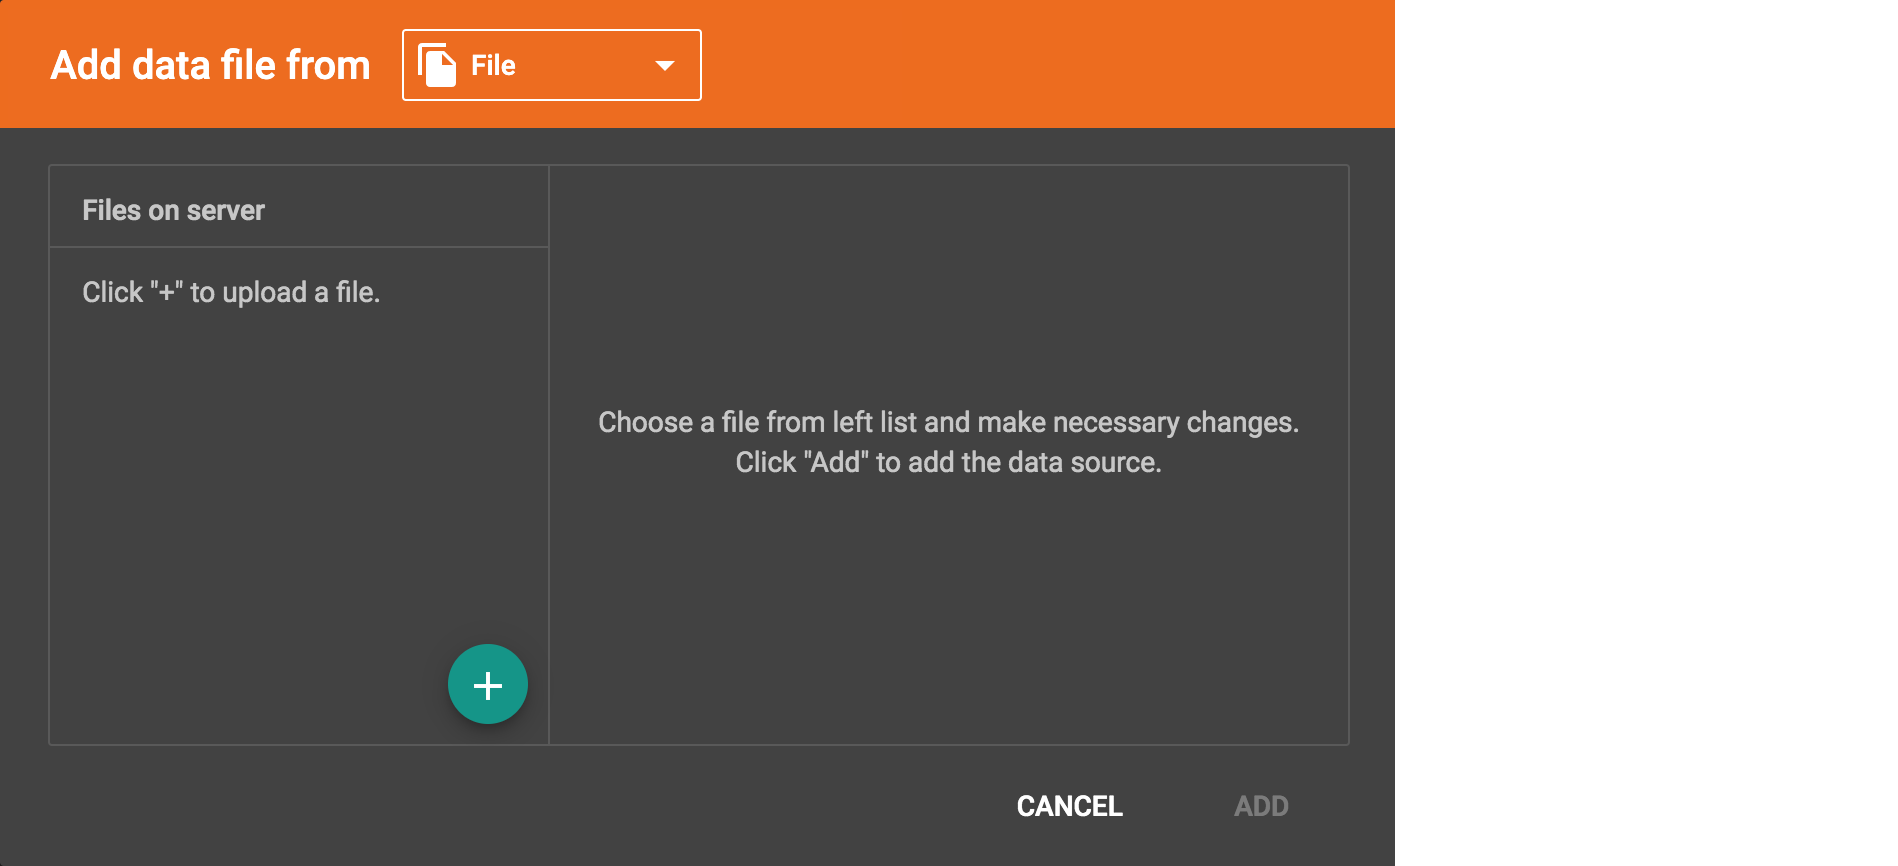
Initially, there are no data files in the server data folder.
Upload File To Server
Click the Upload File button  . A file selection window will appear. Choose the data files you want to use. The files will be uploaded to the server data folder:
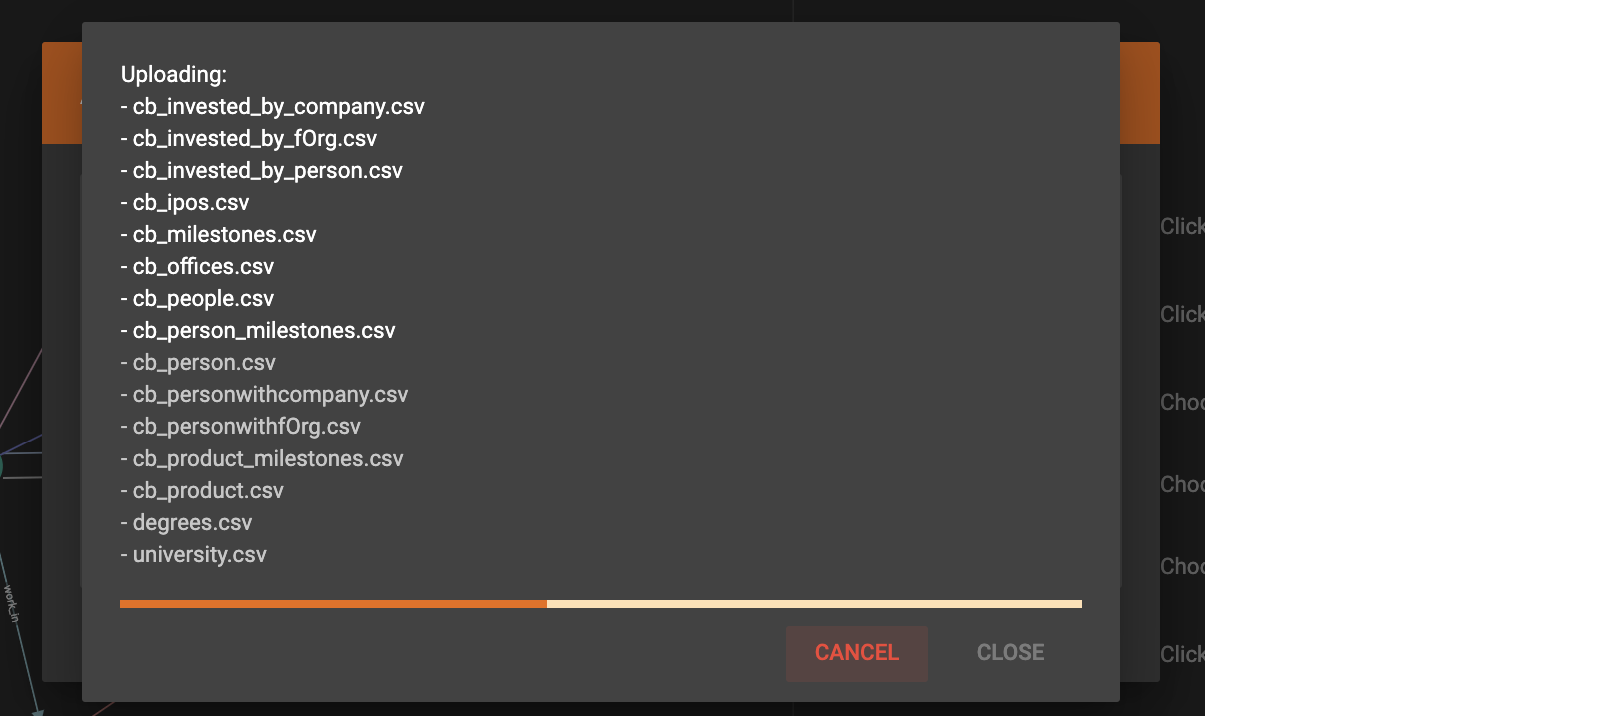
If all the files are uploaded successfully, the progress window will close automatically, otherwise the window will stay open to notify users of any errors.
Once the files are uploaded to the server, it will appear in the "Files on server" list on the left side of the Add Data Files window.
|
Data Files must be .csv files to allow data mapping in GraphStudio ( .json file upload is allowed in TigerGraph V3.0.5+ through GraphStudio) The Add Data File box will only upload files which end in ".csv". If you manually place files in the In TigerGraph V3.0.5, you can upload files which end in ".json". This allows users to upload ".json" files to the filesystems and use a remote GSQL client, or GSQL web shell in TigerGraph Cloud to map data to the graph using GSQL commands. Currently, data mapping for ".json" files through GraphStudio UI is not supported. |
Configure the File Parser
In this step, you tell GraphStudio how to parse your data file. If your data file is in tabular format, the parser will split each line into a series of tokens. Click on one file from the file list to choose it. The parsing result for the first line of data is shown as a preview table on the right side:
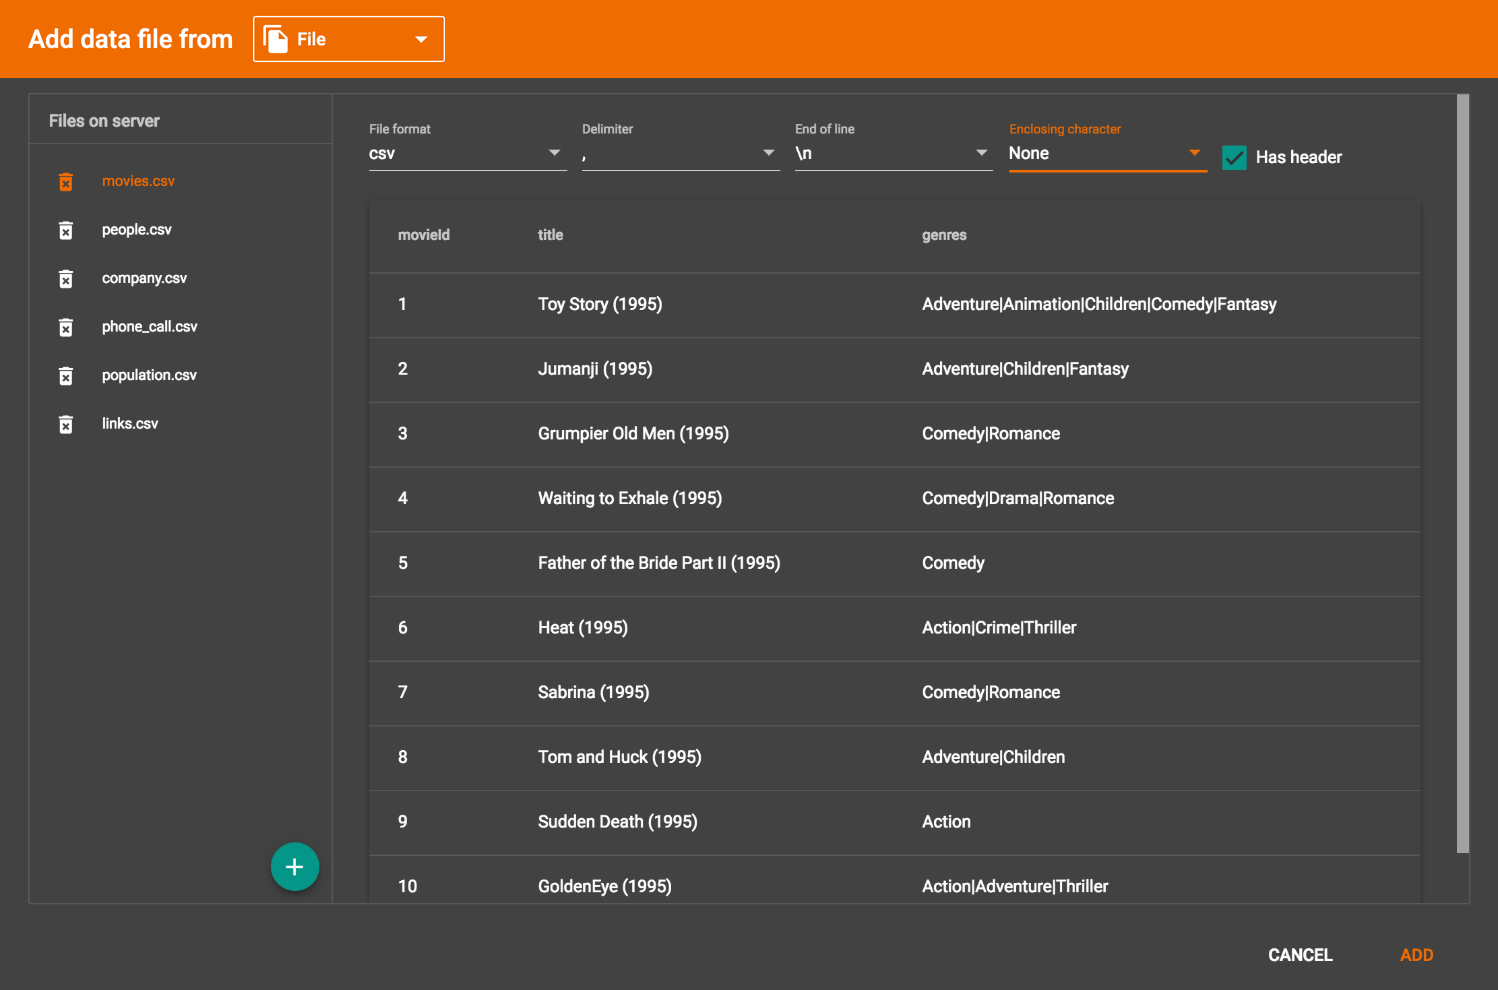
If the parsing is not correct, click on the down arrow in a table column to choose a different option for file format, delimiter, or end of line. The file will immediately be re-parsed when you change a setting. The enclosing character is used to mark the boundaries of a token, overriding the delimiter character. For example, if your delimiter is comma (,), but you have commas in some strings, then you can define either double quotes (") or single quotes (') as the enclosing character to mark the endpoints of your string tokens. It is not necessary for every token to have enclosing characters; the parser will use enclosing characters when it encounters them.
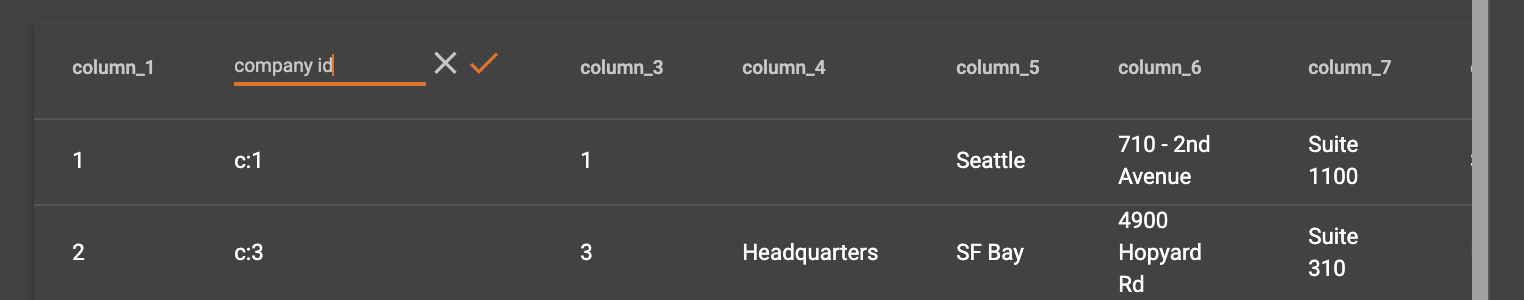
GraphStudio allows users to edit the header line of the parsing result, to make the data mapping more intuitive. This doesn’t affect the data loading because the header line will be ignored.
Once you are satisfied with the file parsing configuration, click the add button to add the data file into left working panel. The data file will be shown as a file icon on the working panel:
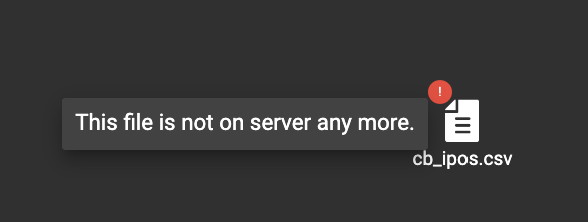
Once you think a file is no longer needed, you can remove it from server by clicking the delete button  to the left of each file. Please note that you also need to manually remove data mapping using this file as data file, otherwise when you load data later, a "file not found" error will be triggered.
After adding all your data files, continue with 3 Map Data Files To Vertex Type Or Edge Type
Create S3 data source
After you click the S3 data source icon, you should see the following window:
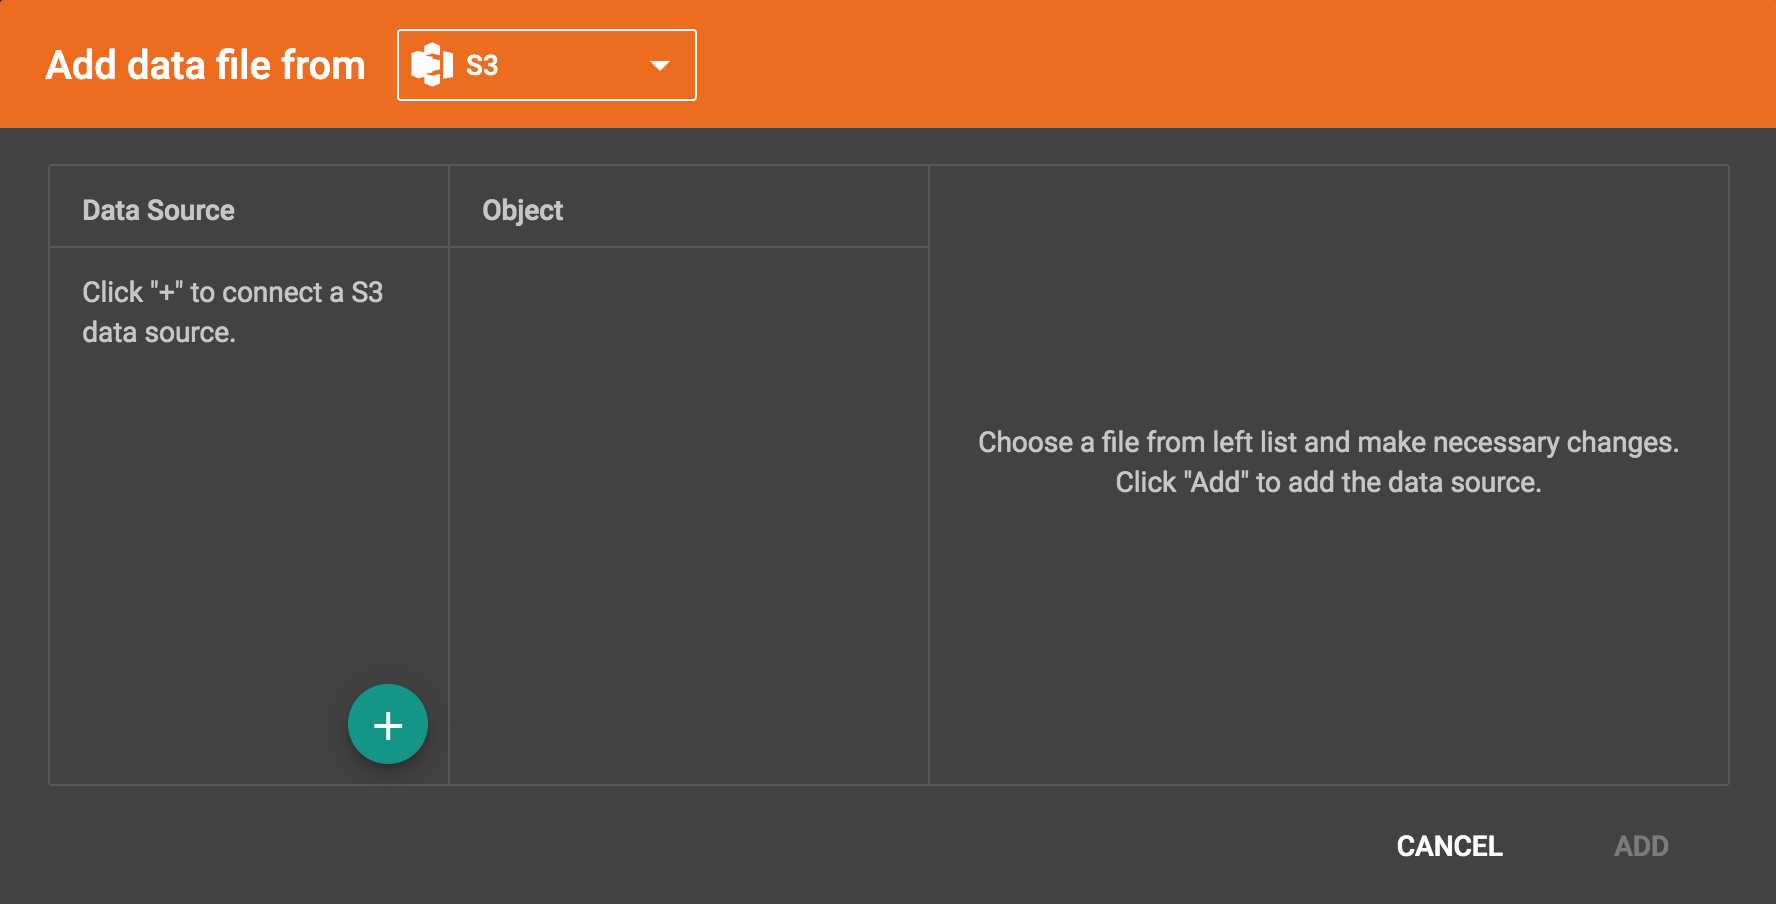
Initially, there are no S3 data sources in the system.
A data source is an appropriately configured connection to some remote source of data file(s). When the data file type is switched to S3, you can configure connection to your S3 buckets.
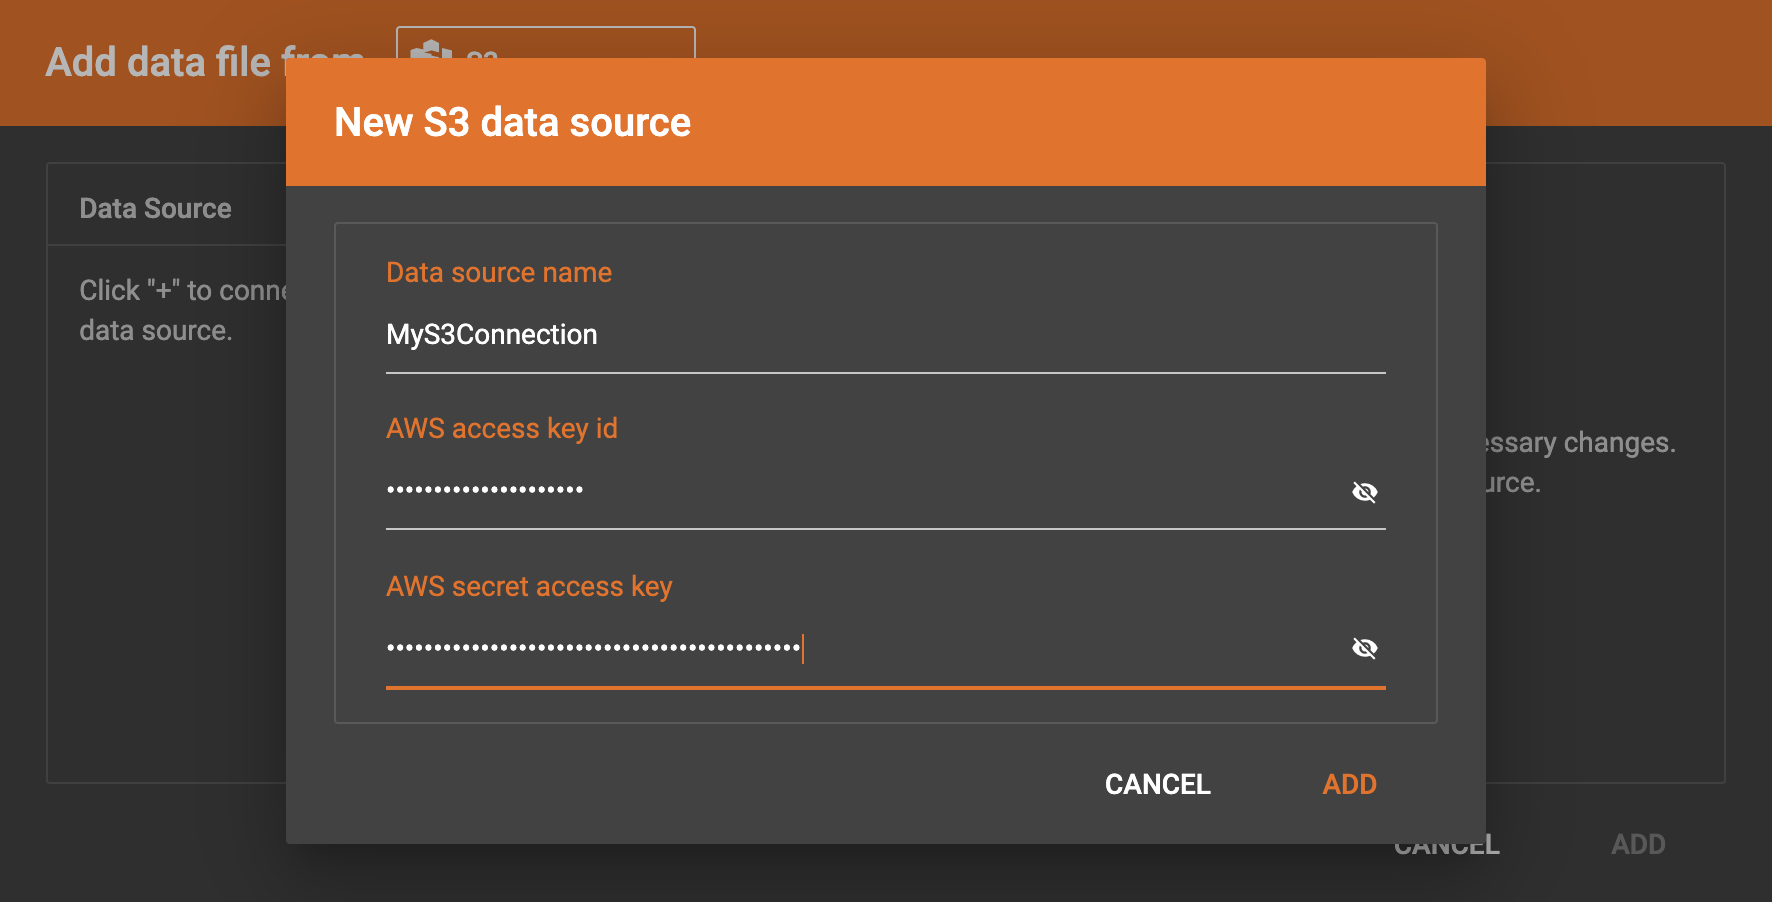
Click the Add new data source button , then the new S3 data source window will pop up. Give a name to the data source, and provide the access key id and secret access key to connect to S3. Then click the ADD button:
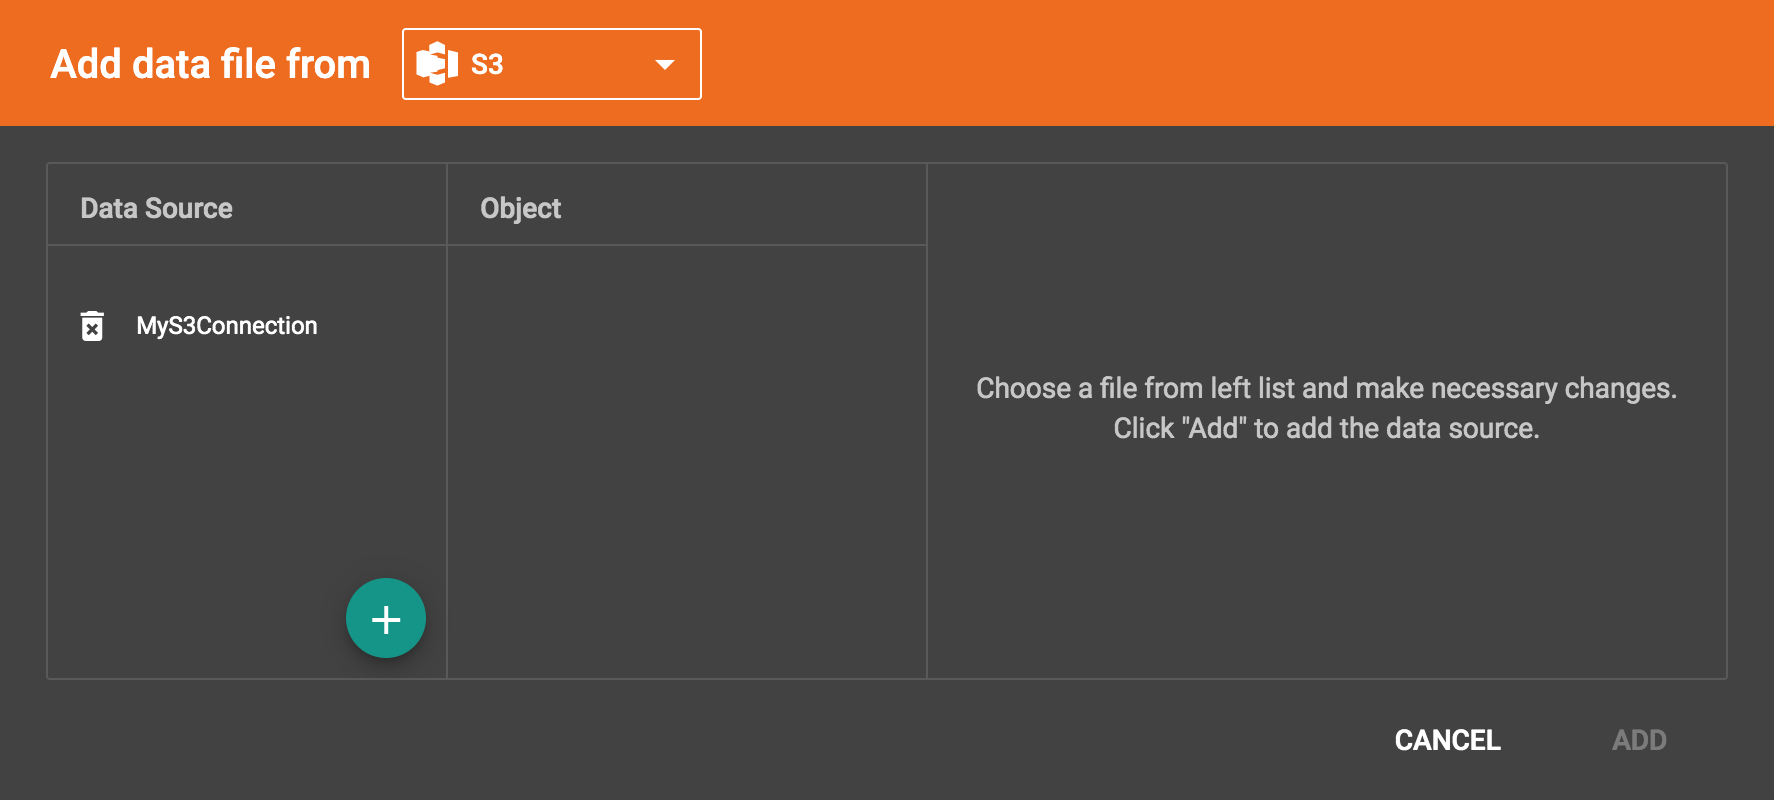
The data source will be created and shown in the Data Source list:
Click the data source to list all the buckets the credentials can access, and click the Expand icon to see all the buckets or folders within the buckets. The file hierarchy will be shown as a tree. Choose the file you want to add, and change the parsing options if necessary. (See Configure the File Parser)
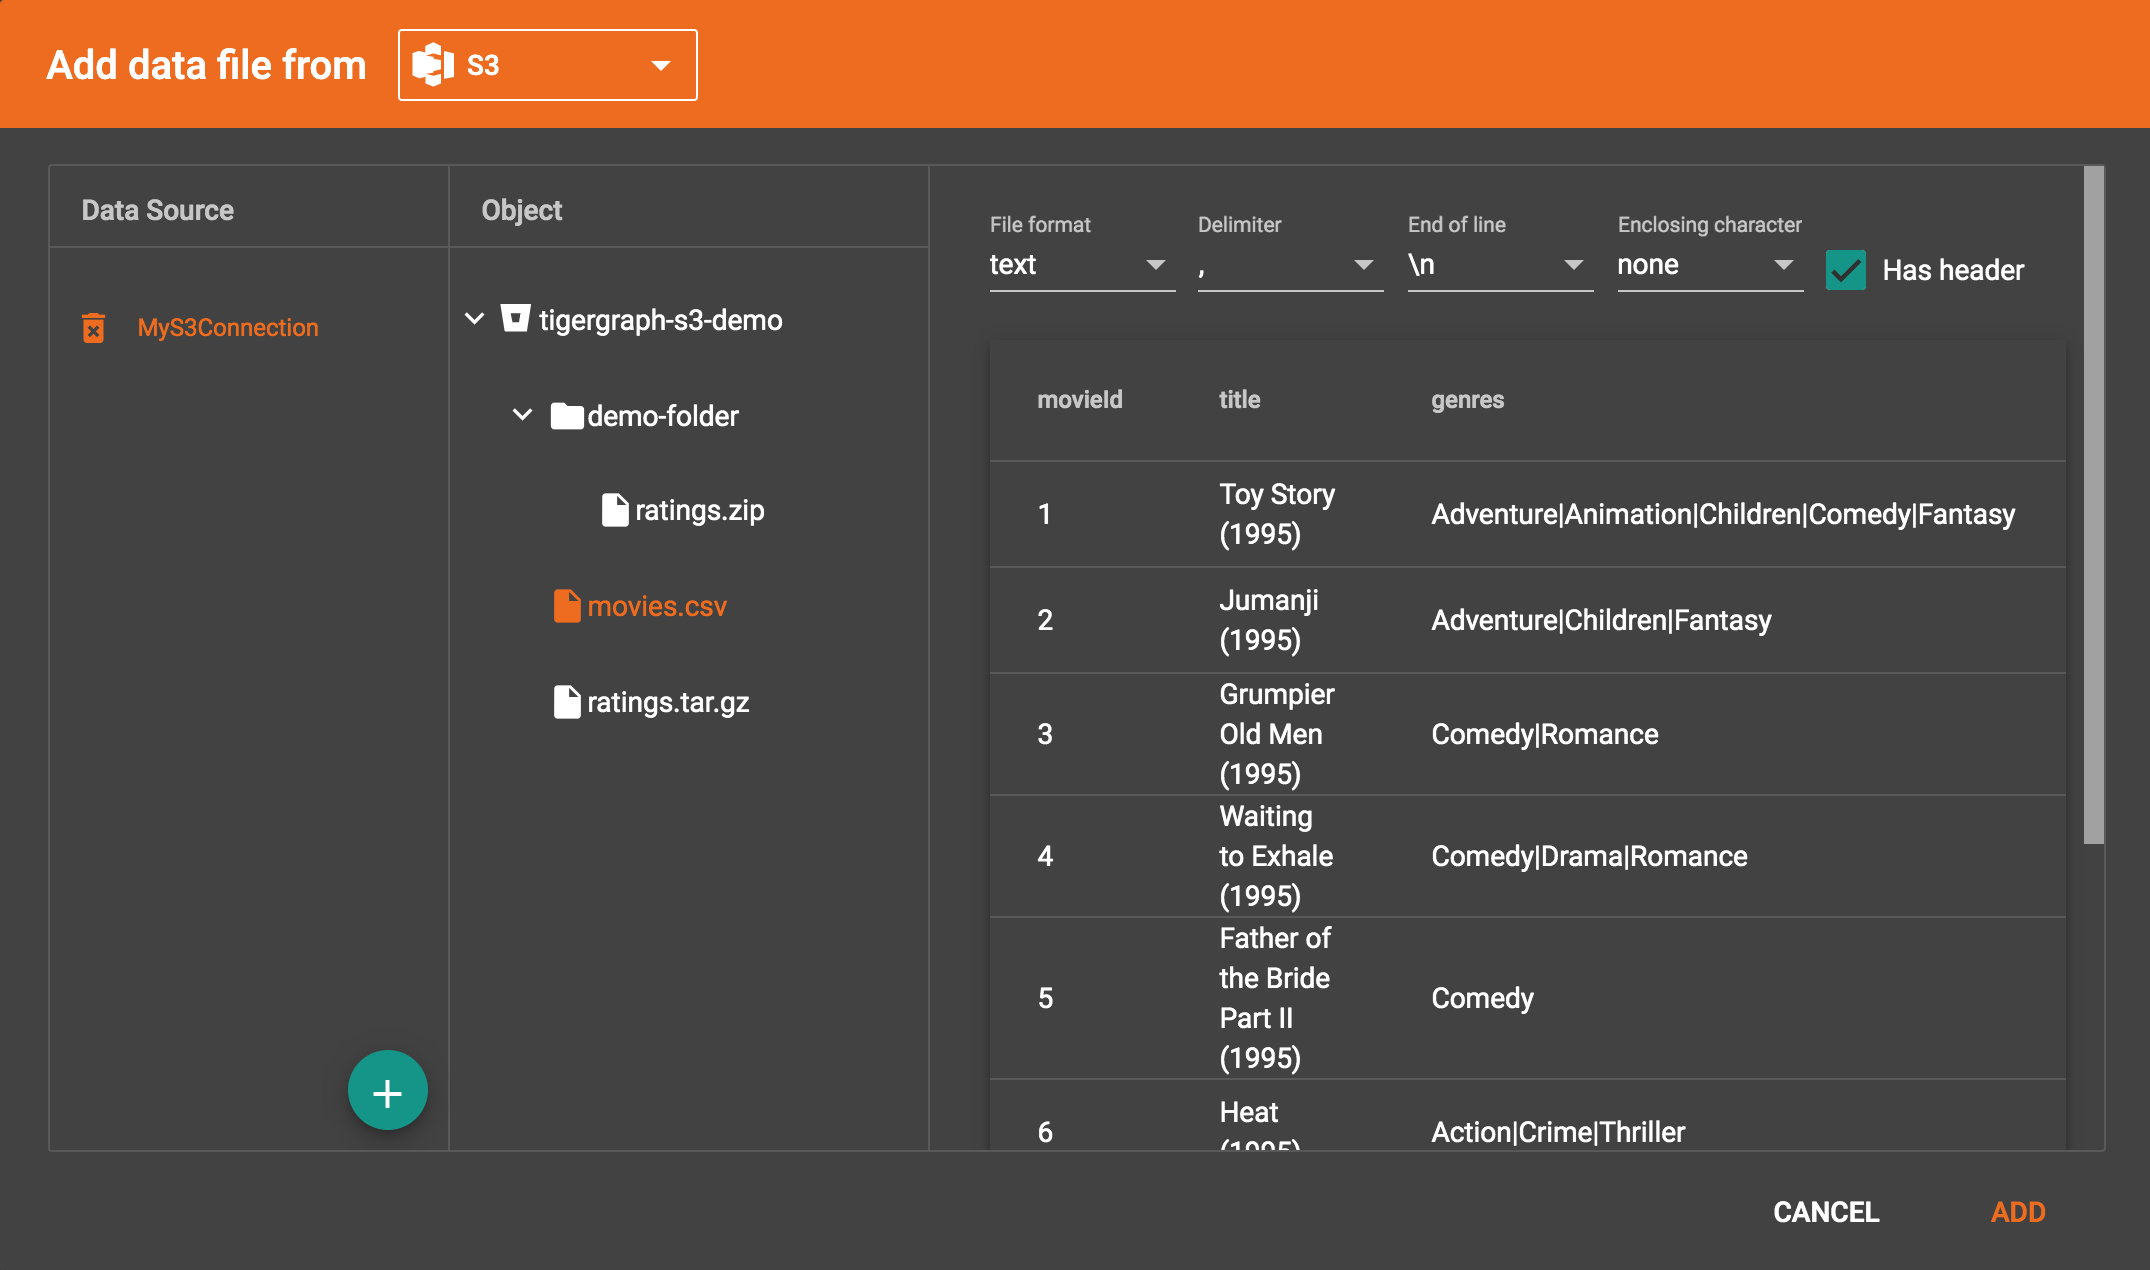
|
Data files, after decompression, must be in either csv or parquet format. |
|
TigerGraph supports loading from archived and compressed S3 files directly. Currently supported file extensions includes zip, tar.gz, tgz and tar. GraphStudio detects the file extension and automatically chooses the corresponding file format. If the file is encoded with one of these formats but has a non-standard file extension, you can manually specify the File format. |
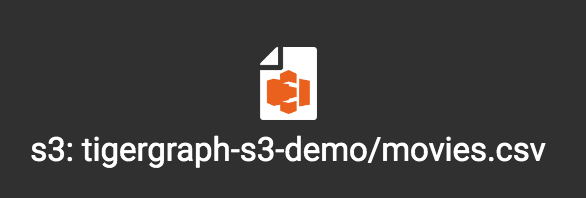
After clicking the ADD button, an S3 file icon will appear on the working panel:
After adding all your s3 data files, continue with 3 Map Data Files To Vertex Type Or Edge Type[Step 3 Map Data Files to Vertex/Edge Types]
3 Map Data Files To Vertex Type Or Edge Type
In this step, you link (map) a data file to a target vertex type or edge type. The mapping can be many-to-many, which means one data file can map to multiple vertex and / or edge types, and multiple data files can map to the same vertex or edge type. Click the map data file to vertex or edge button  to enter map data file to vertex or edge mode. When you finish mapping the data files, click the button again to exit this mode.
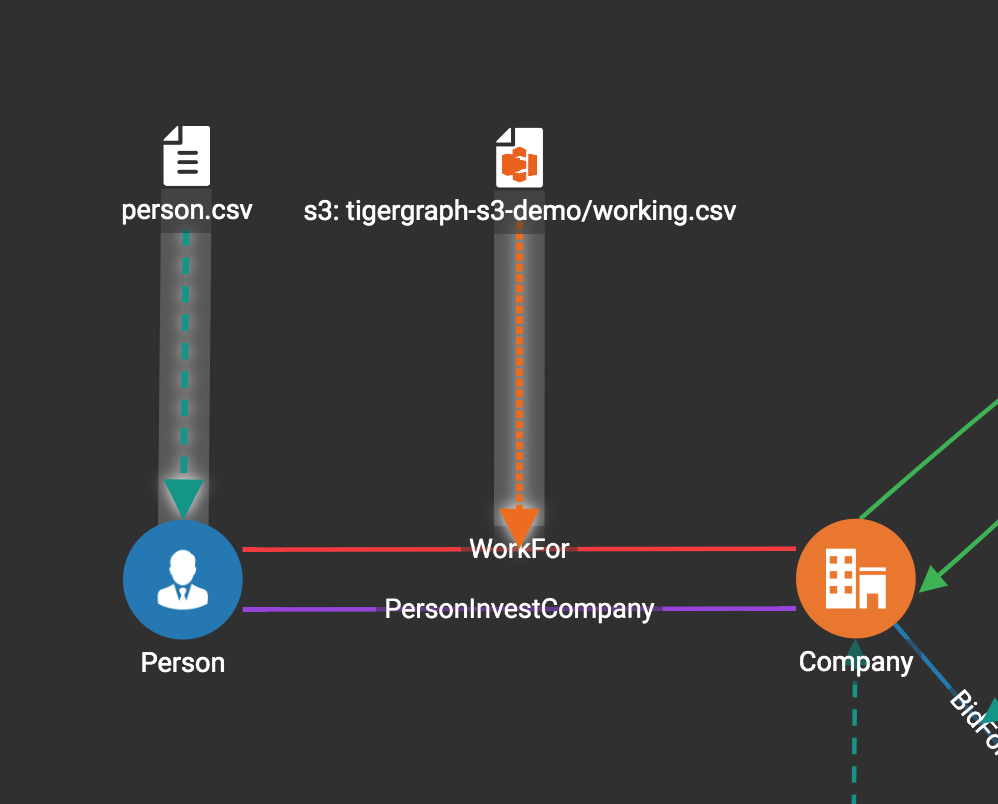
Then, click the data file icon. A hint will appear over the icon:
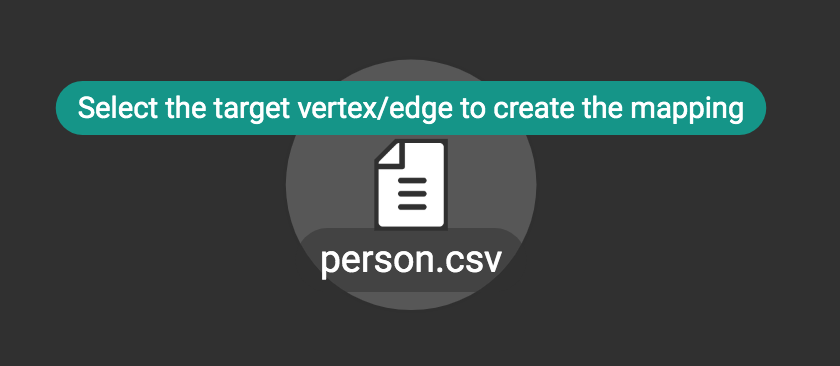
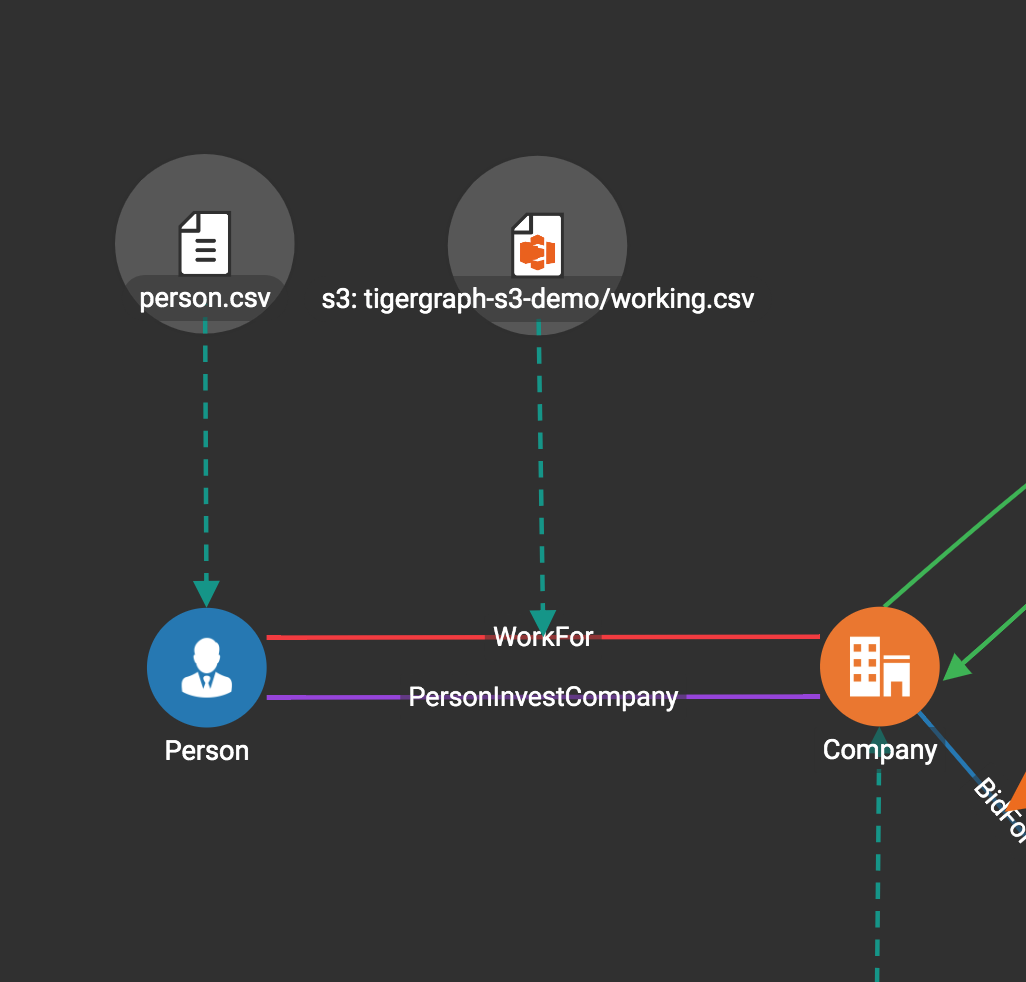
Next, click the target vertex type circle or edge type link. A dashed link will appear between the data file and the target vertex or edge type:
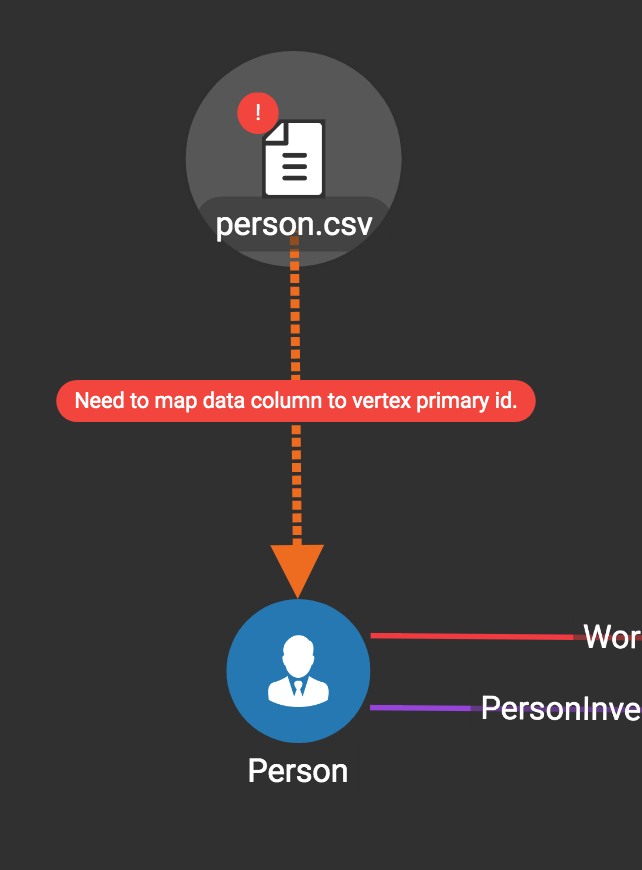
A red hint will appear if the target type has not yet received a mapping for its primary id(s).
4 Map Data Columns To Vertex Or Edge Attributes
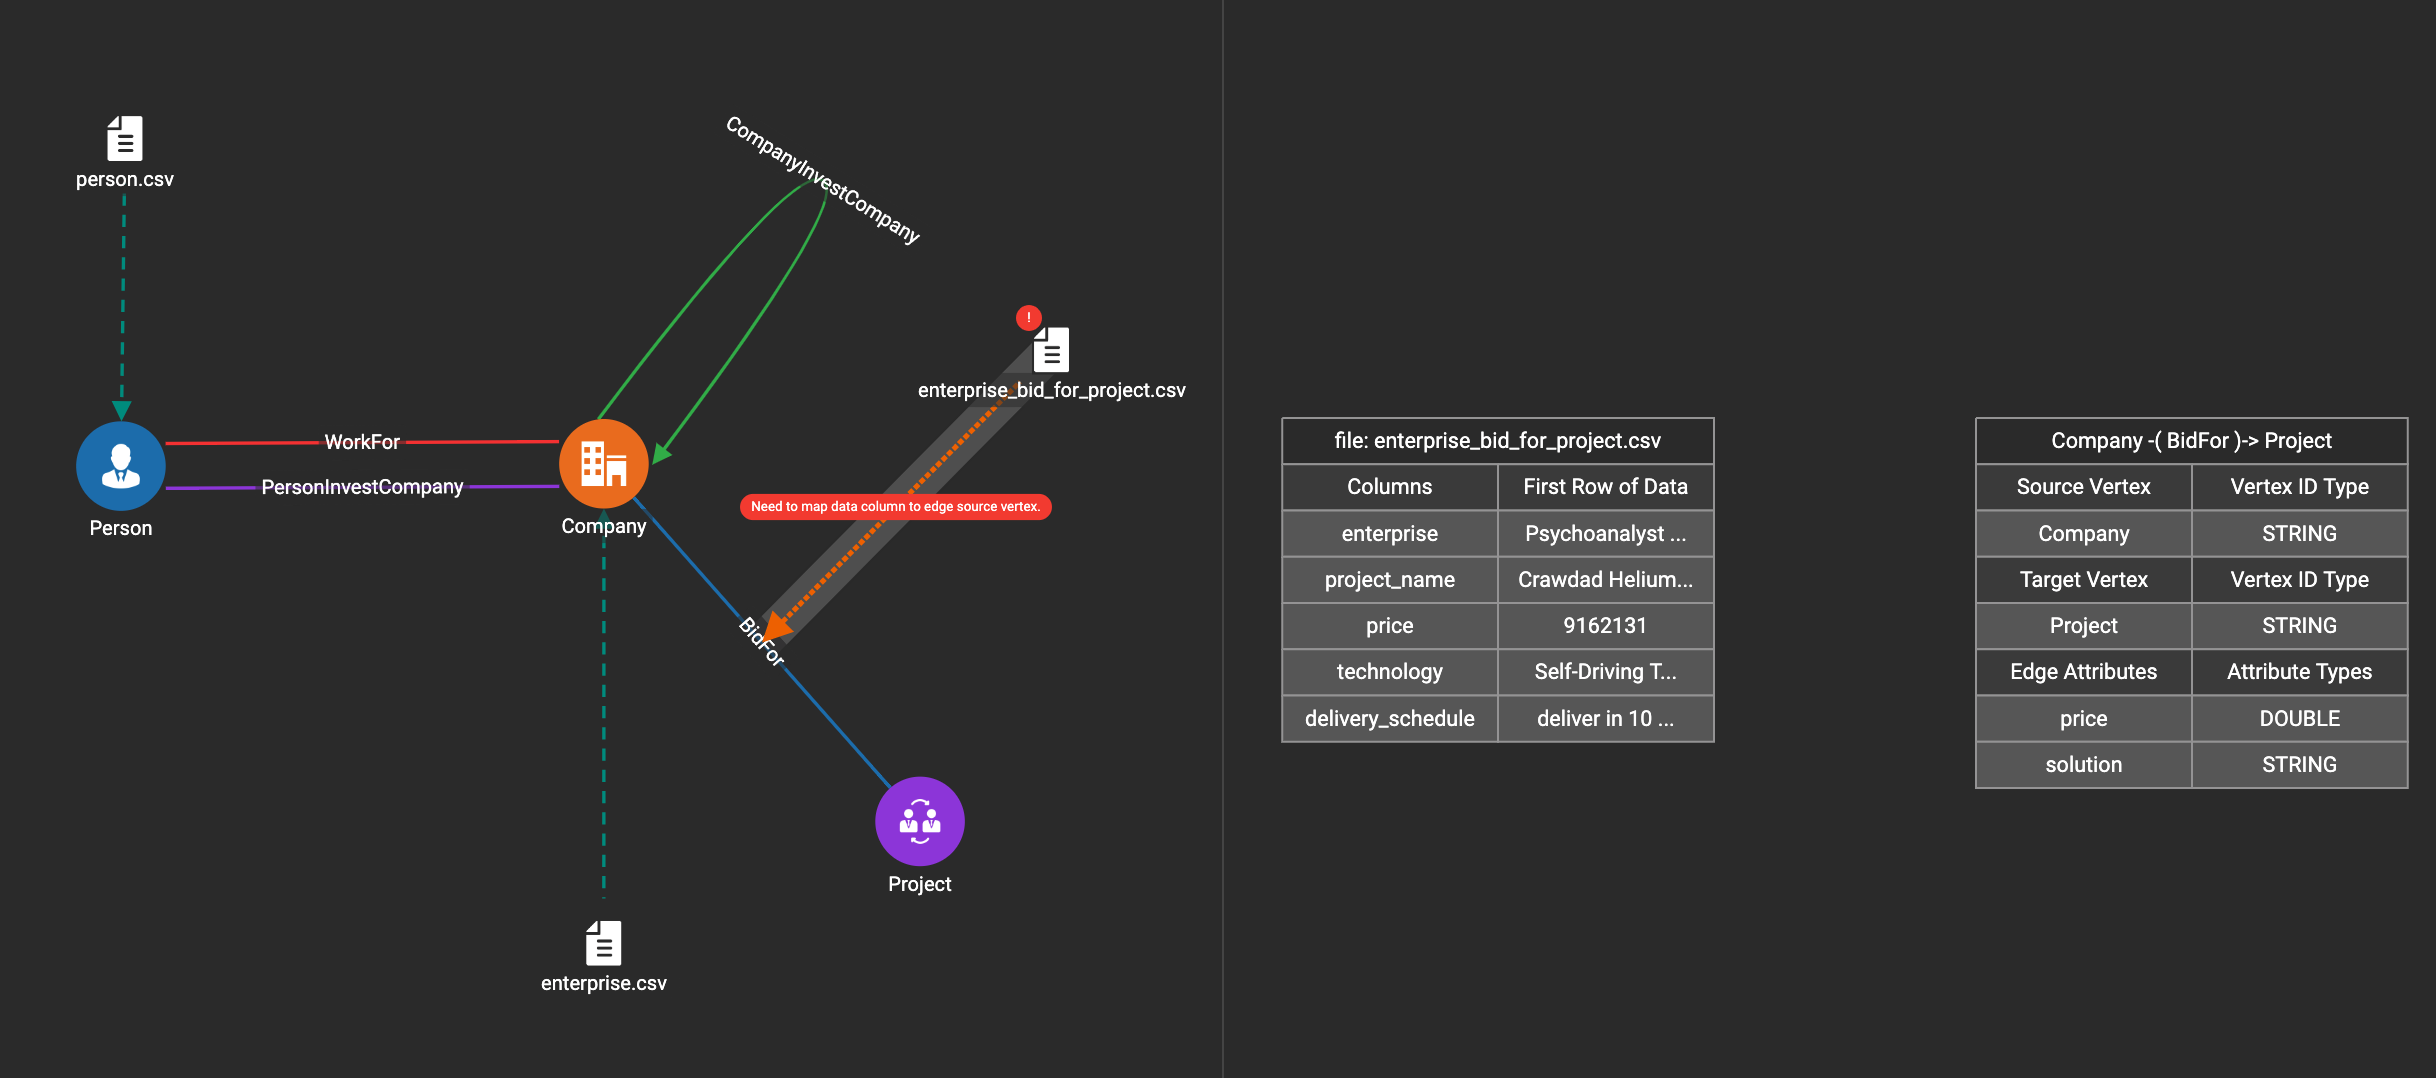
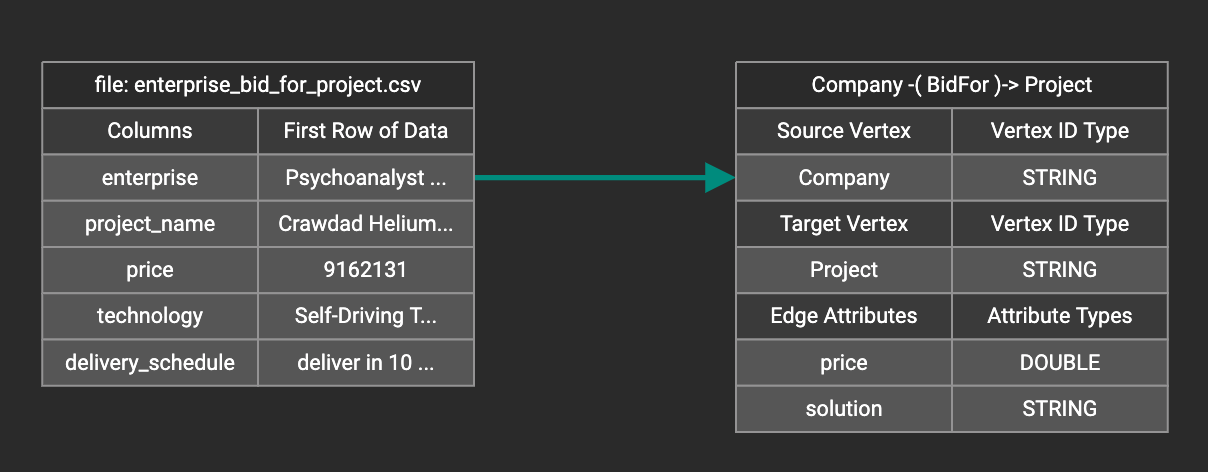
In this step, you link particular columns of a data file to particular ids or attributes of a vertex type or edge type. First, choose one data mapping from one data file to one vertex or edge type (represented as a dashed green link on the left working panel). When selected, the dashed line becomes orange (active), and the right working panel will show two tables. The left table shows the data file columns along with the first row’s tokens as sample data. The right table shows the fields of the target vertex or edge. For a vertex, its fields are primary id and attributes. For an edge, its fields are source vertex, target vertex, and attributes.
In order to a column in the data file to a vertex or edge field, first click the row representing the data column in the left side data file table:
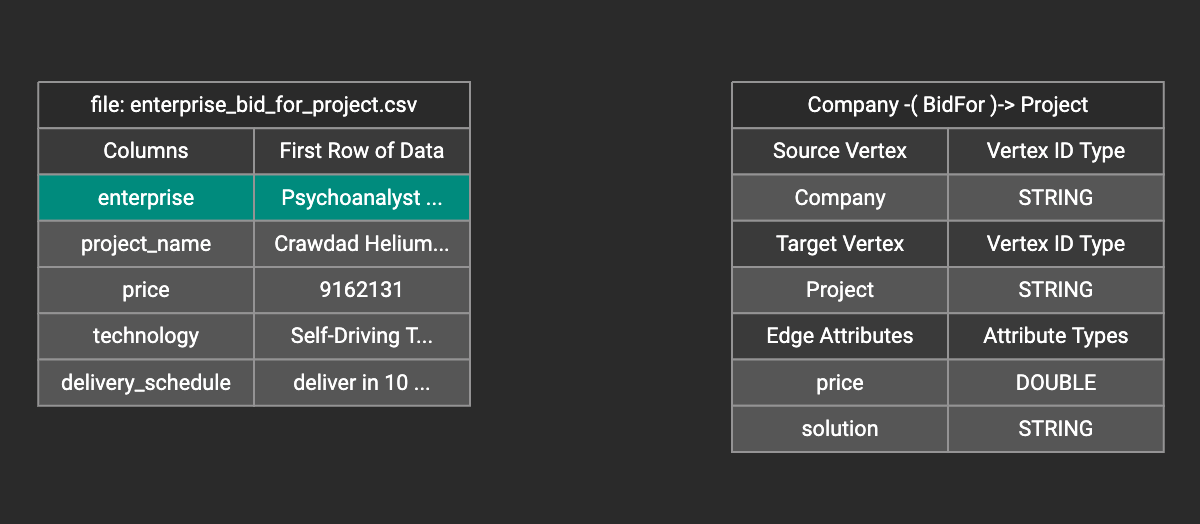
Then, click the row representing the target field in the right side table. A green arrow appears to show the mapping. Repeat as needed to create all the mappings for this table-to-vertex/edge pair. Since many-to-one mapping is allowed, it is not necessary for one table to provide a mapping for every field in the target vertex/edge.
Using a Token Function
GraphStudio gives you access to both a set of built-in functions and user-defined token functions to preprocess data file tokens before loading them in to the graph. For example, you can concatenate two columns in the data file and load them as an attribute. This section describes how to use these token functions.
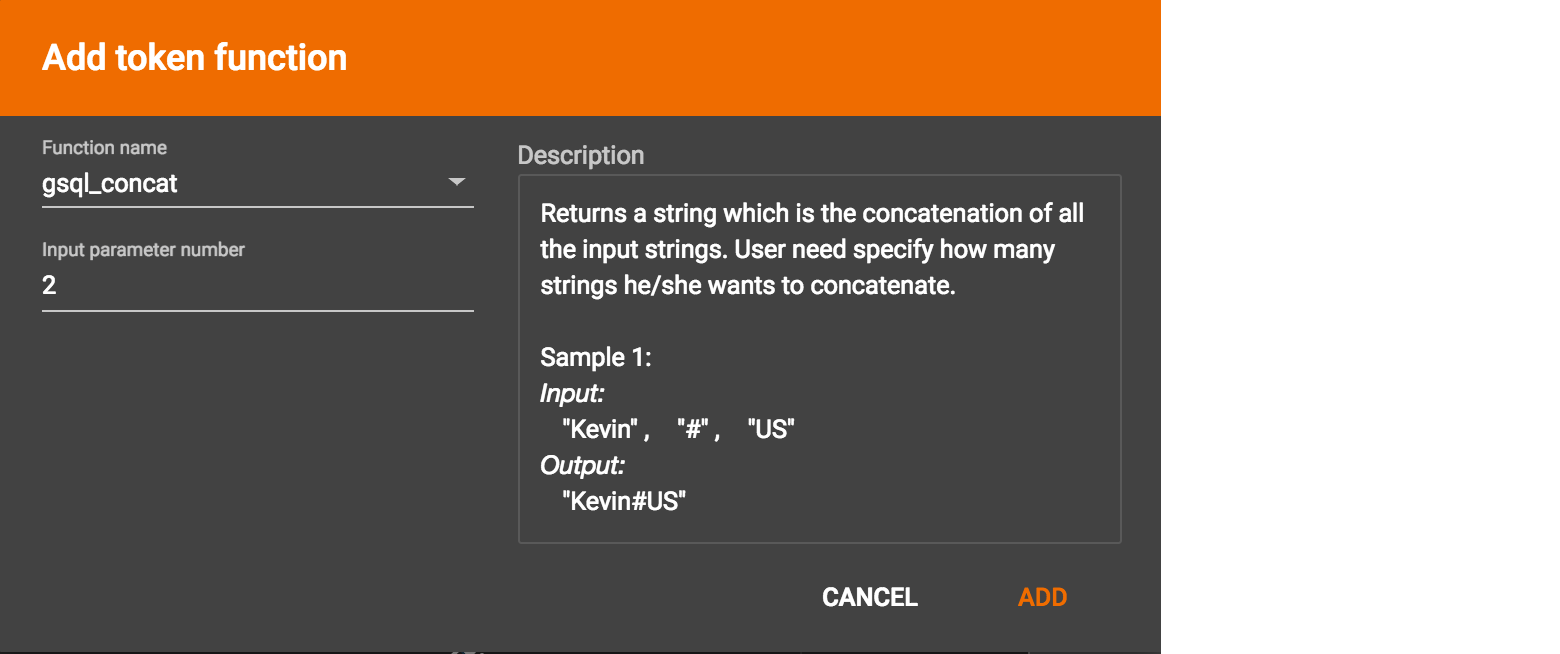
First click the add token function button  . The Add Token Function window will pop up. Click the down arrow to see the list of available token functions and select one. For some functions, you may also specify the number of input parameters. (Most token functions have a fixed number of input parameters; gsql_concat can accept any positive number of inputs). Click Add.
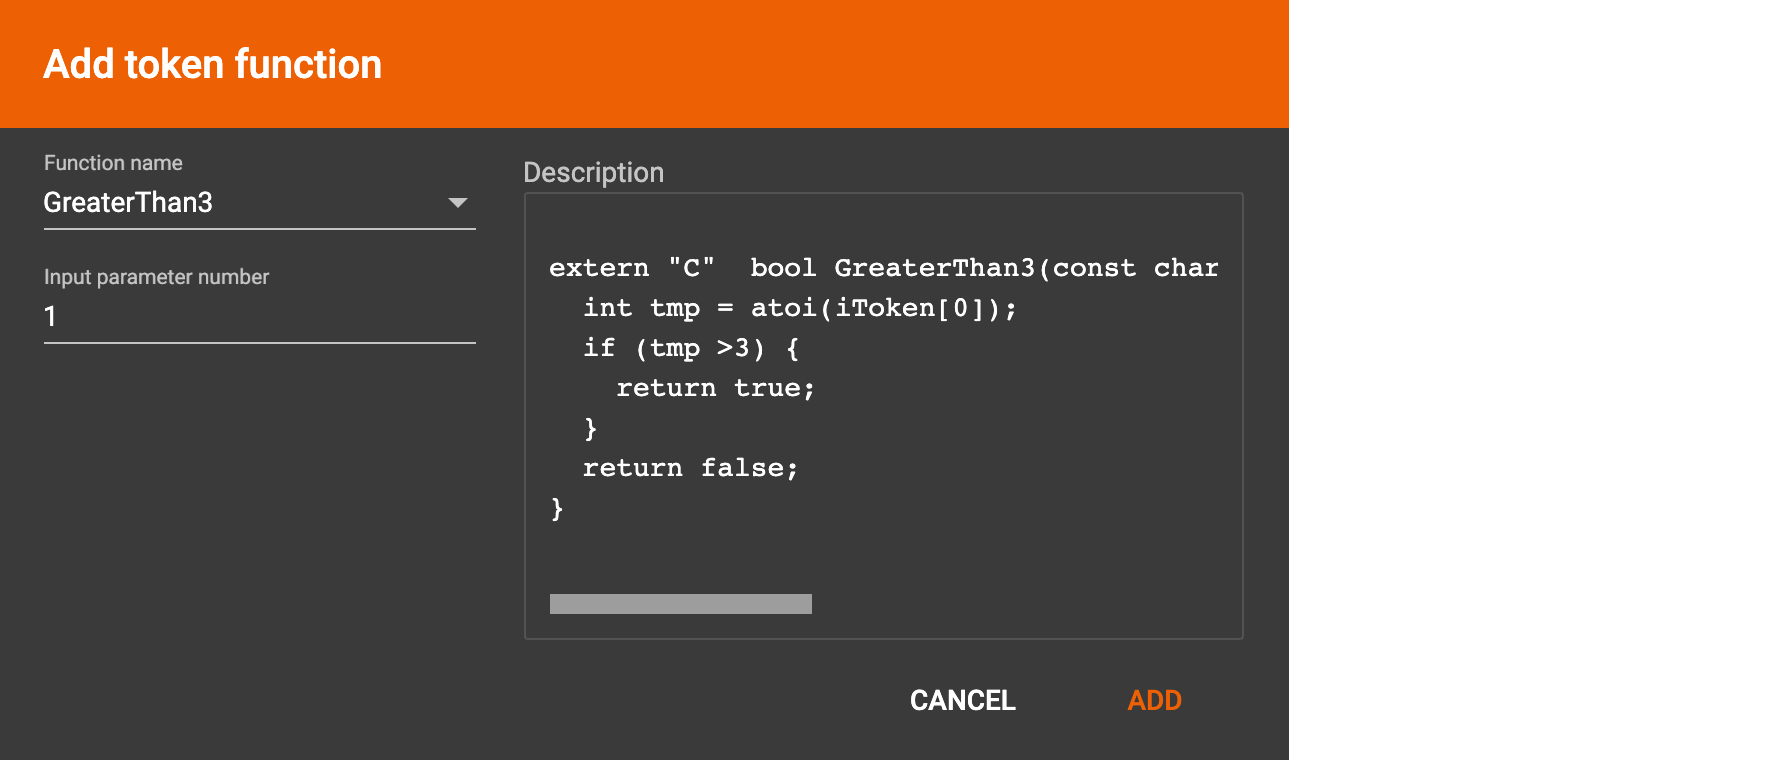
GraphStudio currently does not support creating new user-defined functions. If a user-defined function has been added via the GSQL interface, it will be listed here. To use a user-defined token function, you must manually specify the number of input parameters. The C++ code is shown in the Description section for your reference:
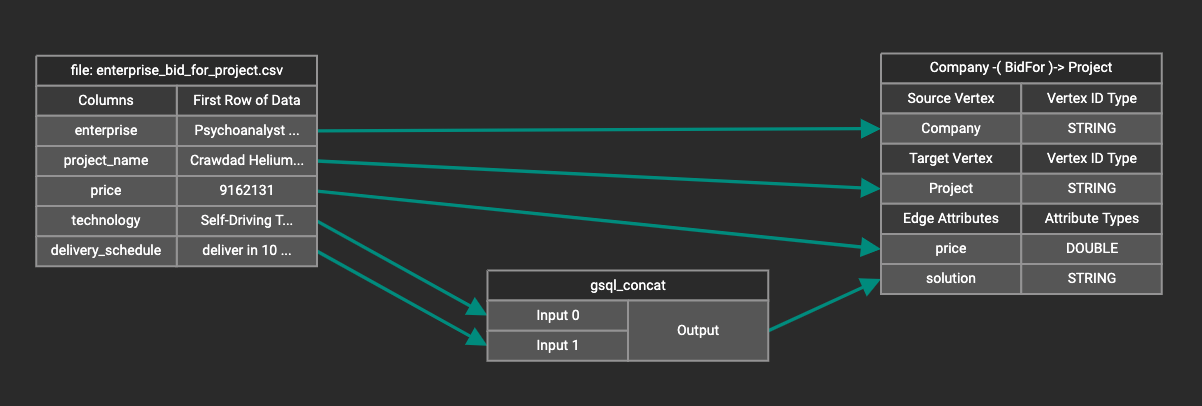
A token function table will be added to the attribute mapping panel. You can drag the tables to re-arrange them. Token functions act as intermediate steps in the mapping. Create mappings from the data file table to the token function table, and then from the token function table to the vertex/attribute table. The final result looks like below:
Auto Mapping
If the data file columns and the vertex/edge attributes have very similar names (only capitalization and hyphen differences), you can click the auto mapping button  . All similar columns will be mapped automatically.
Map A Constant Value To An Attribute Or Token Function Input
Sometimes, a user may need to load a constant value to an id or attribute. Here we show how to do this in GraphStudio.
Loading A Constant to An Attribute
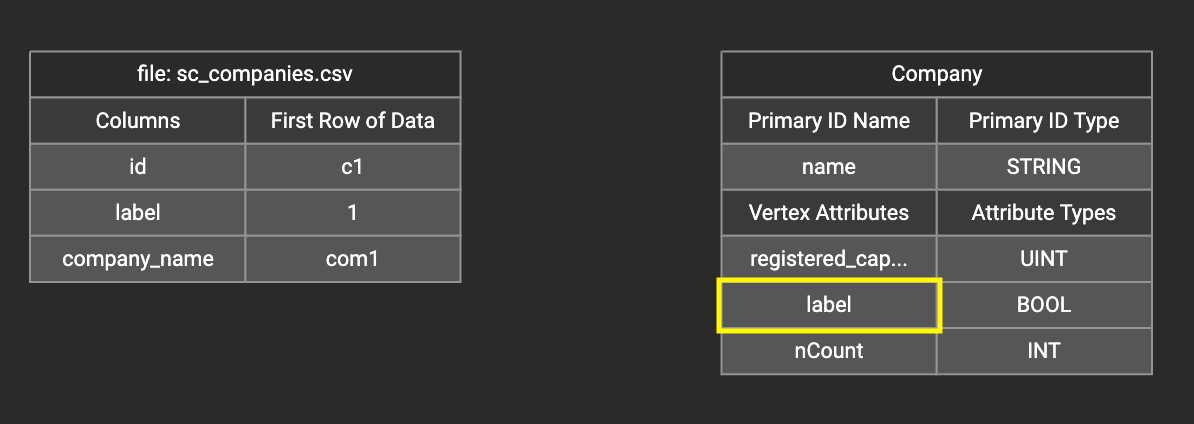
In the right working panel, double-click on the target id or attribute (in the left column of the right table). In the example below, the attribute "label" has been double-clicked:
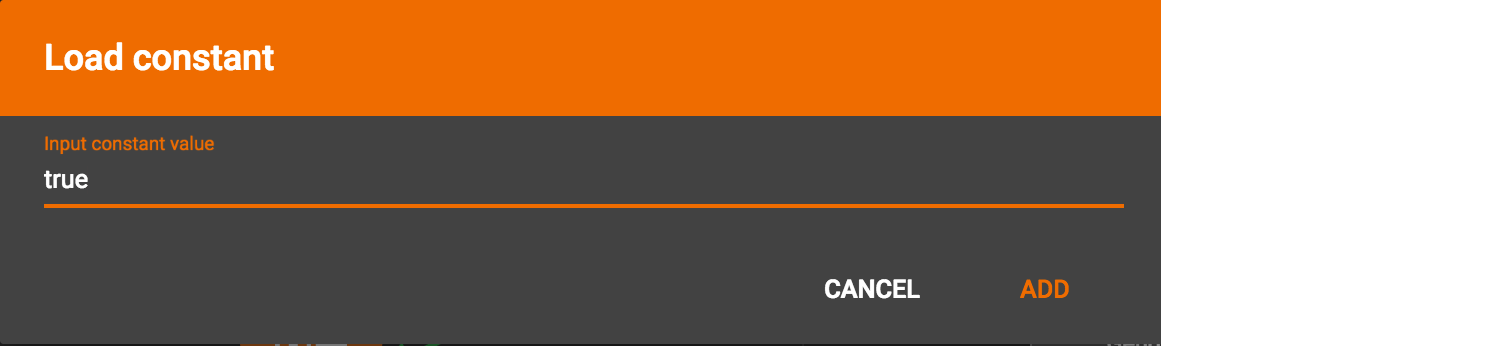
This will cause the Load Constant window to pop up. Type in the constant value, and click the Add button to apply the mapping.
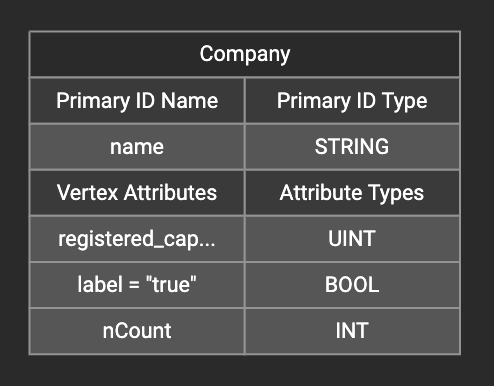
After adding the constant value, the attribute’s label will change to id/attribute = "(your valid input value)" .
To modify or remove a constant mapping, double-click the id/attribute again. In the Load Constant window, enter the new value, or erase the value if you want to remove the mapping. Click the Add button to apply.
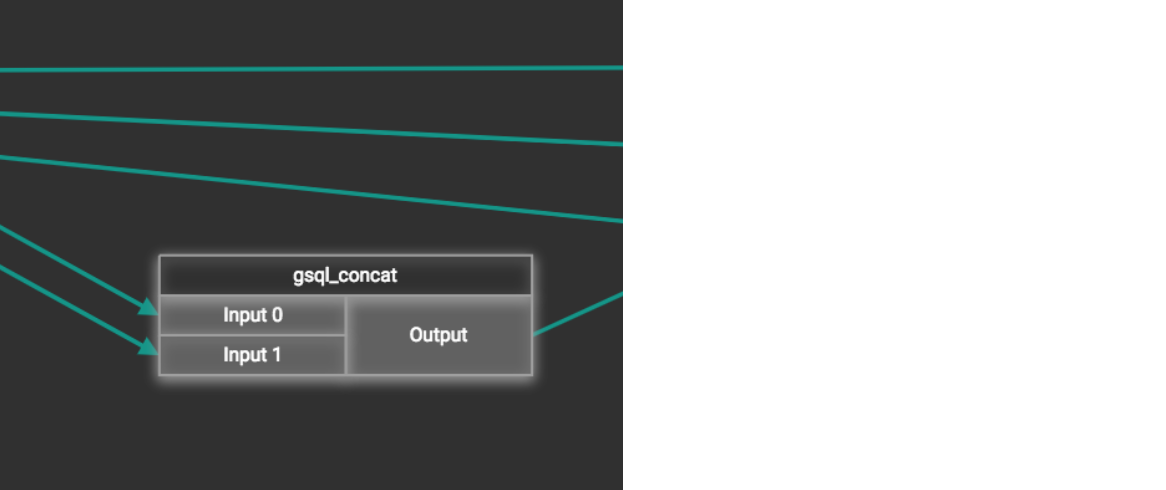
Use A Constant Input for a Token Function
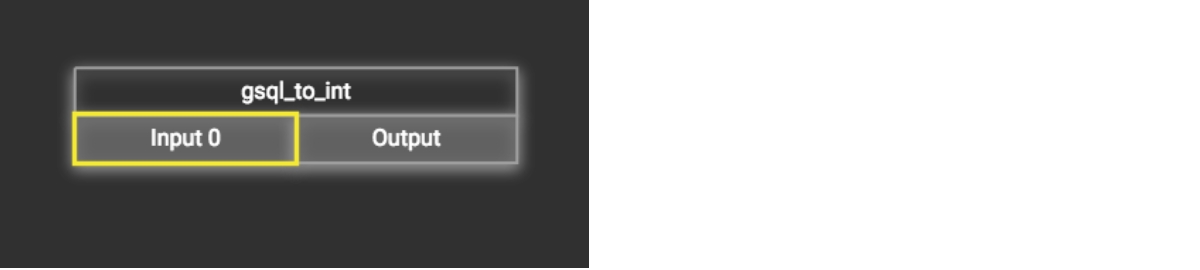
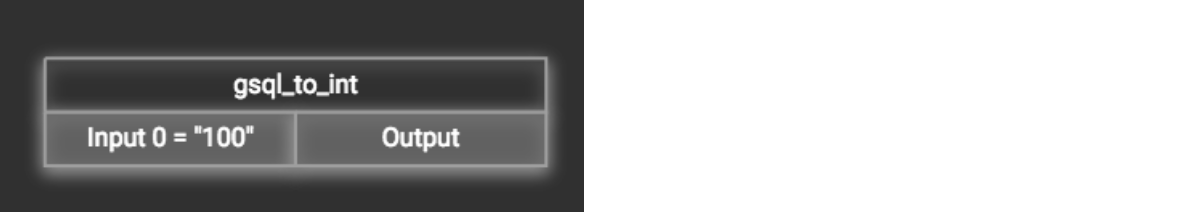
First add the token function. Then double-click on the target input (in the left column of the token function table). In the example below, "Input 0" has been double-clicked.
This will cause the Load Constant window to pop up. Type in the constant value and click the Add button to apply the mapping. After adding the constant value, the input’s label will change to Input = "(your input value)" .
The constant value can be modified or removed by double-clicking the label and editing the value in the Load Constant window.
Add Data Filter
You can add a data filter to a data mapping so that only data records which meet conditions that you specify will be loaded into the graph. This is equivalent to the WHERE clause in a GSQL load statement.
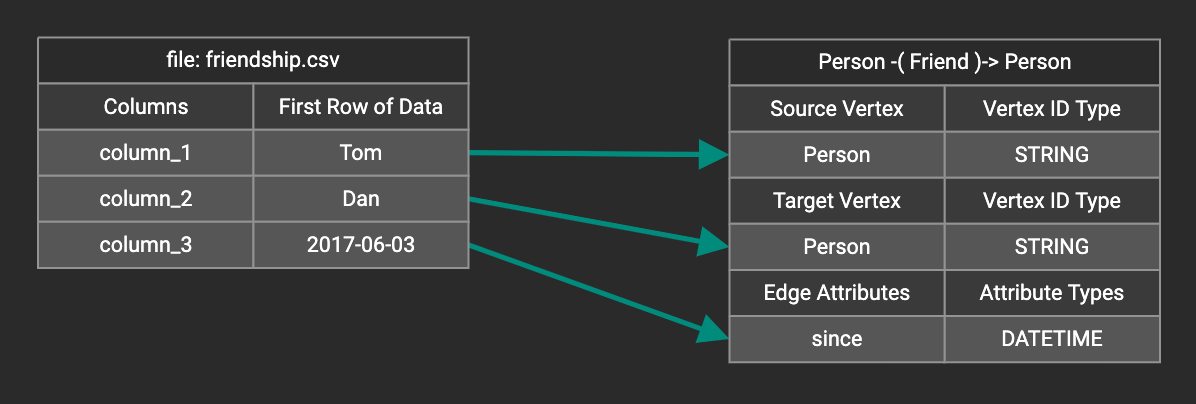
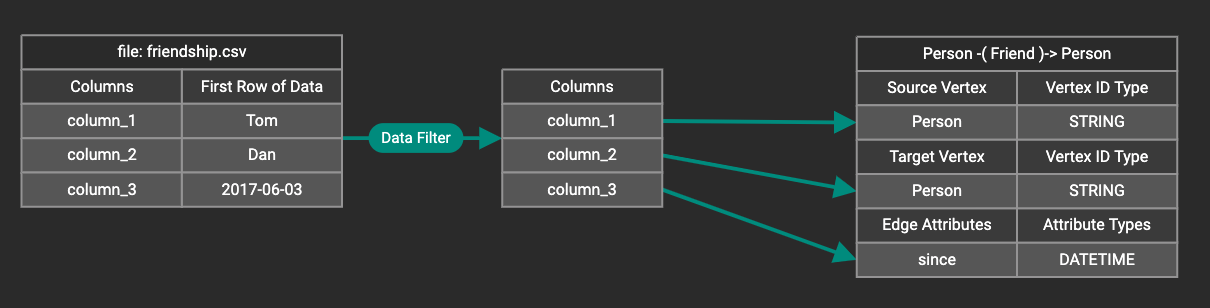
You can add one data filter for each data mapping from a data file to a vertex type or edge type, and the data filter only applies to that one mapping. Consider the following data mapping:
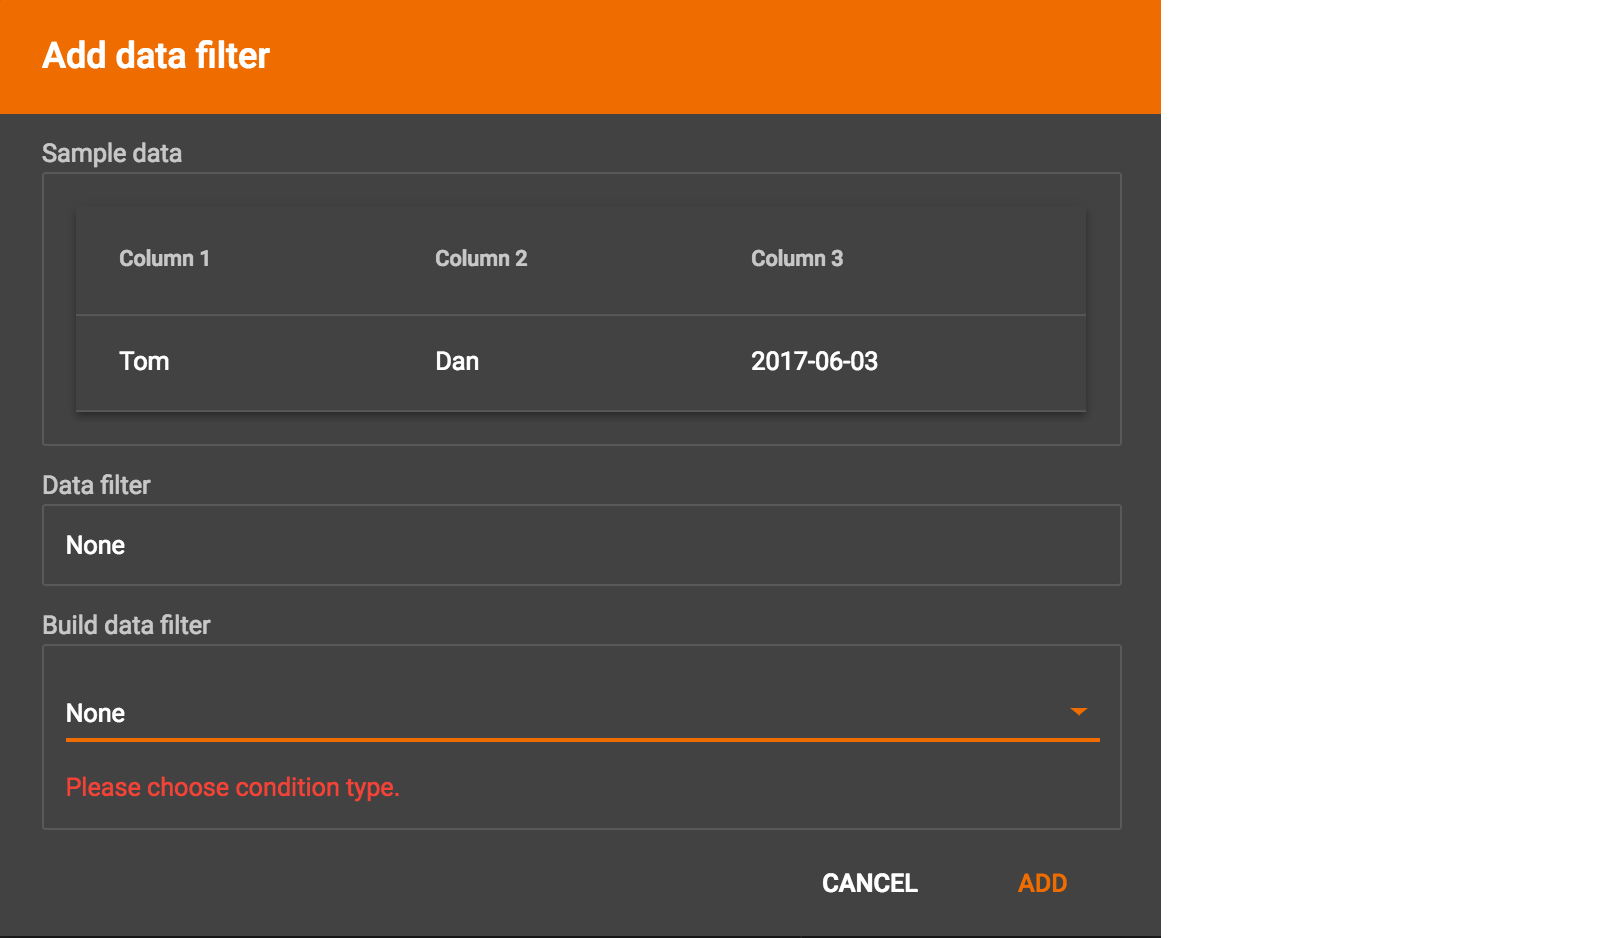
By default, there is no data filter. Click the Data Filter button %20(1)%20(2).png) to start creating a data filter. The Add Data Filter window will appear. The window contains three parts:
to start creating a data filter. The Add Data Filter window will appear. The window contains three parts:
-
The top section shows one row of sample data from your file, as a handy reference to the file’s contents.
-
The middle sections shows what the data filter looks like when it is converted a to GSQL WHERE clause. For more details, see the WHERE Clause section in the GSQL Language Reference Part 1 - Defining Graphs and Loading Data
-
The bottom section is where you define your data filter. The data filter will be converted to a GSQL WHERE clause and shown in real time.
A data filter condition is a Boolean expression, which can be a nested set of conditions. TigerGraph data loader evaluates the condition for each line in your input file. If the condition evaluates to be true, then the line of data is loaded.
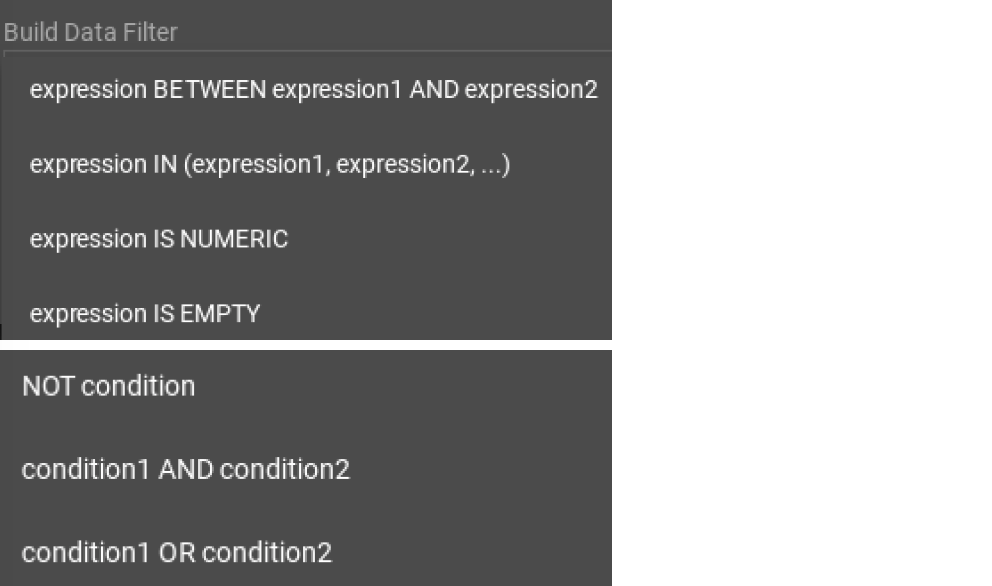
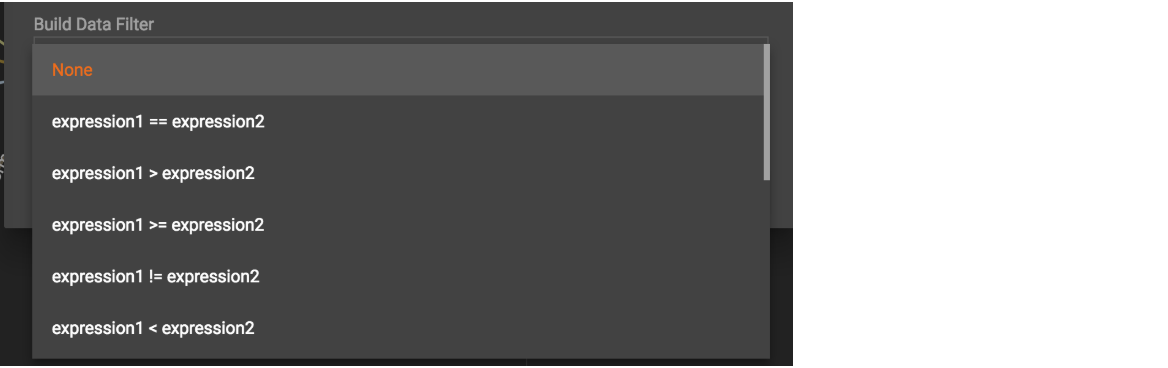
First, click the Build Data Filter chooser (with default value "None"). A menu will appear, with many Boolean expression templates. Choose one of the options. If you plan to build a nested condition, start with your top level. The first several options are for comparison expressions:
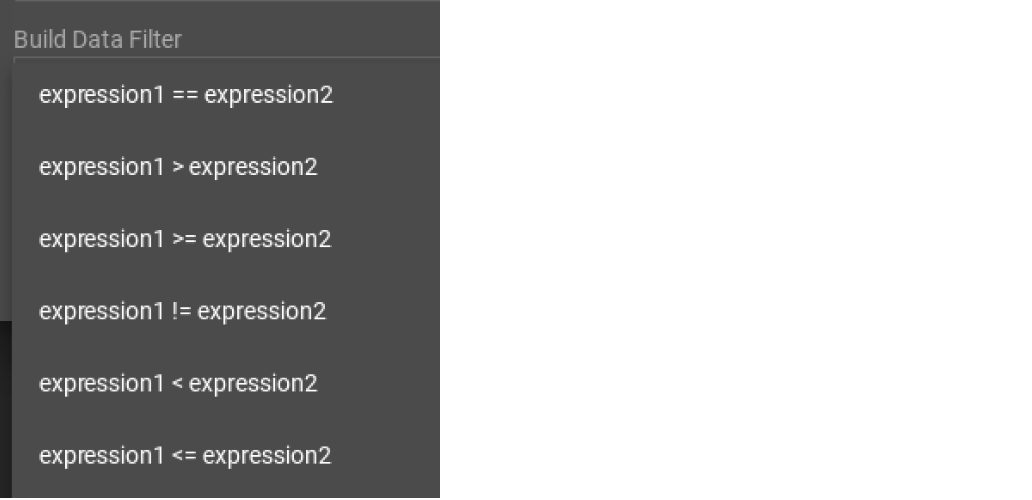
After this are several more options, using operators such as AND, OR, NOT, IN, BETWEEN…AND, IS NUMERIC, and IS EMPTY.
Note that each of these expressions calls for 1, 2, 3, or a list of operands, and the operands themselves can be expressions. When you select an expression, additional choosers will appear below for you to specify the operand expressions. The operand choices are context-sensitive, but typically they include
-
a Data Column from the input file
-
A constant value
-
If the operator is AND, OR, or NOT, then the operand can be another condition. Thus is how conditions can be nested.
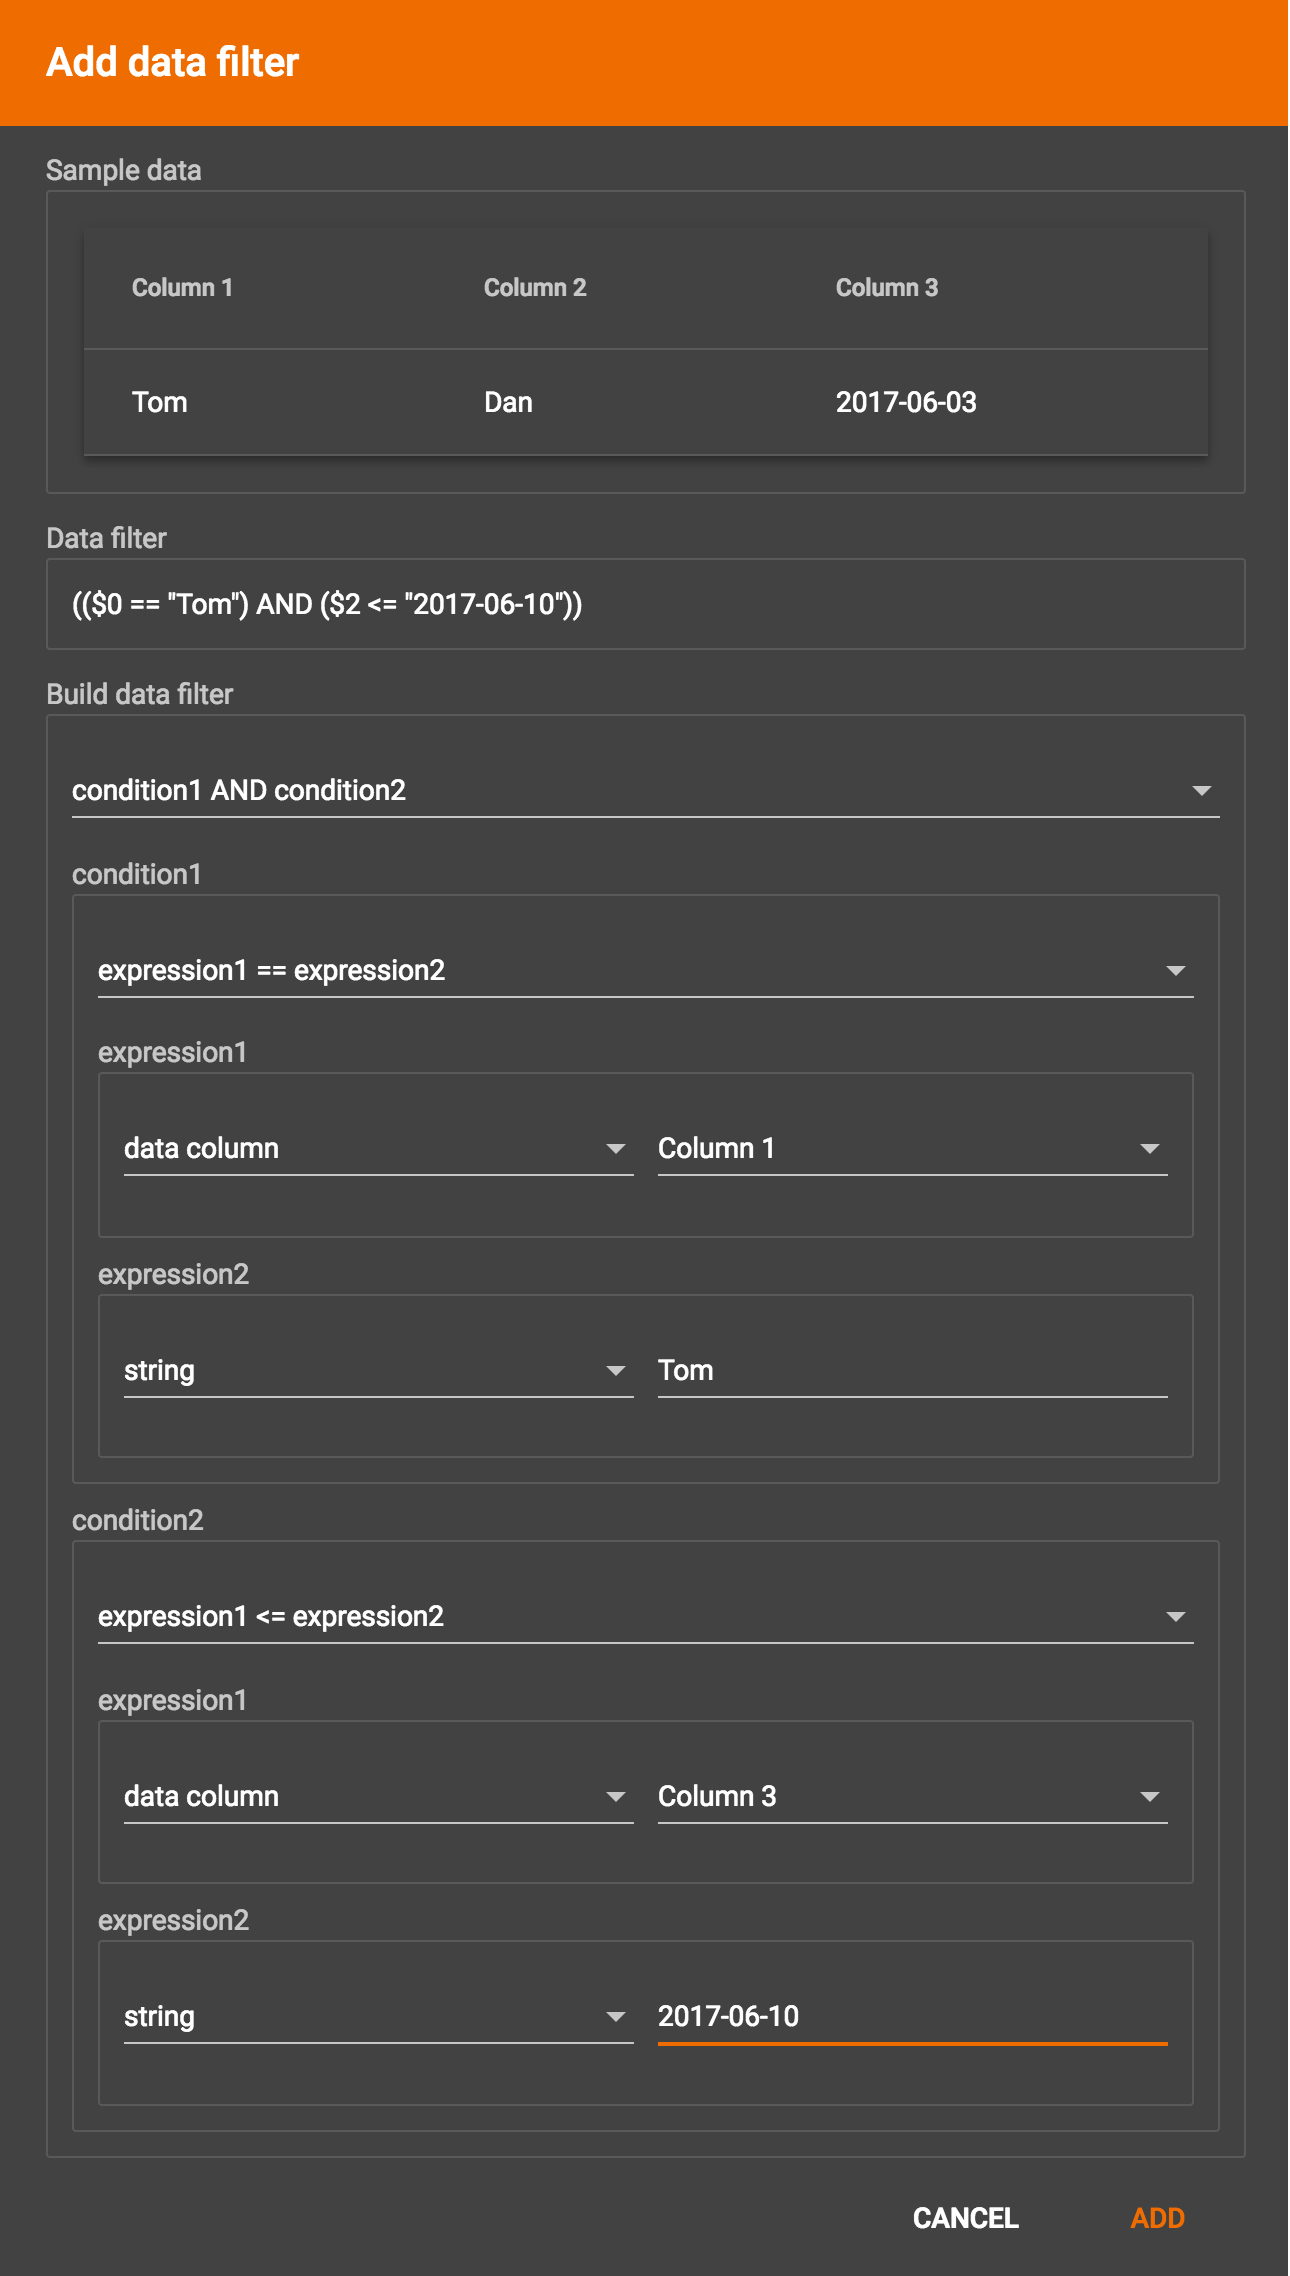
Suppose you are loading friendship edges where the input data fields are (person1, person2, friendship_start_date). You want to load only the records where person1 is Tom and the friendship began on or before 2017-06-10. The data filter looks like the following:
After adding the data filter, the right working panel will look like this:
Hovering the mouse over the data filter
indicator  will
make the data filter condition appear. If you want to modify the data
filter, click the Data Filter
button or
double-click the data filter indicator. The Add Data Filter panel will
appear.
will
make the data filter condition appear. If you want to modify the data
filter, click the Data Filter
button or
double-click the data filter indicator. The Add Data Filter panel will
appear.
To remove a data filter, select "None" at the top level dropdown of Build Data Filter section and then click Add. The data filter will be deleted.
Advanced Features
More advanced data mapping features are grouped in the dropdown list
under  .
.
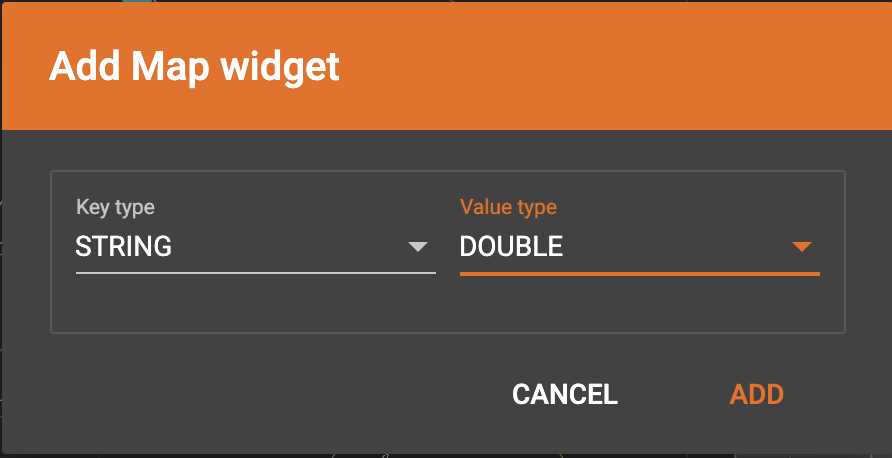
Map data to a map type attribute
Click  in the
dropdown list, then choose key type and value type. The types must match
the key type and value type of the attribute you are mapping towards.
in the
dropdown list, then choose key type and value type. The types must match
the key type and value type of the attribute you are mapping towards.
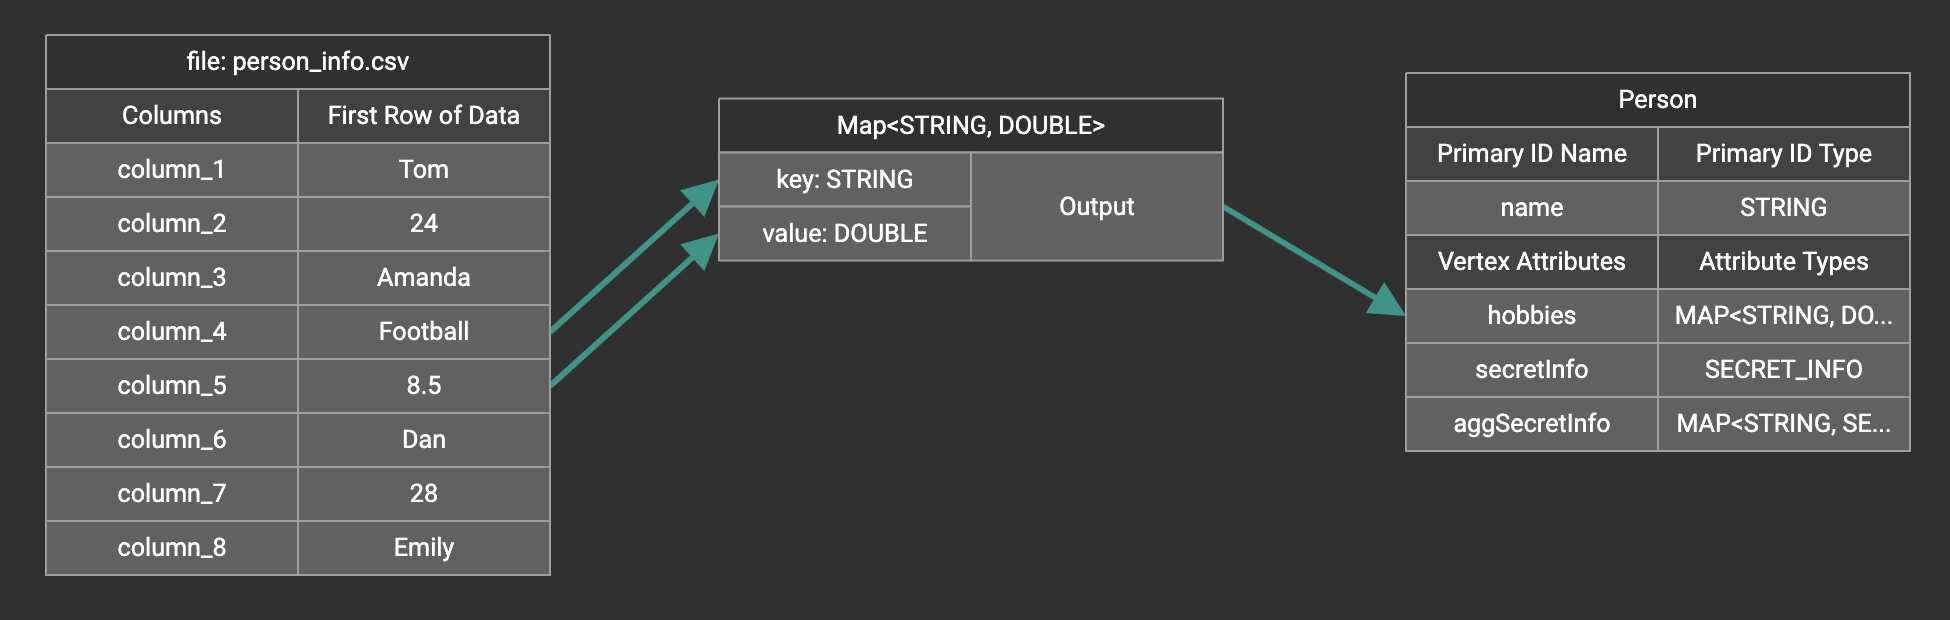
A Map widget will be added to the attribute mapping panel.
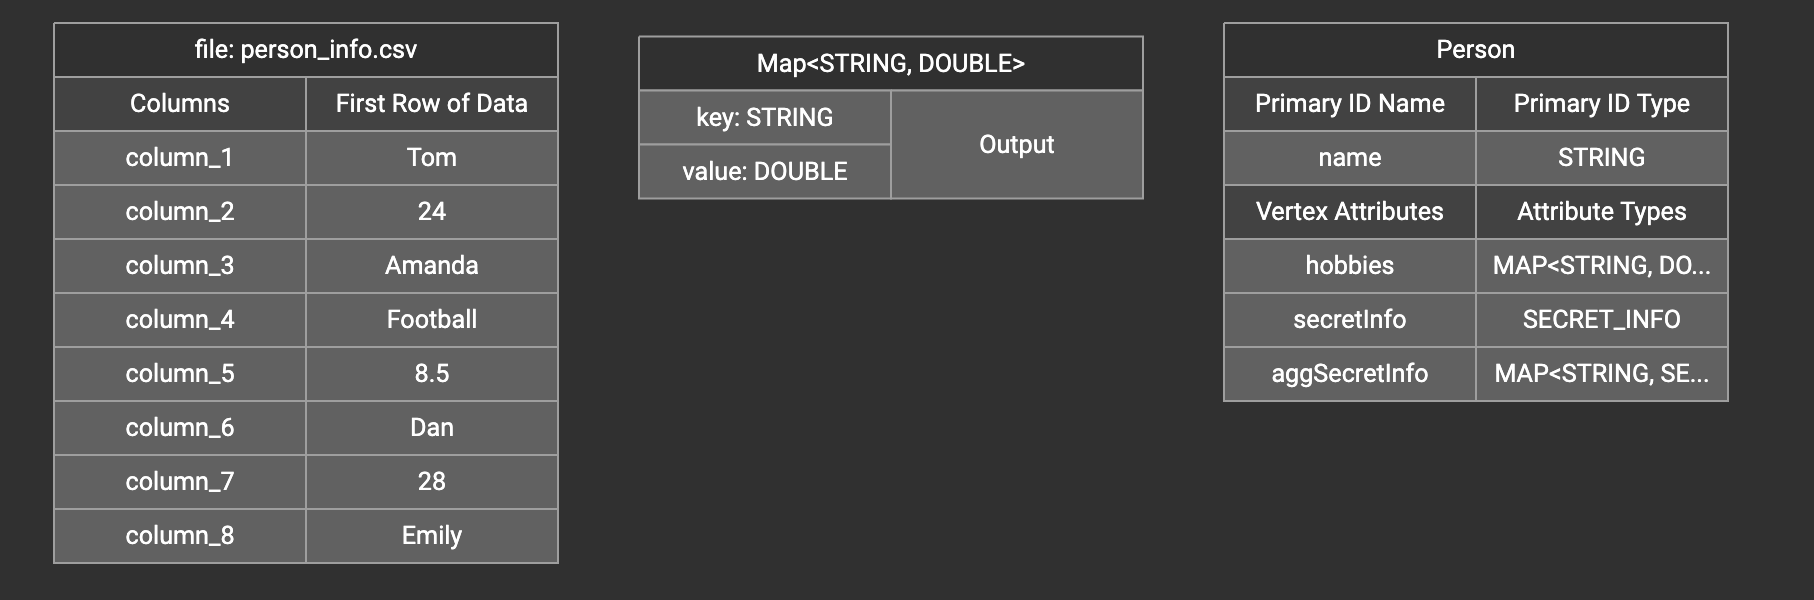
Create the mapping from the data columns to the Map widget, and from the Map widget to the attribute.
Map data to a UDT type attribute
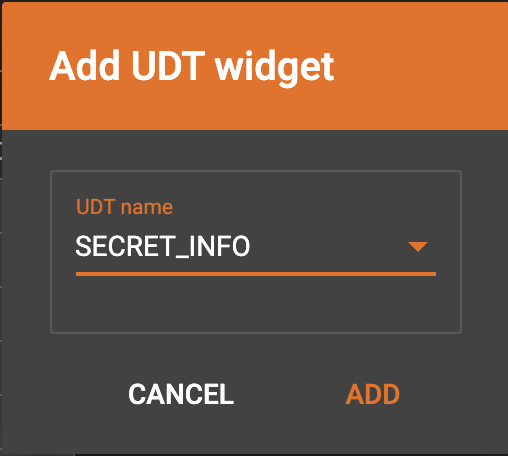
Click  in the
dropdown list, then choose UDT name. The name must match the UDT type of
the attribute you are mapping towards.
in the
dropdown list, then choose UDT name. The name must match the UDT type of
the attribute you are mapping towards.
A UDT widget will be added to the attribute mapping panel.
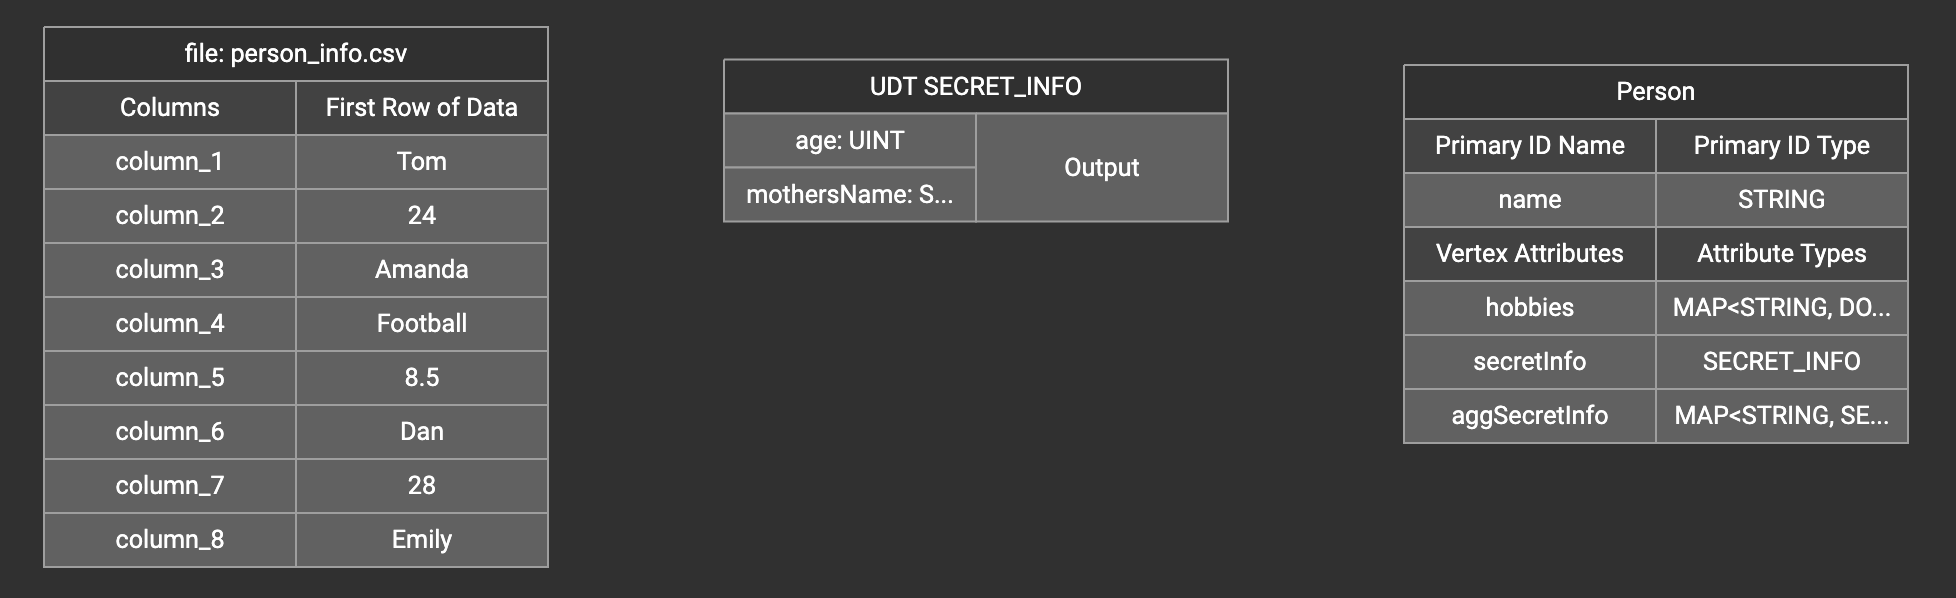
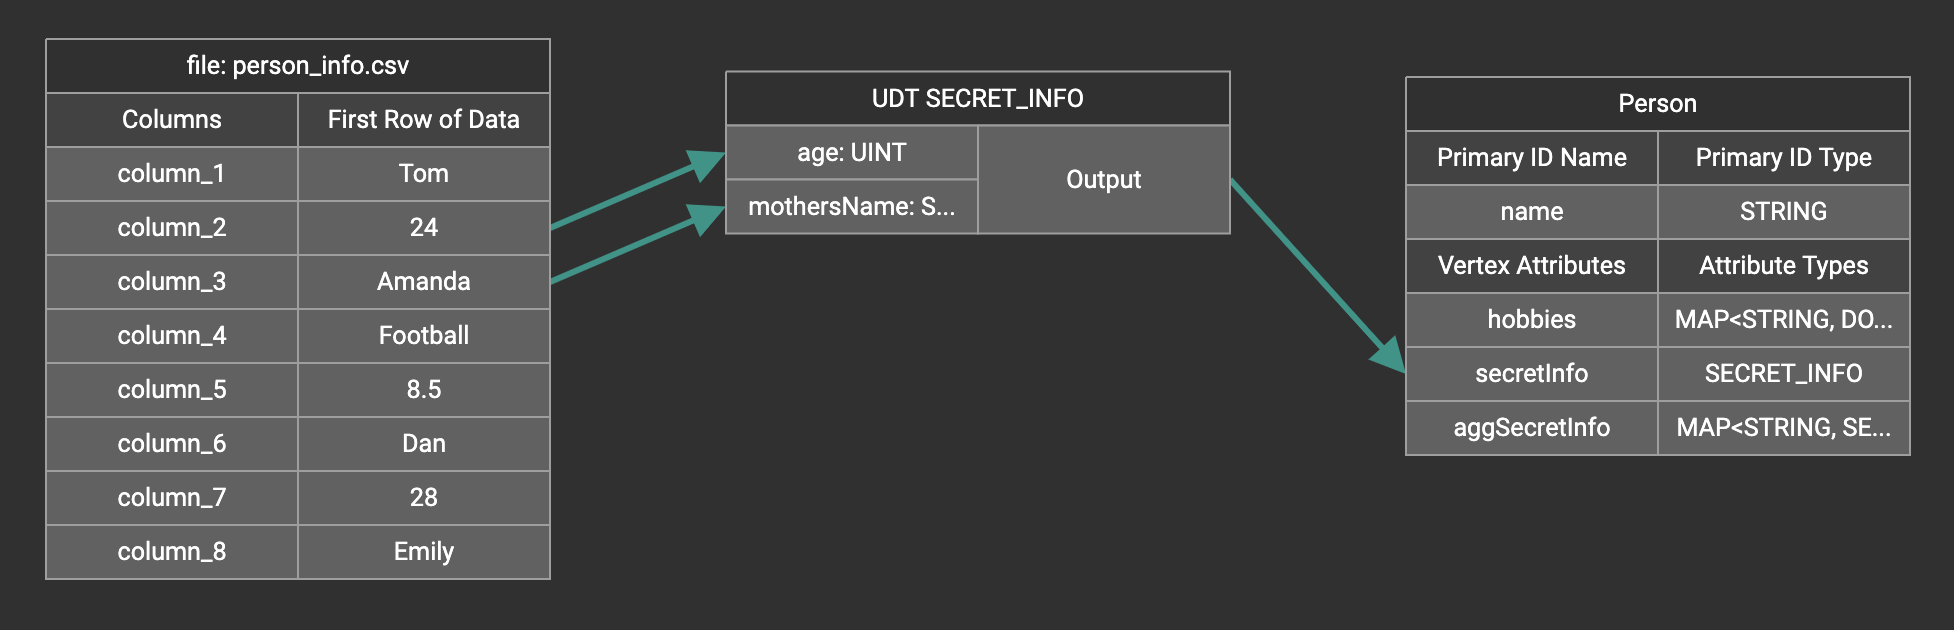
Create the mapping from the data columns to the UDT widget, and from the UDT widget to the attribute.
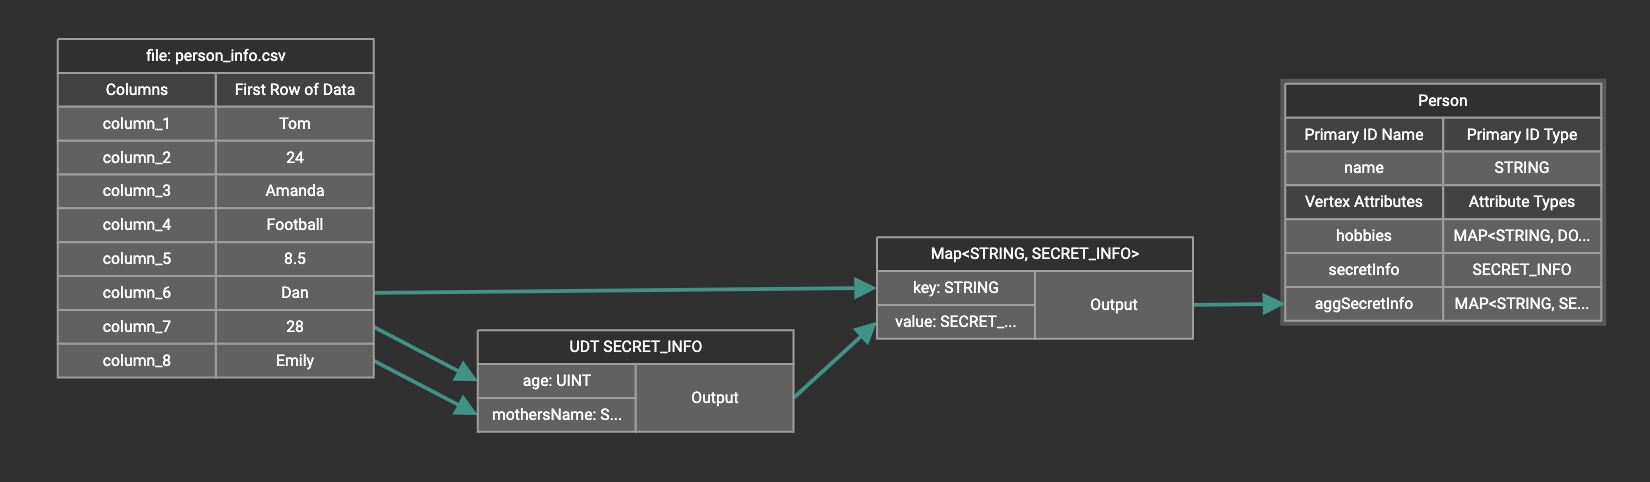
Map data to a map type attribute with UDT value type
If you want to map data to an attribute of map type with UDT value type, you have to combine a Map widget with a UDT widget.
Choose UDT as the value type and then choose the UDT name when adding the Map widget.
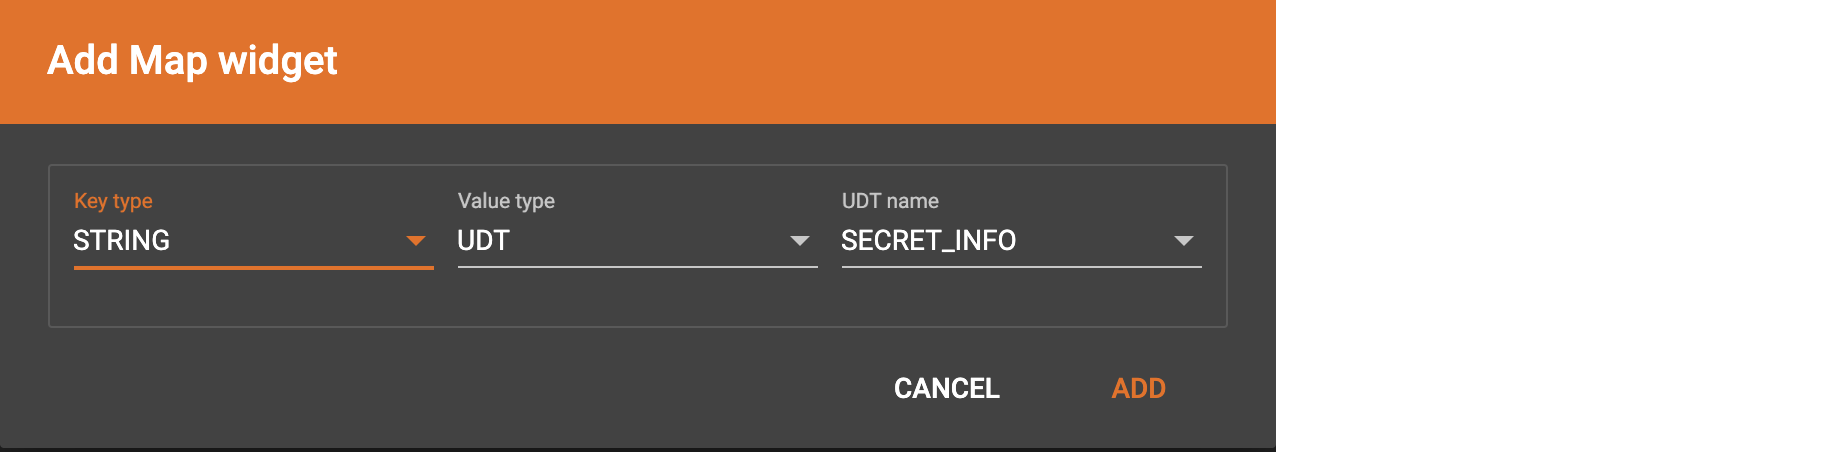
Create data mapping between data columns, the UDT widget, the Map widget, and the attribute.
Delete Options
In the Map Data To Graph page, you can delete anything that you added.
Choose what you want to delete, then click the delete
button  . Press the
"Shift" key to select multiple icons you want to delete. Note that you
cannot delete vertex or edge types in this page.
. Press the
"Shift" key to select multiple icons you want to delete. Note that you
cannot delete vertex or edge types in this page.
Delete Data File To Vertex Or Edge Mapping
Select the dashed green link(s) between data file and mapped vertex/edge type, then click the delete button.
Delete Data Column To Vertex Or Edge Attribute Mapping
Select the green arrow(s) between data file table and vertex/edge attributes table, then click the delete button.
.png)
Undo And Redo
You can undo or redo changes by clicking the Back or Forward buttons,
respectively:  . The
whole history since the time you entered the Map Data To Graph page is
recorded.
. The
whole history since the time you entered the Map Data To Graph page is
recorded.

