Write Queries
On the Write Queries page, you can write and run custom queries with GSQL.
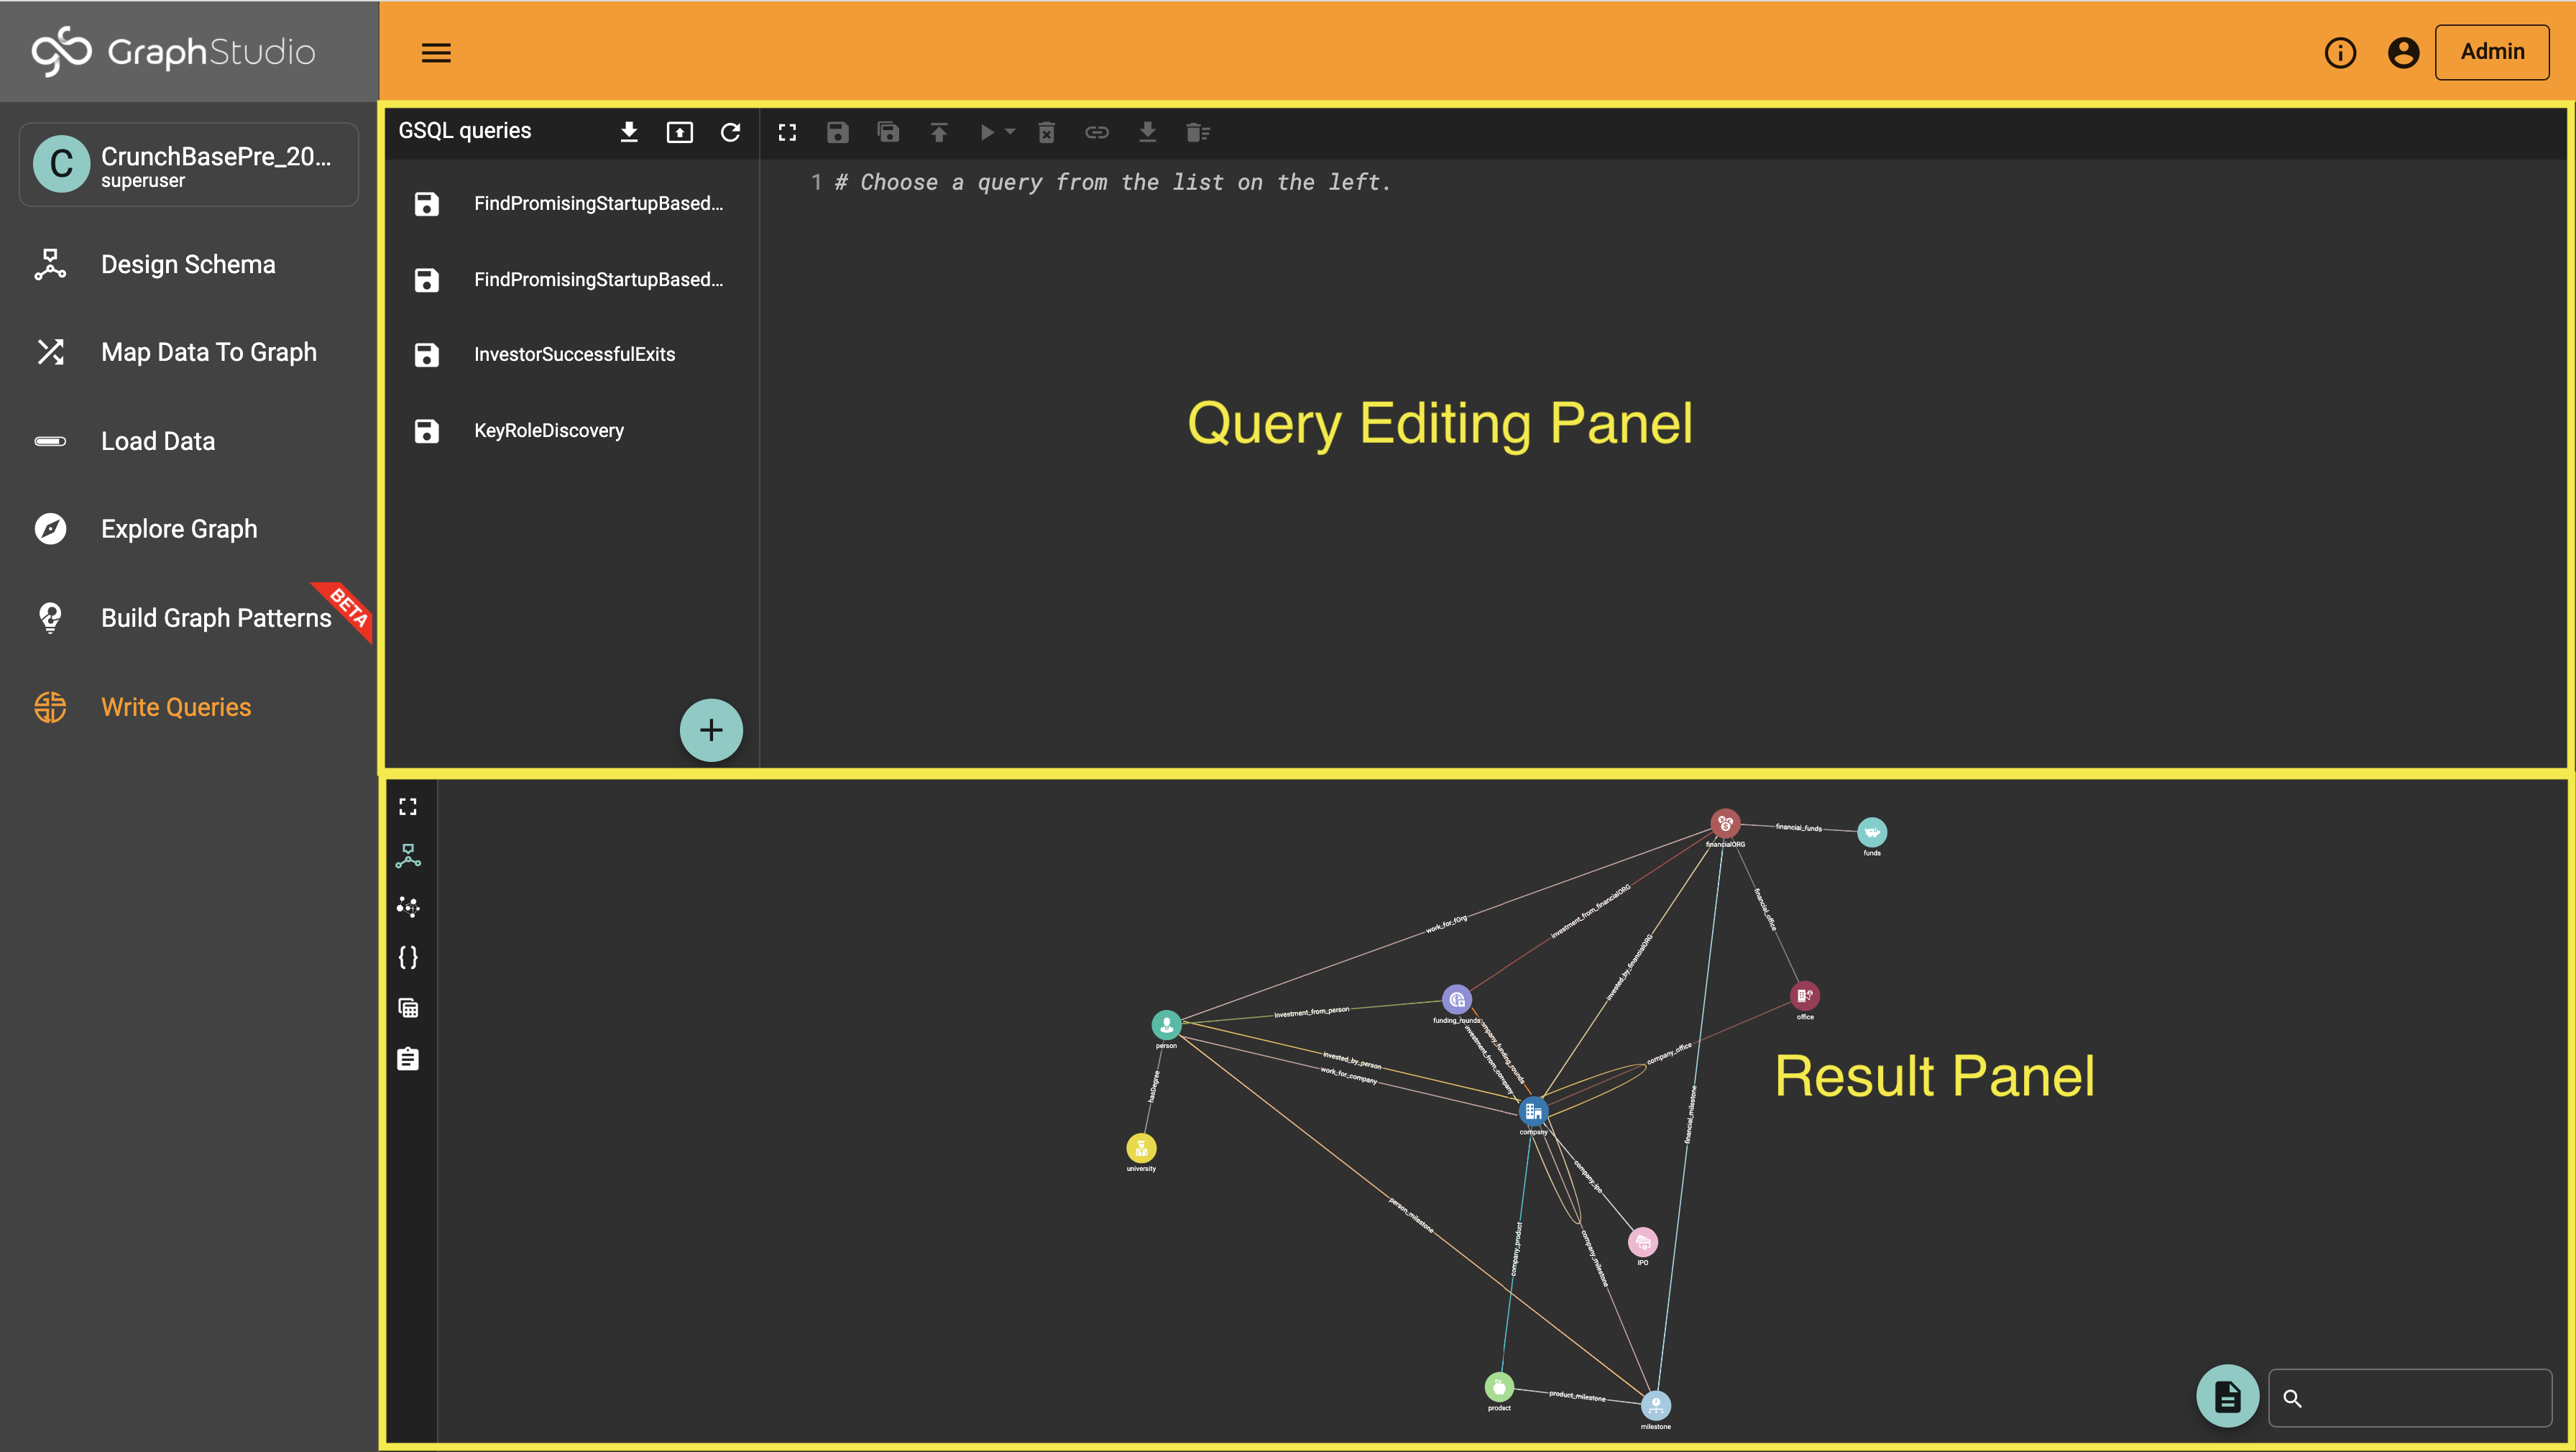
The Write Query page is horizontally divided into two parts:
-
Query Editing Panel
-
Result, Log and Visualization Panel
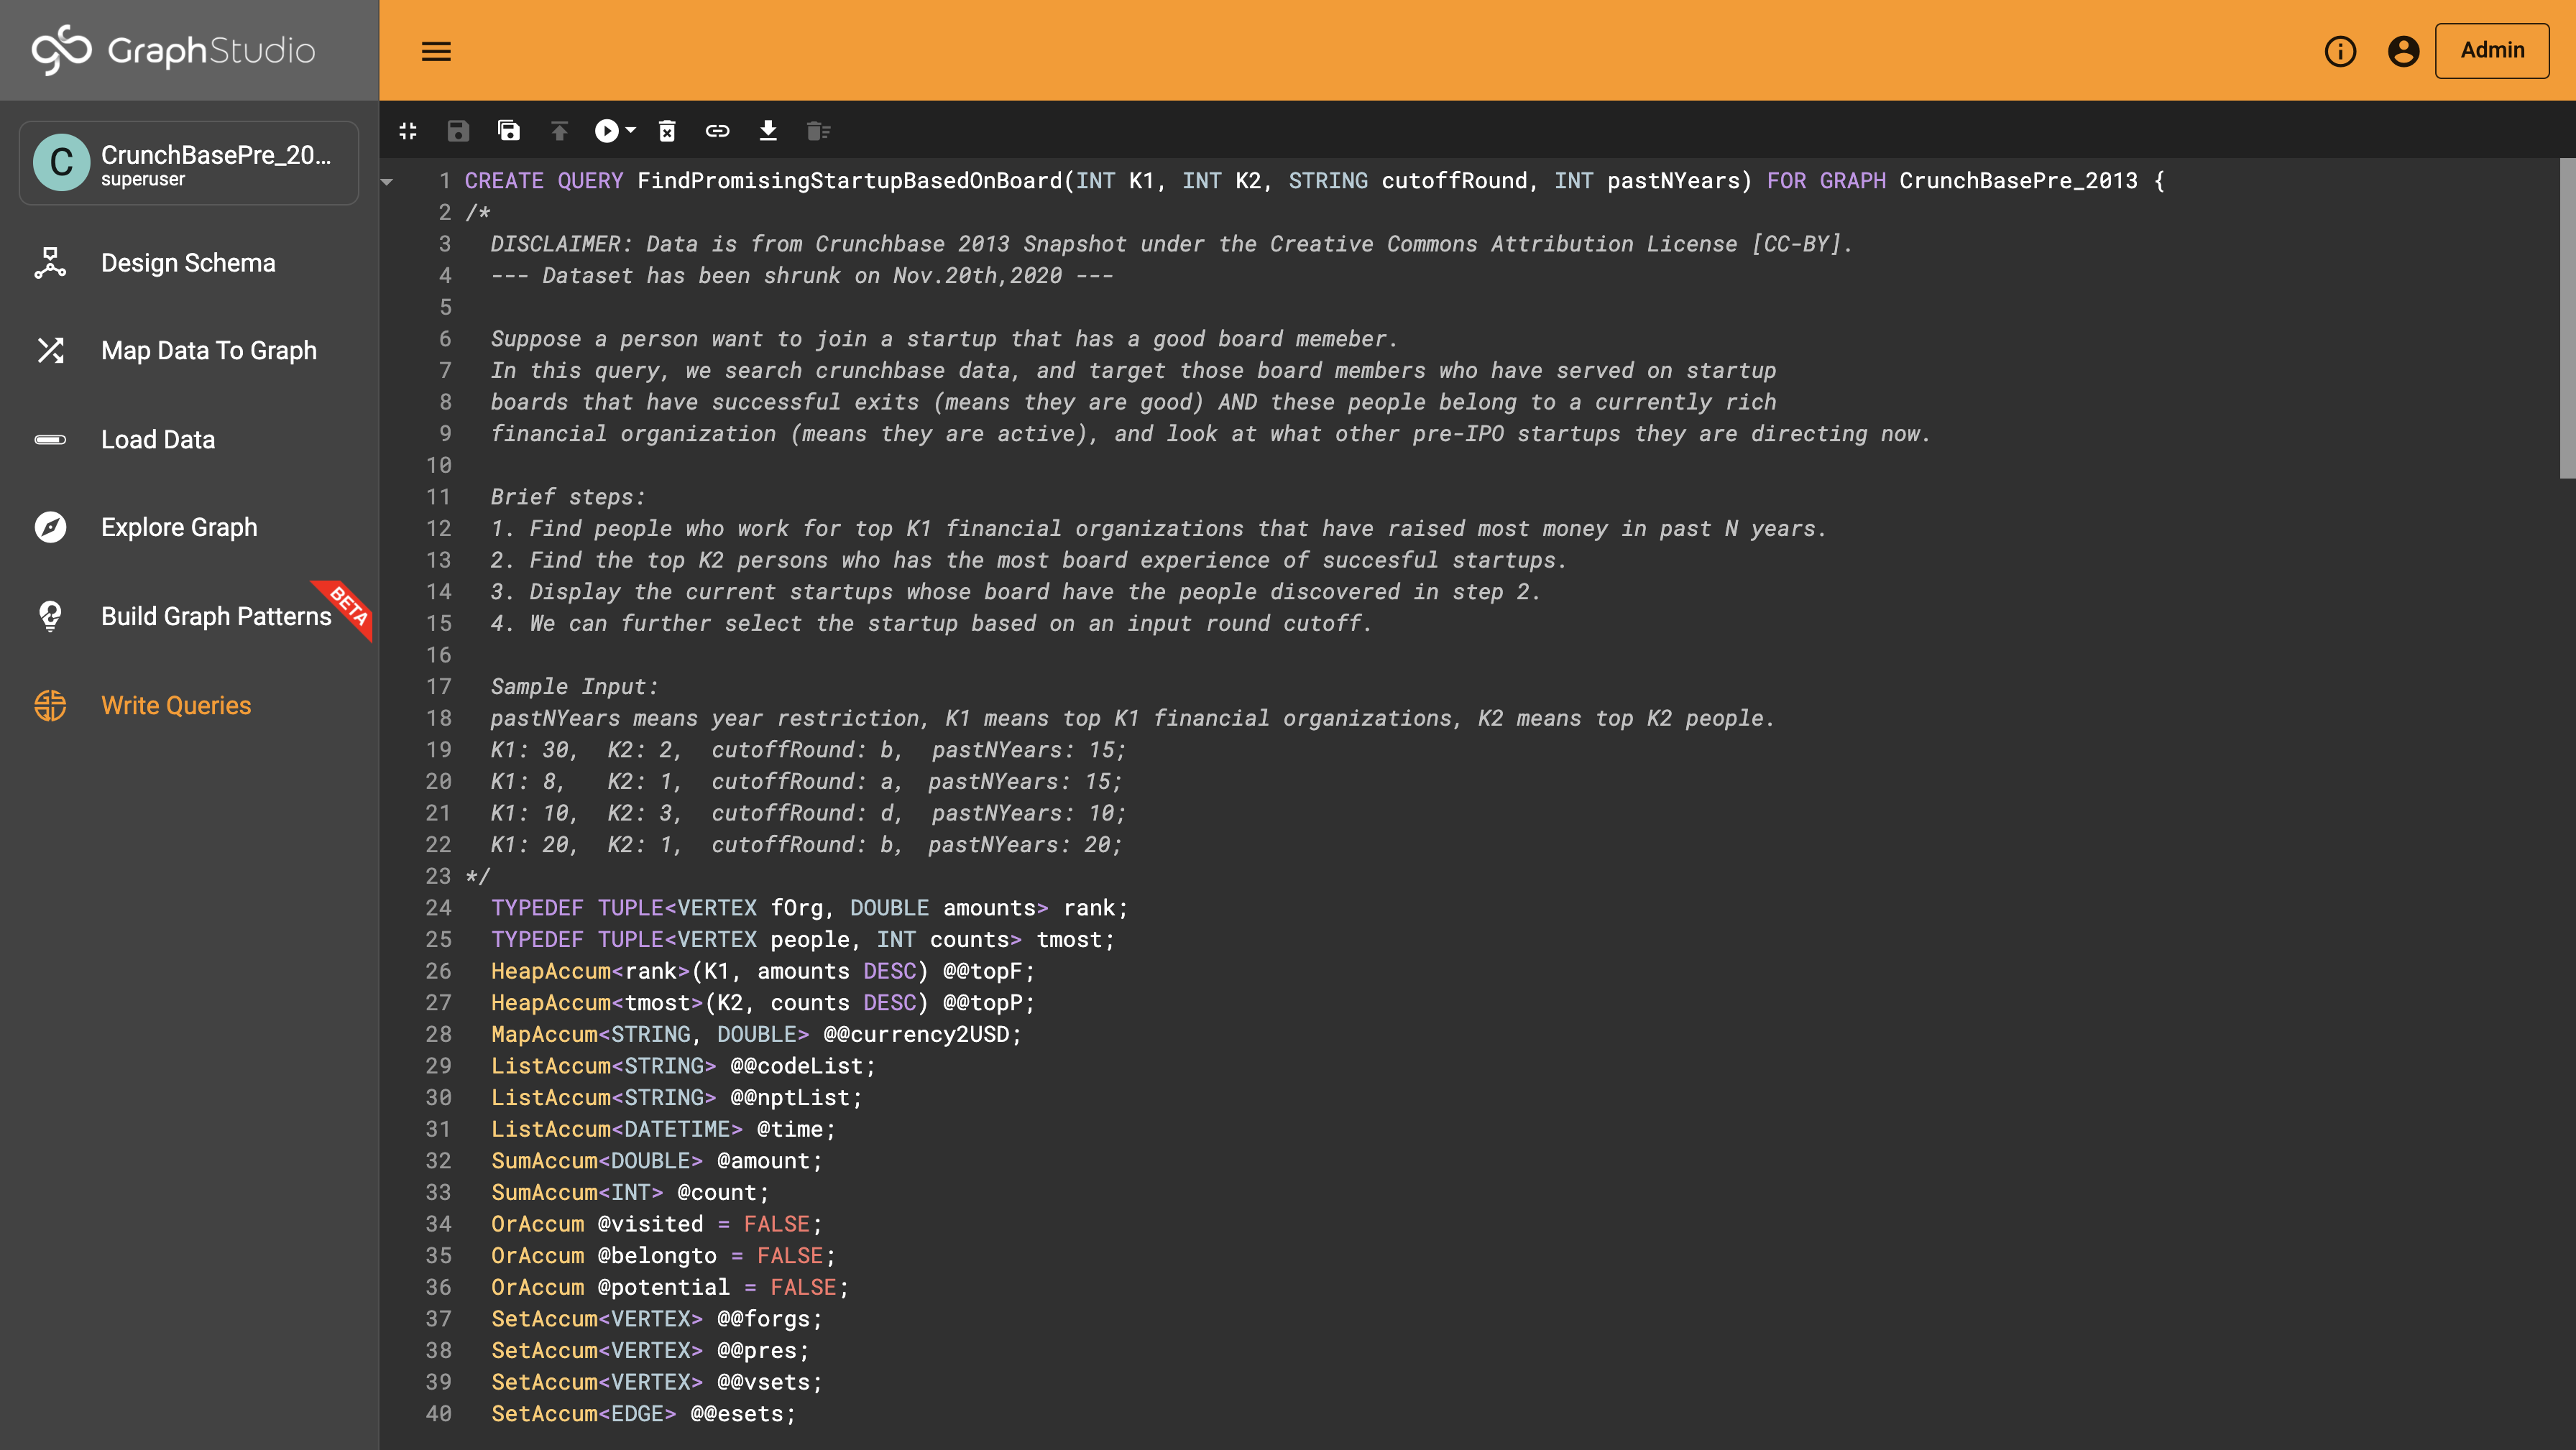
Query Editing Panel
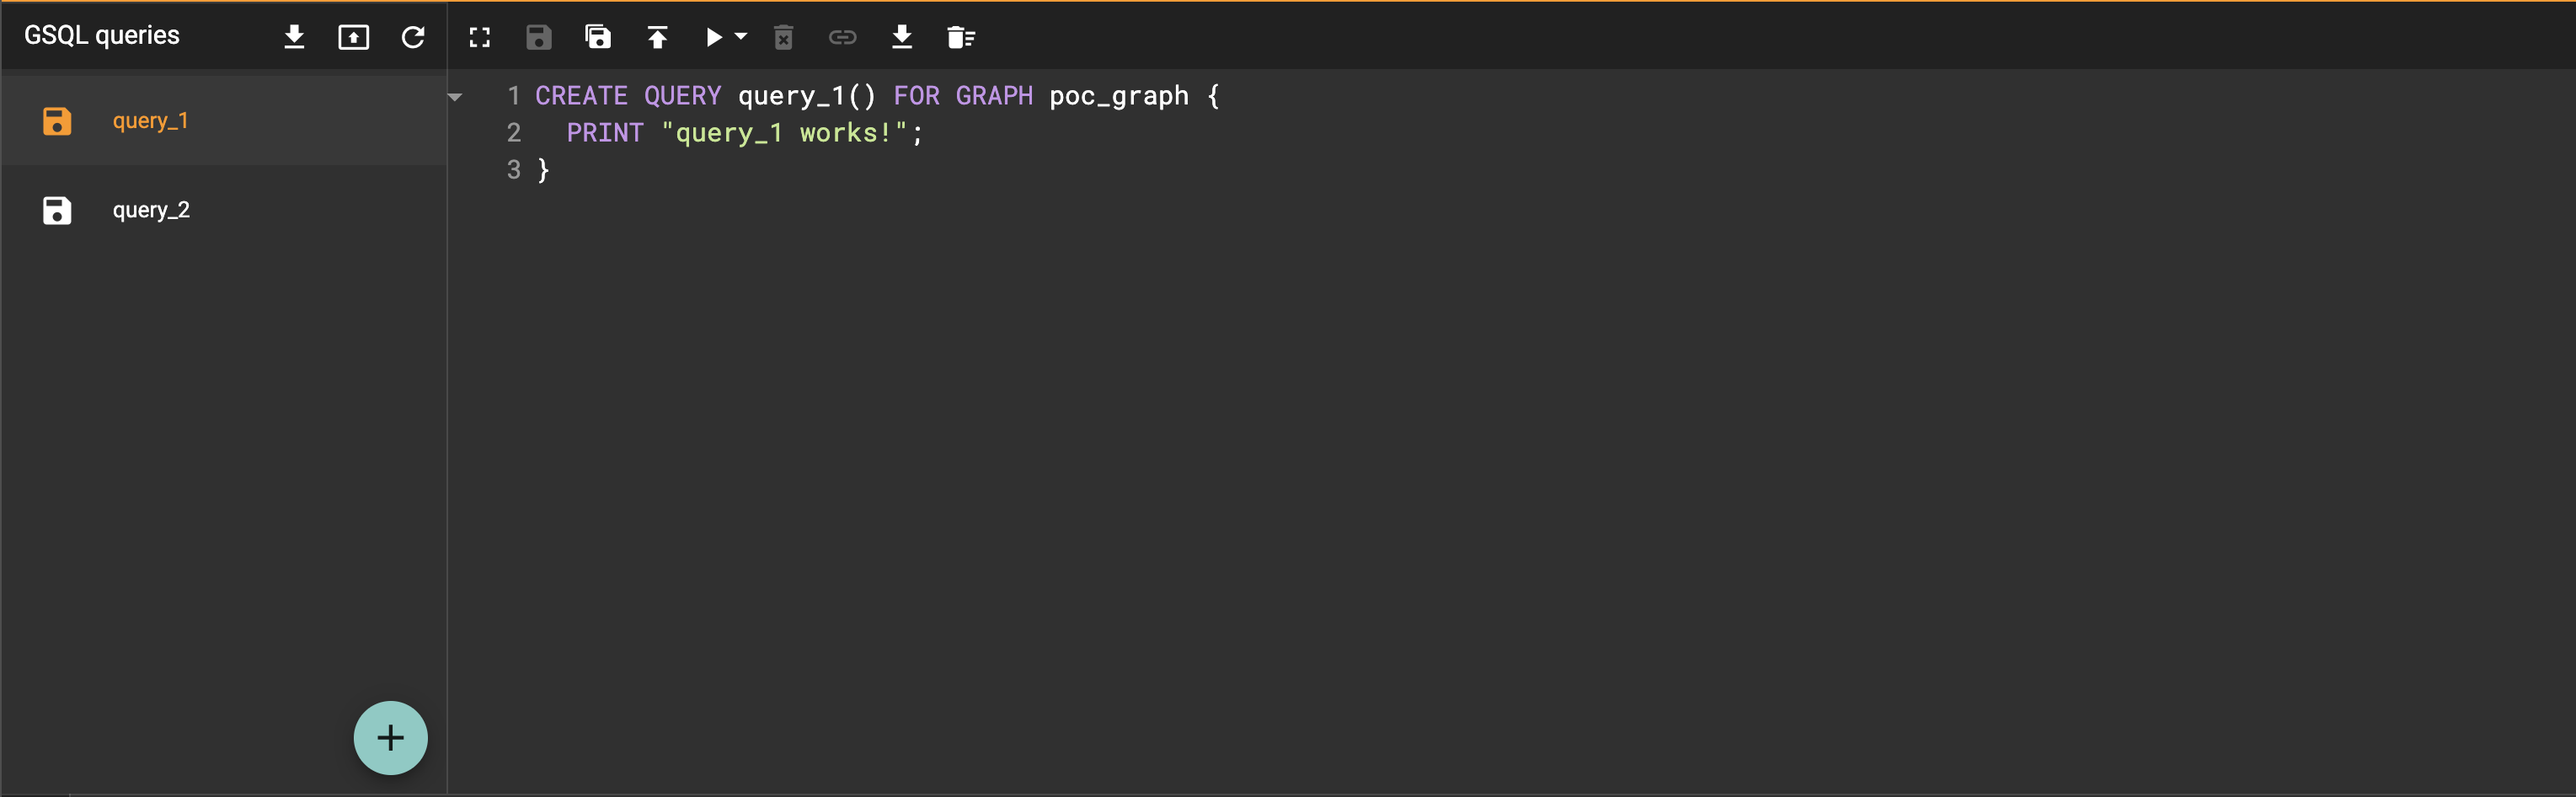
The Query Editing panel is divided into two sub-panels: the left sub-panel is used to select a query to edit, and the right, larger sub-panel displays the selected query for editing. Here you can edit, save, delete query and/or its draft, install and run the query. The query editor features syntax highlighting customized for the GSQL language. Also, the query editor performs real-time semantic checking.
Above the query editing pane is a toolbar, with the following buttons, from left to right:

-
Expand/Collapse : Expand or collapse the Query Editing panel to or from full page mode. The icon changes depending on whether the panel is currently expanded or collapsed.
-
Save : Save the current query draft.
-
Save as : Save the current query as a new query under a new name.
-
Install : Install the query into the database.
-
Run : Run the query. If the query is not installed, it will run the query in interpreted mode. Note there is performance penalty to run queries in interpreted mode.
-
Run Configuration: Set the query runtime configurations.
-
-
Delete : Delete the selected query and its draft.
-
Show query endpoint: Show the RESTFul endpoint to execute the query. Only installed queries can see their RESTFul endpoints.
-
Download: Download the query as a gsql file.
-
Discard query draft : Delete the selected query draft.
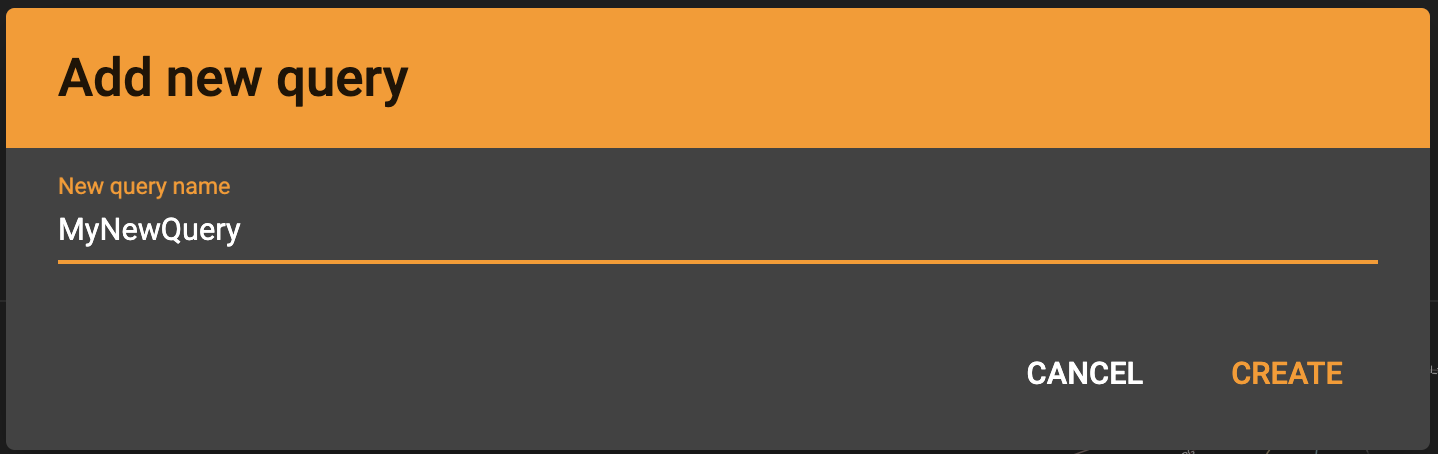
Add Or Edit Query
To create a new query, simply click on the "New GSQL Query" button  in the bottom-right corner of the left sub-panel, and type in the name of the new query in the popup window:
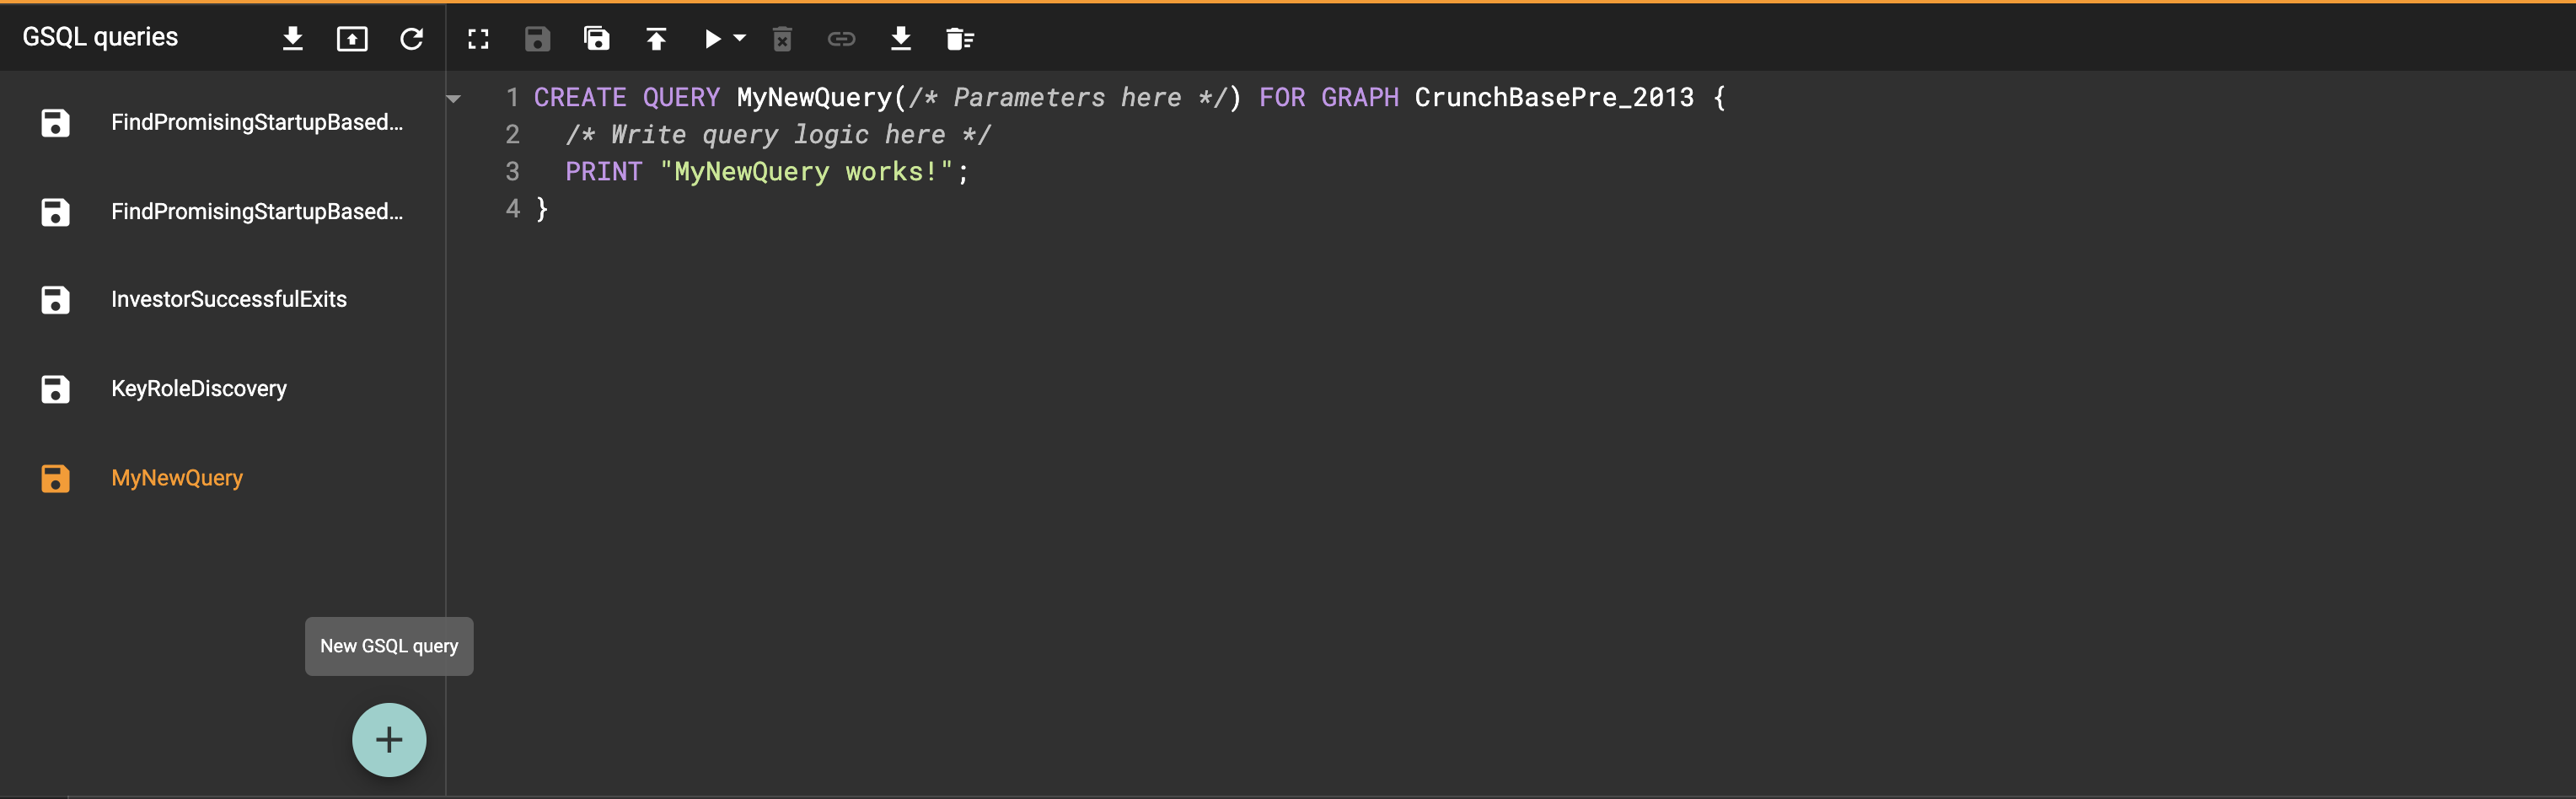
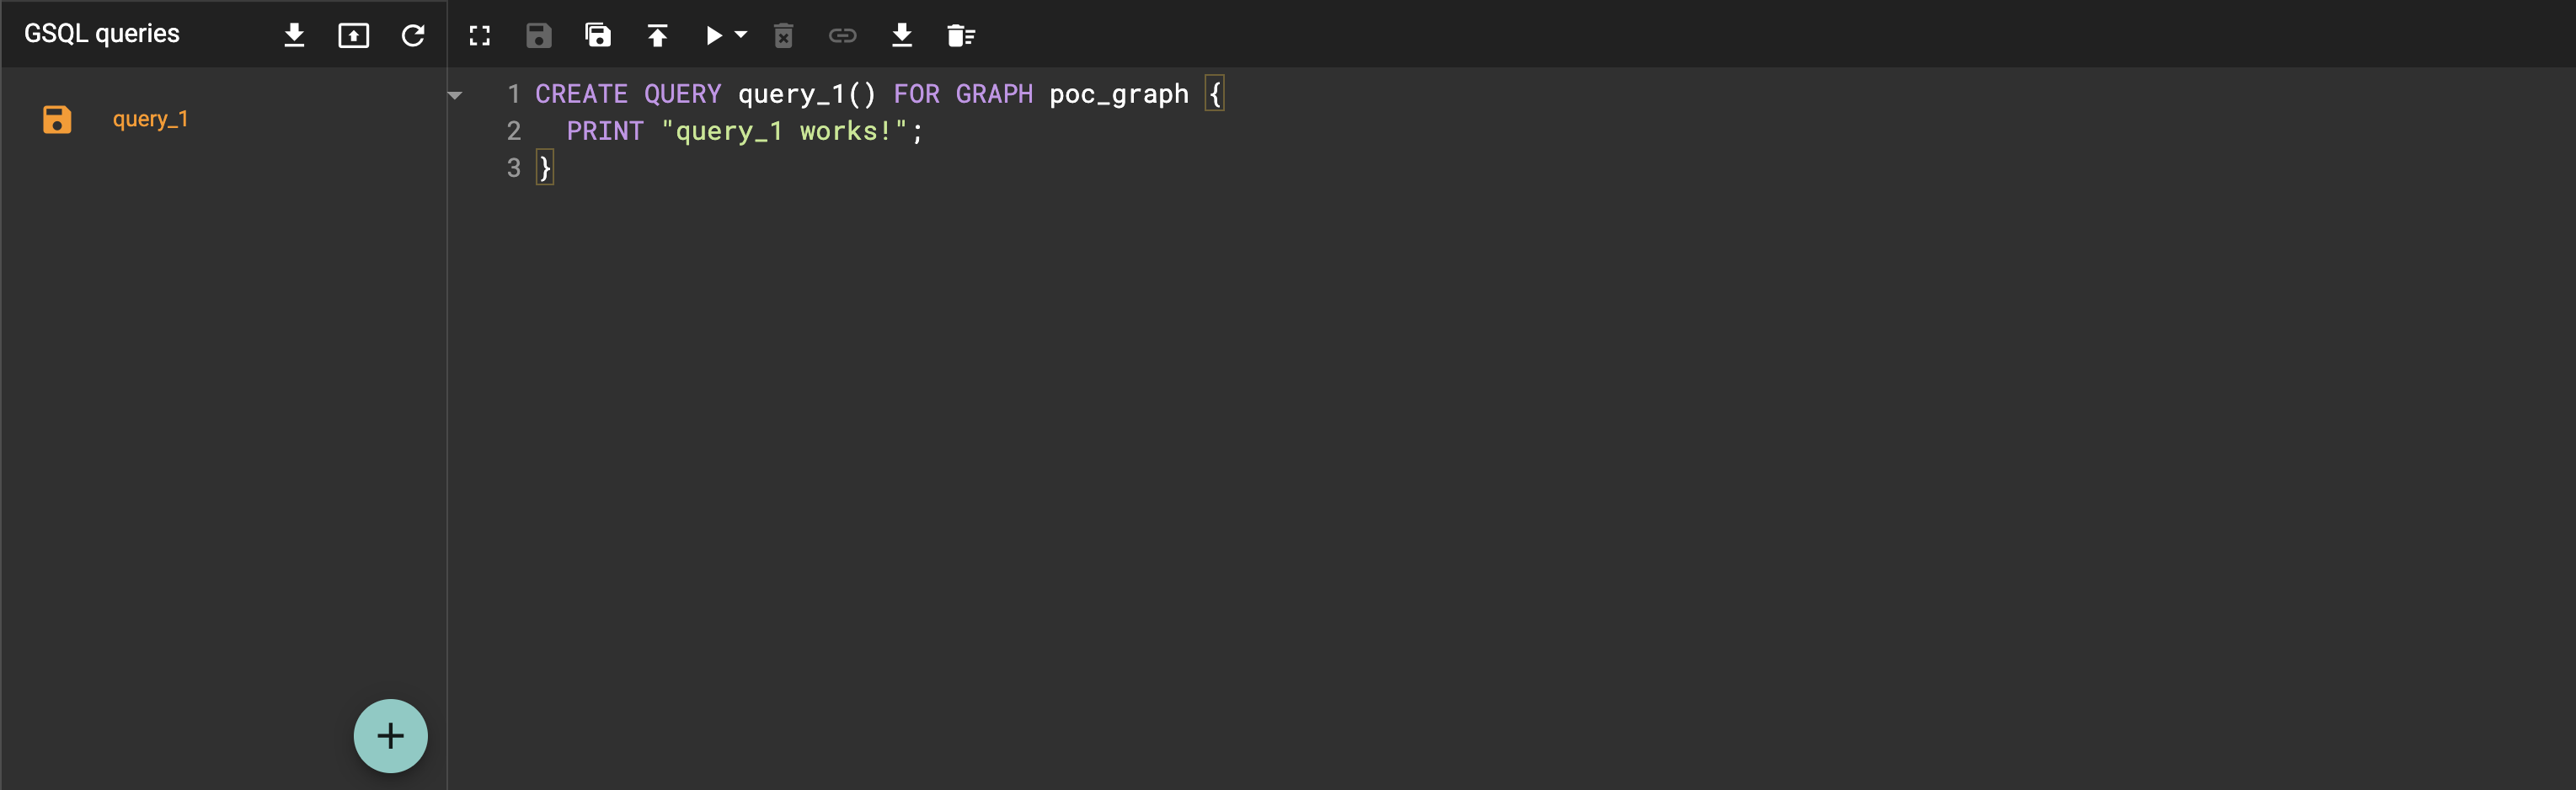
A query draft will be created with a template:
To edit an existing query, click on the query name in the list in the left sub panel:
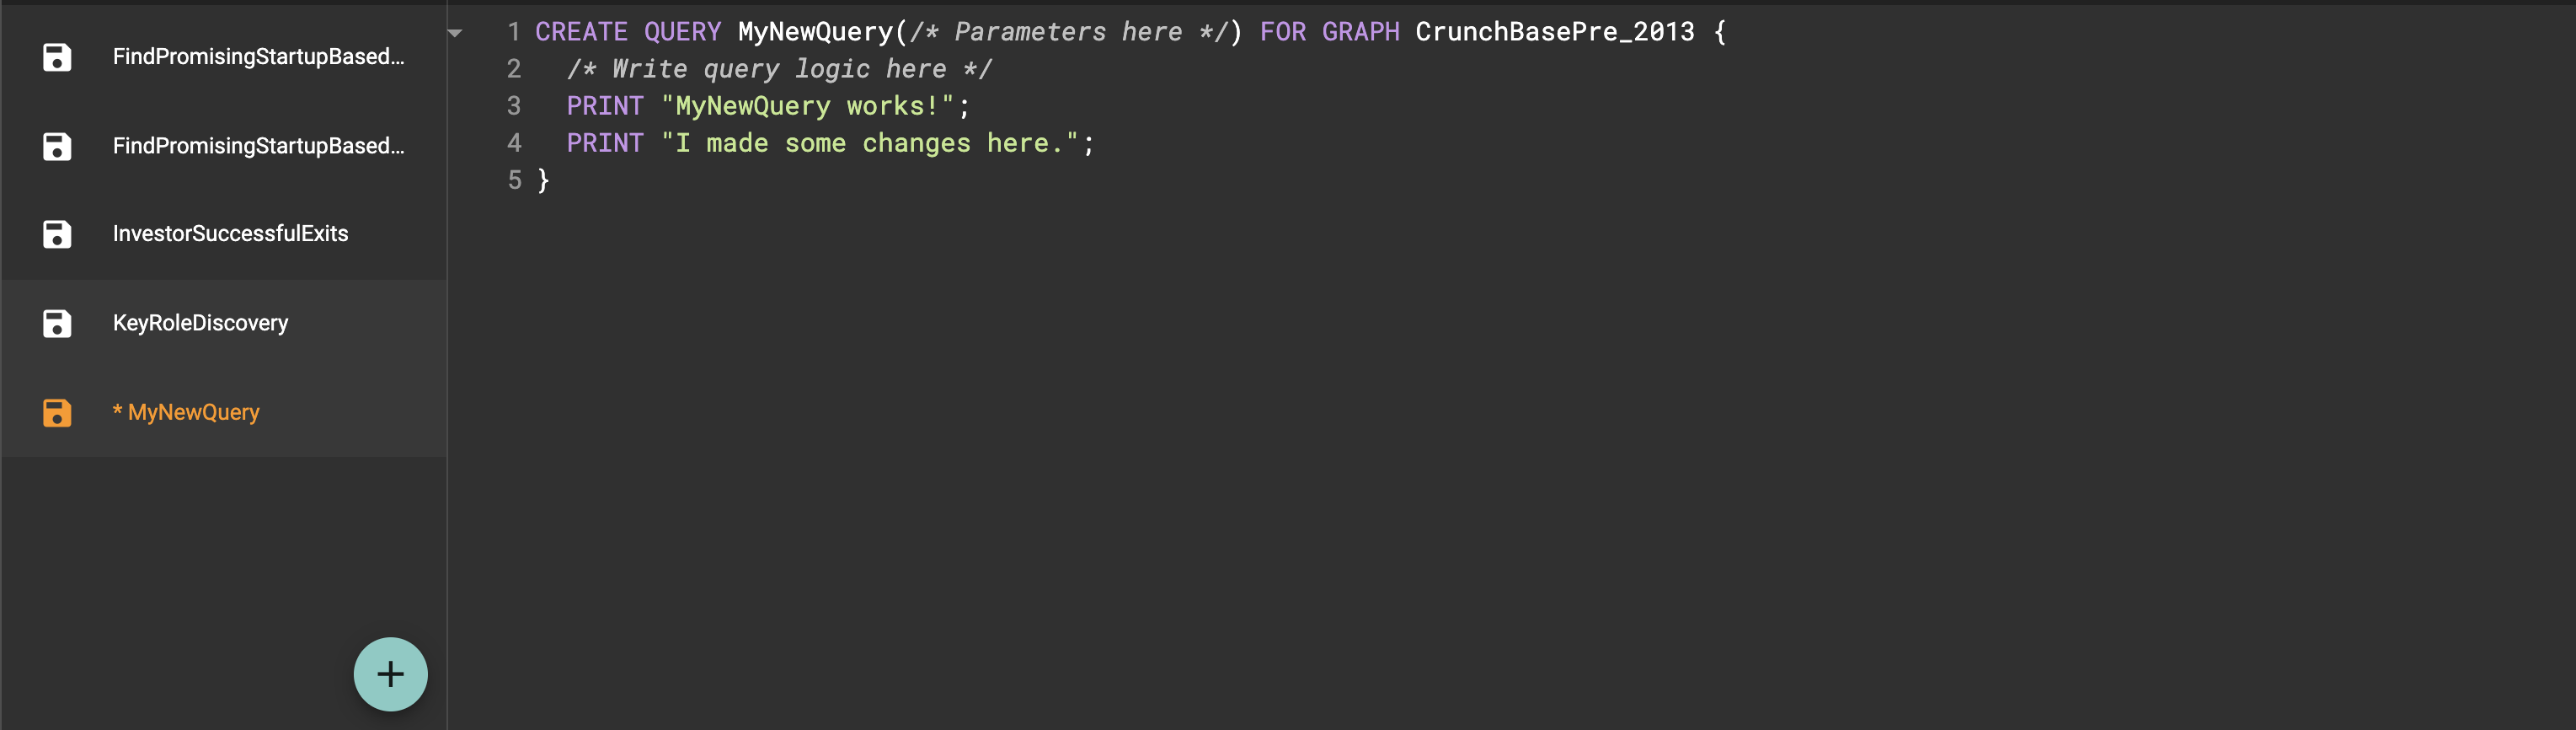
Save Query Draft
Once you made some changes to the query code and want to save it as a query draft, click on the "save" button in the toolbar.
Save as
Click the 'Save as' button to save the current query as a new query under a different name. After saving a query as another query, you will be redirected to the new query, and the original current will return to its last saved state.
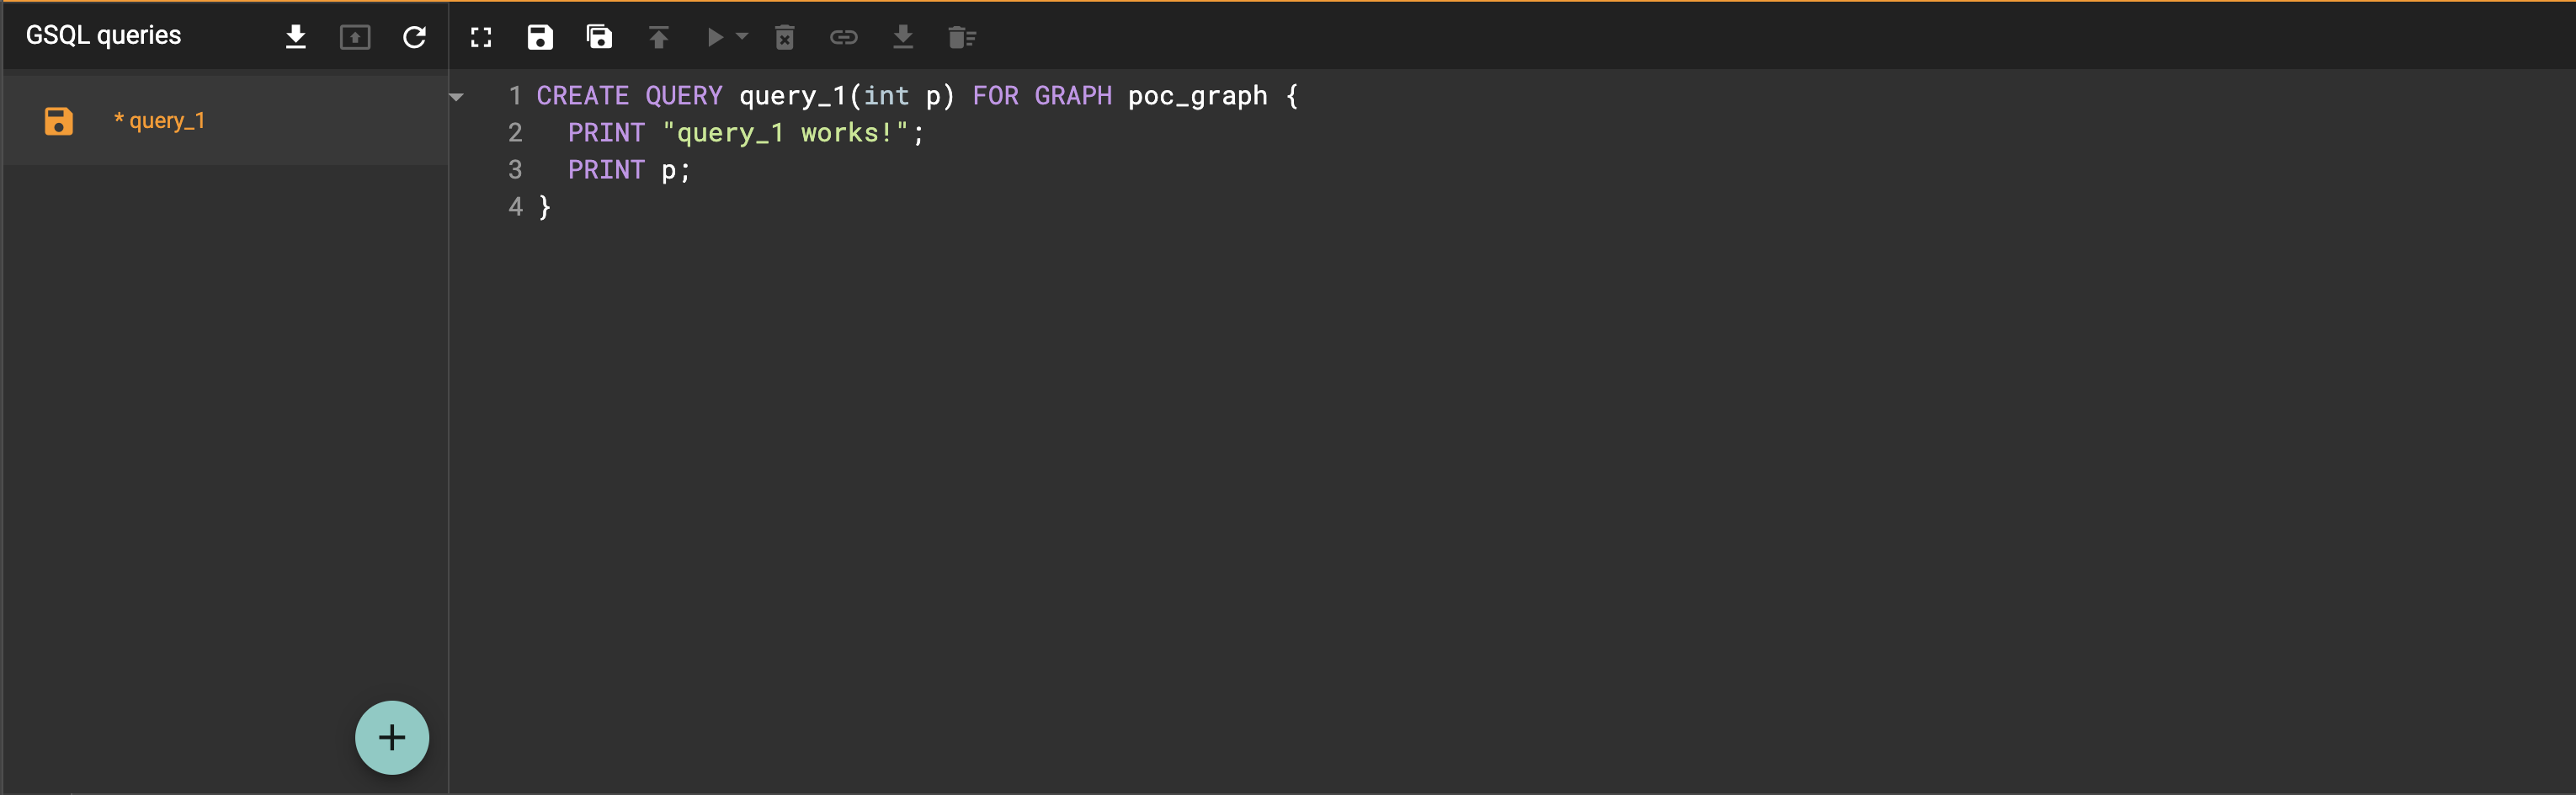
For example, suppose you have the following query:
You’ve made some changes and then decide to save this query as a new query:
You will be prompted to enter a new name for the query:
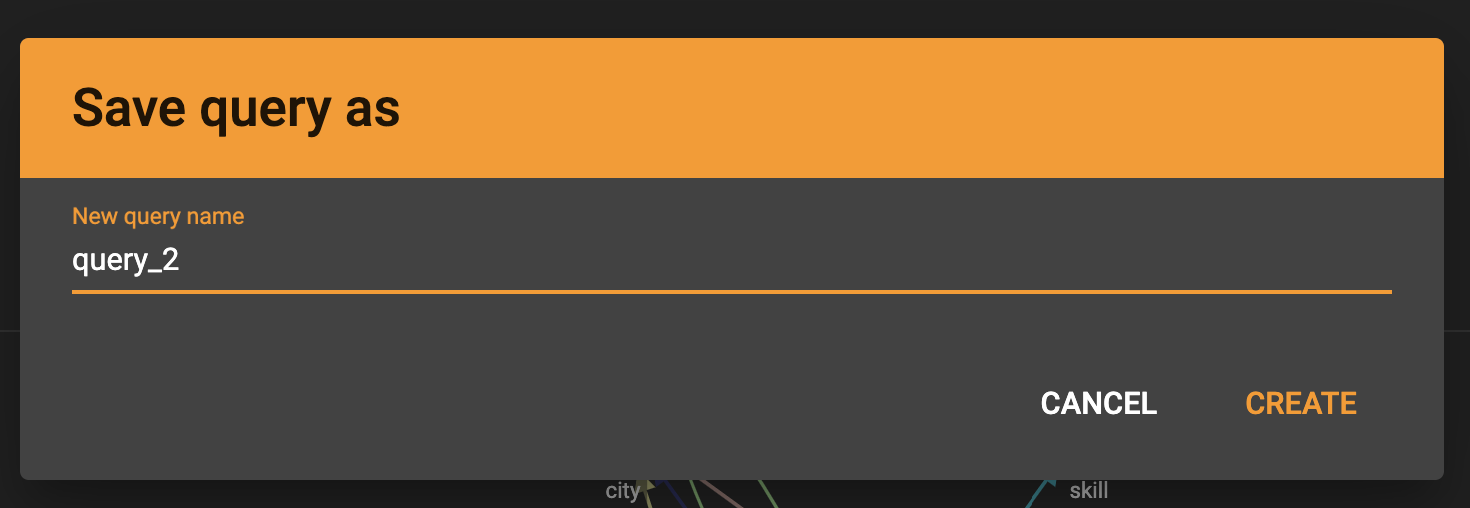
After saving, you are redirected to the new query:
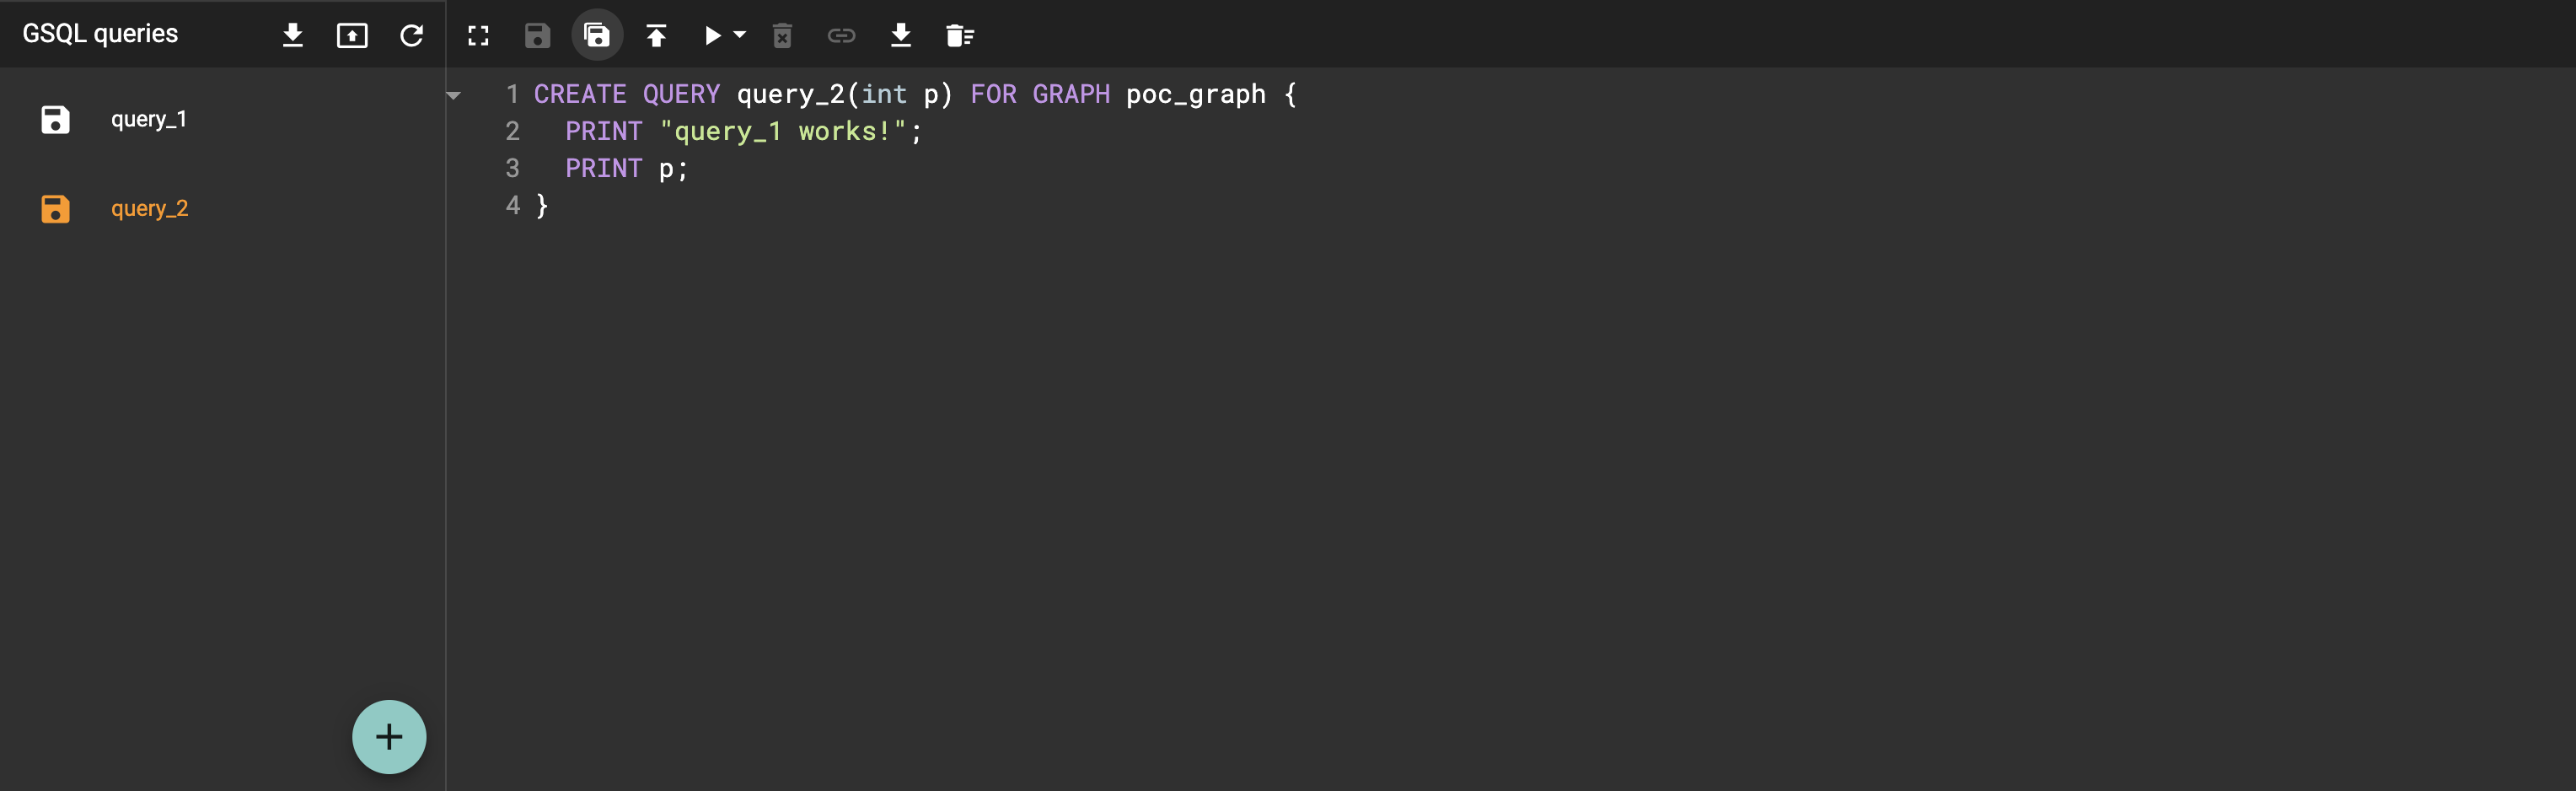
The previous query returns to its last saved state:
Run Query in Interpreted Mode
If you have saved the query and there is no errors in the query, you can run the query in interpreted mode. Click the run query button . Together with the query execution result, a warning message will appear to notify user of the performance concerns running the query in interpreted mode. To speed up the query performance after you are satisfied with the GSQL query developed in interpreted mode, you can follow the instructions in the next section "Install Query".

Run Query
To run the query, click on the "run"
button  in the
toolbar. If the query has no parameters, it will run directly and the
result will be shown in the Result panel.
in the
toolbar. If the query has no parameters, it will run directly and the
result will be shown in the Result panel.
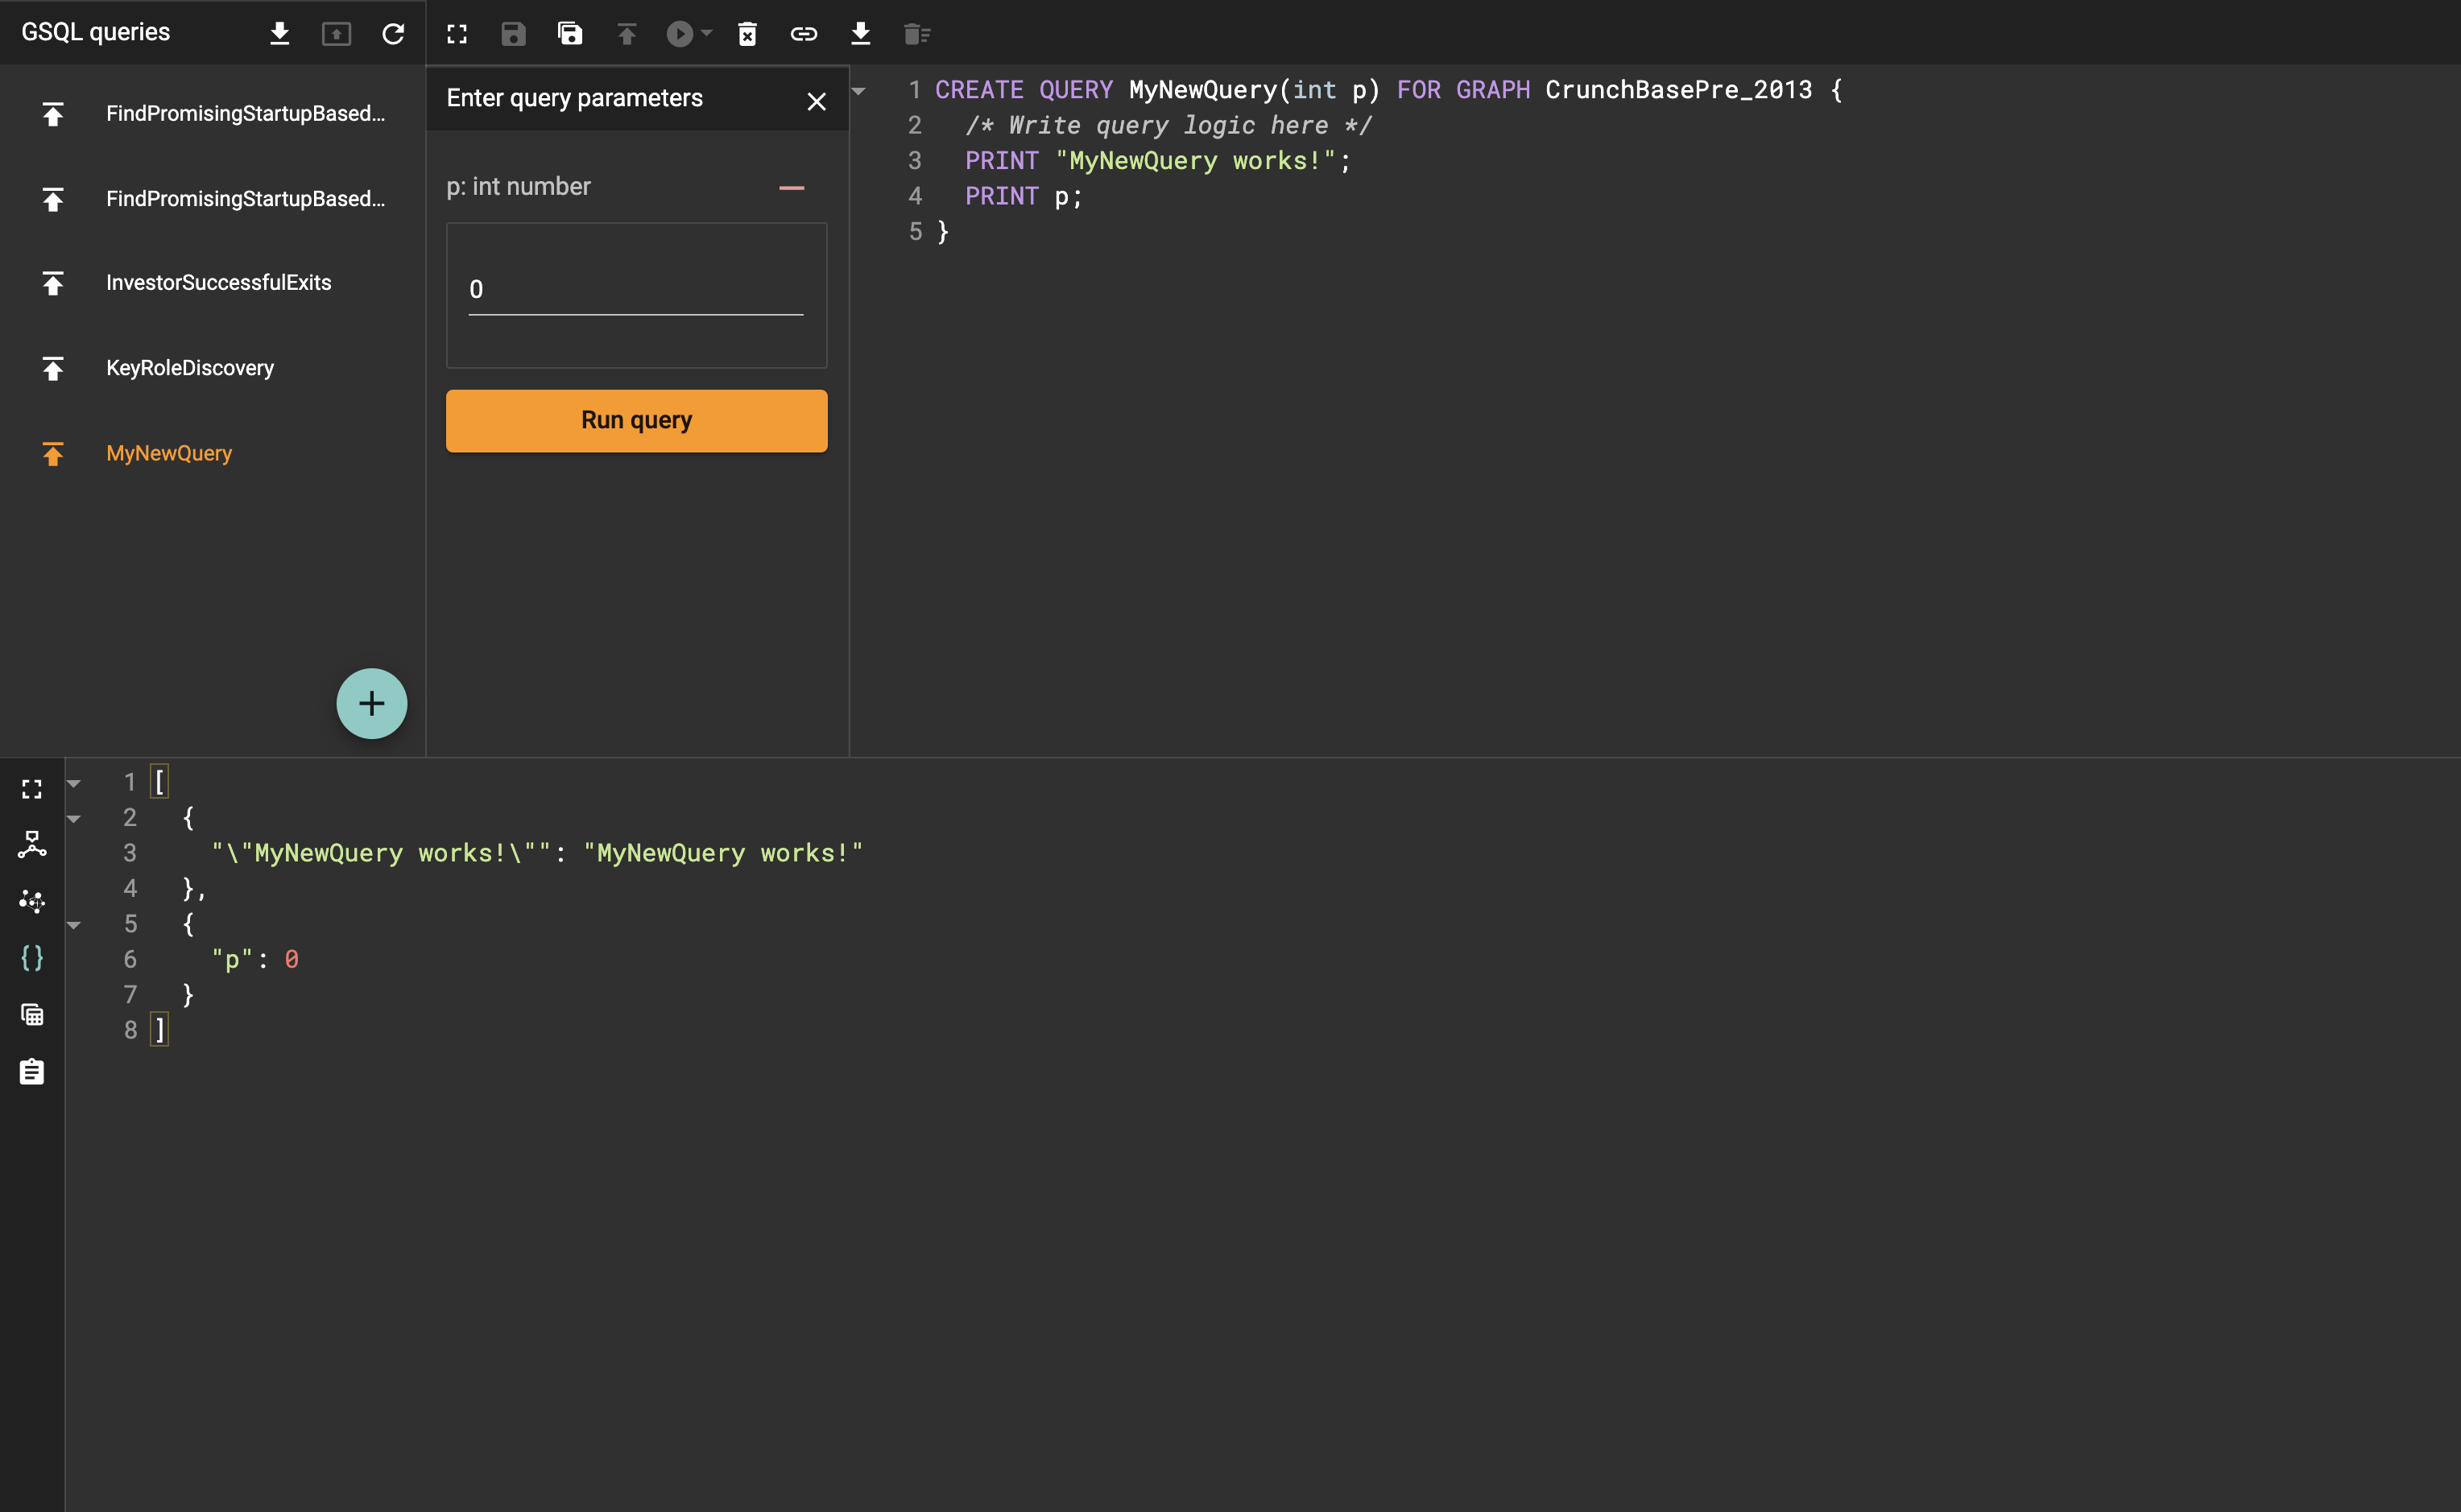
If the query requires parameters, the Enter Query Parameters panel will
appear. Enter your parameter values and then click the "Run Query"
button  at the bottom of
the panel. If there are several parameters, you might need to scroll the
panel to the bottom to find the Run Query button.
at the bottom of
the panel. If there are several parameters, you might need to scroll the
panel to the bottom to find the Run Query button.
The query will be executed, and the results will be shown in the Result Panel.
Run Configuration
You can set runtime configurations of the GSQL query by clicking the
small  button to the
right of run query button, then a drop-down menu will appear.
button to the
right of run query button, then a drop-down menu will appear.
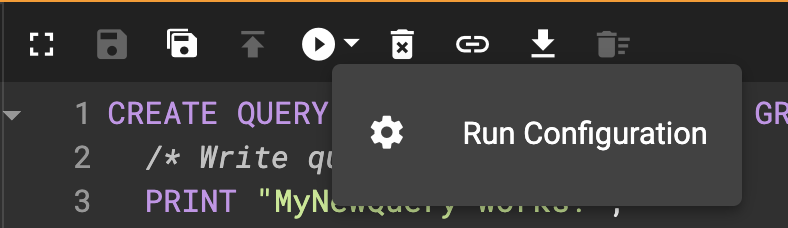
Click the "Run configuration" item, and the Run Configuration panel will be opened.
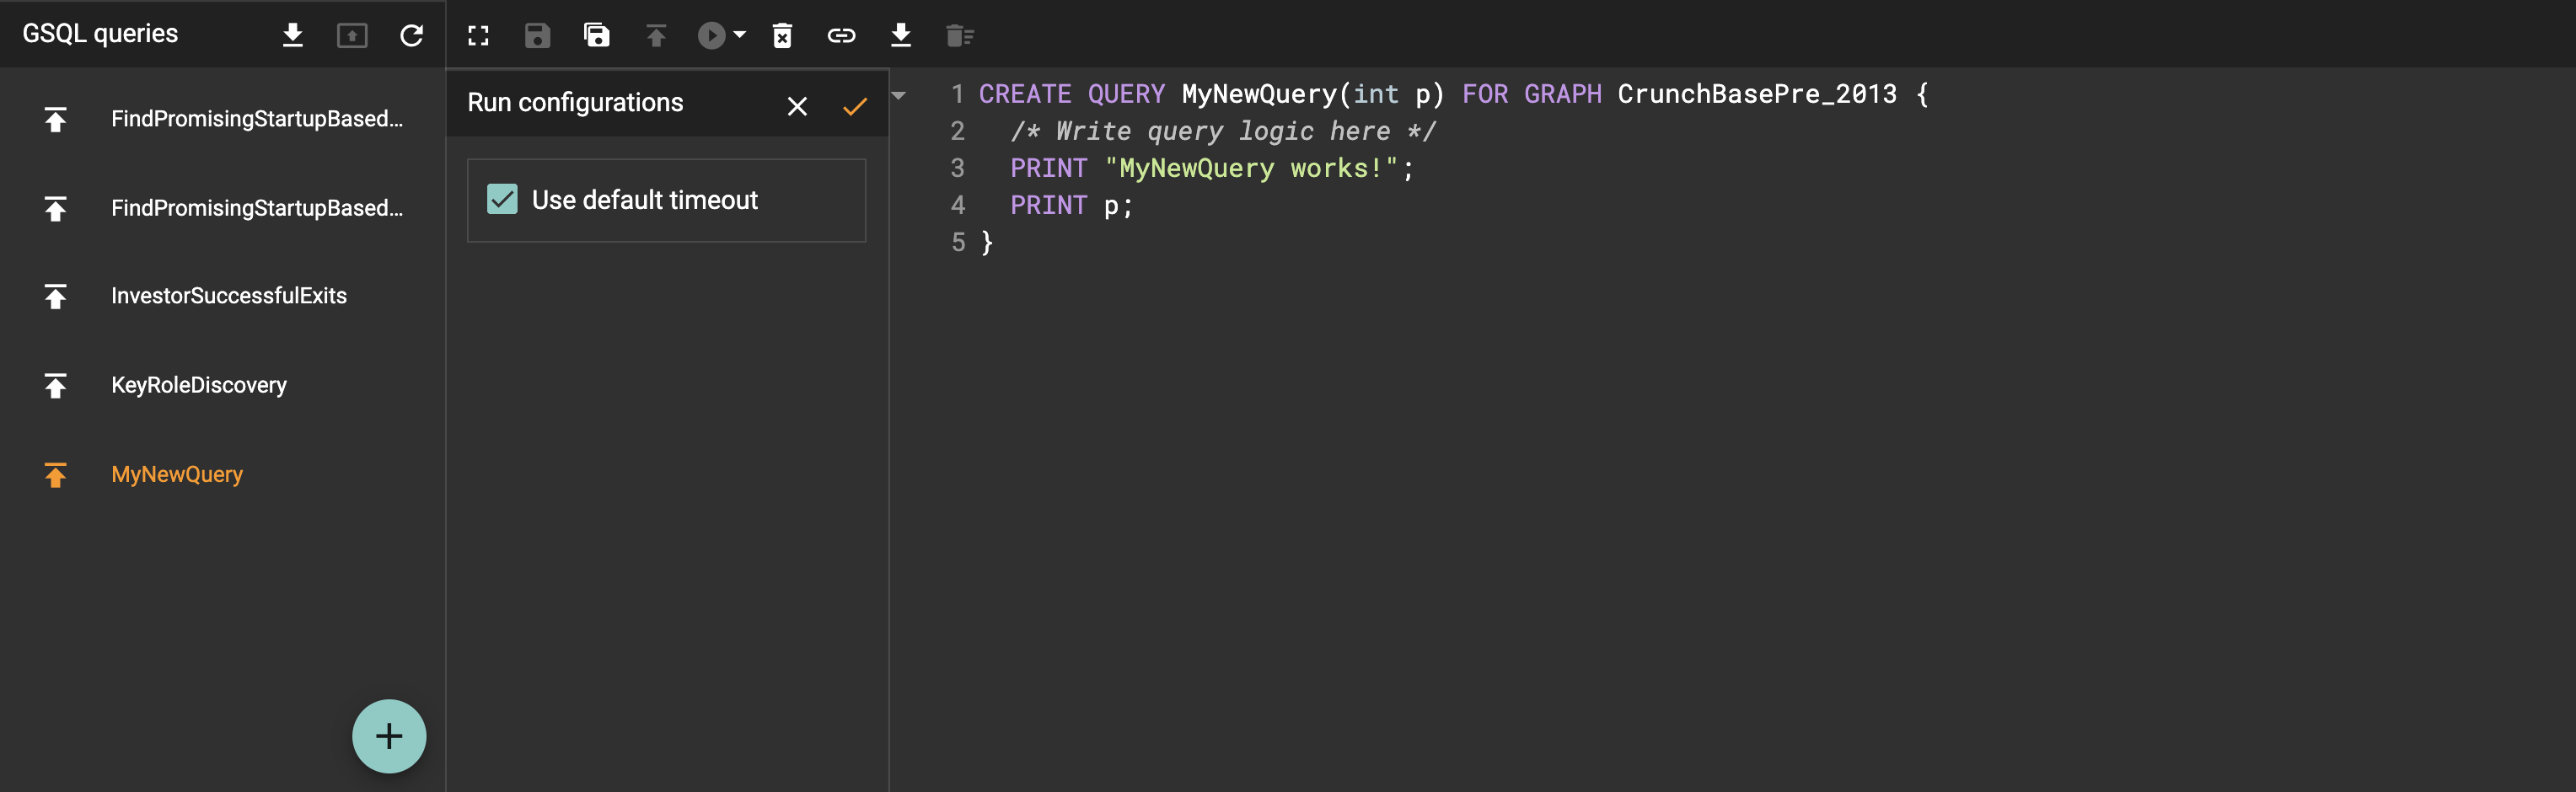
You can set GSQL query timeout here. By default, it uses the timeout of TigerGraph configuration (specified by gadmin commands). You can change it by unchecking the "Use default timeout" label, and then set a new timeout:
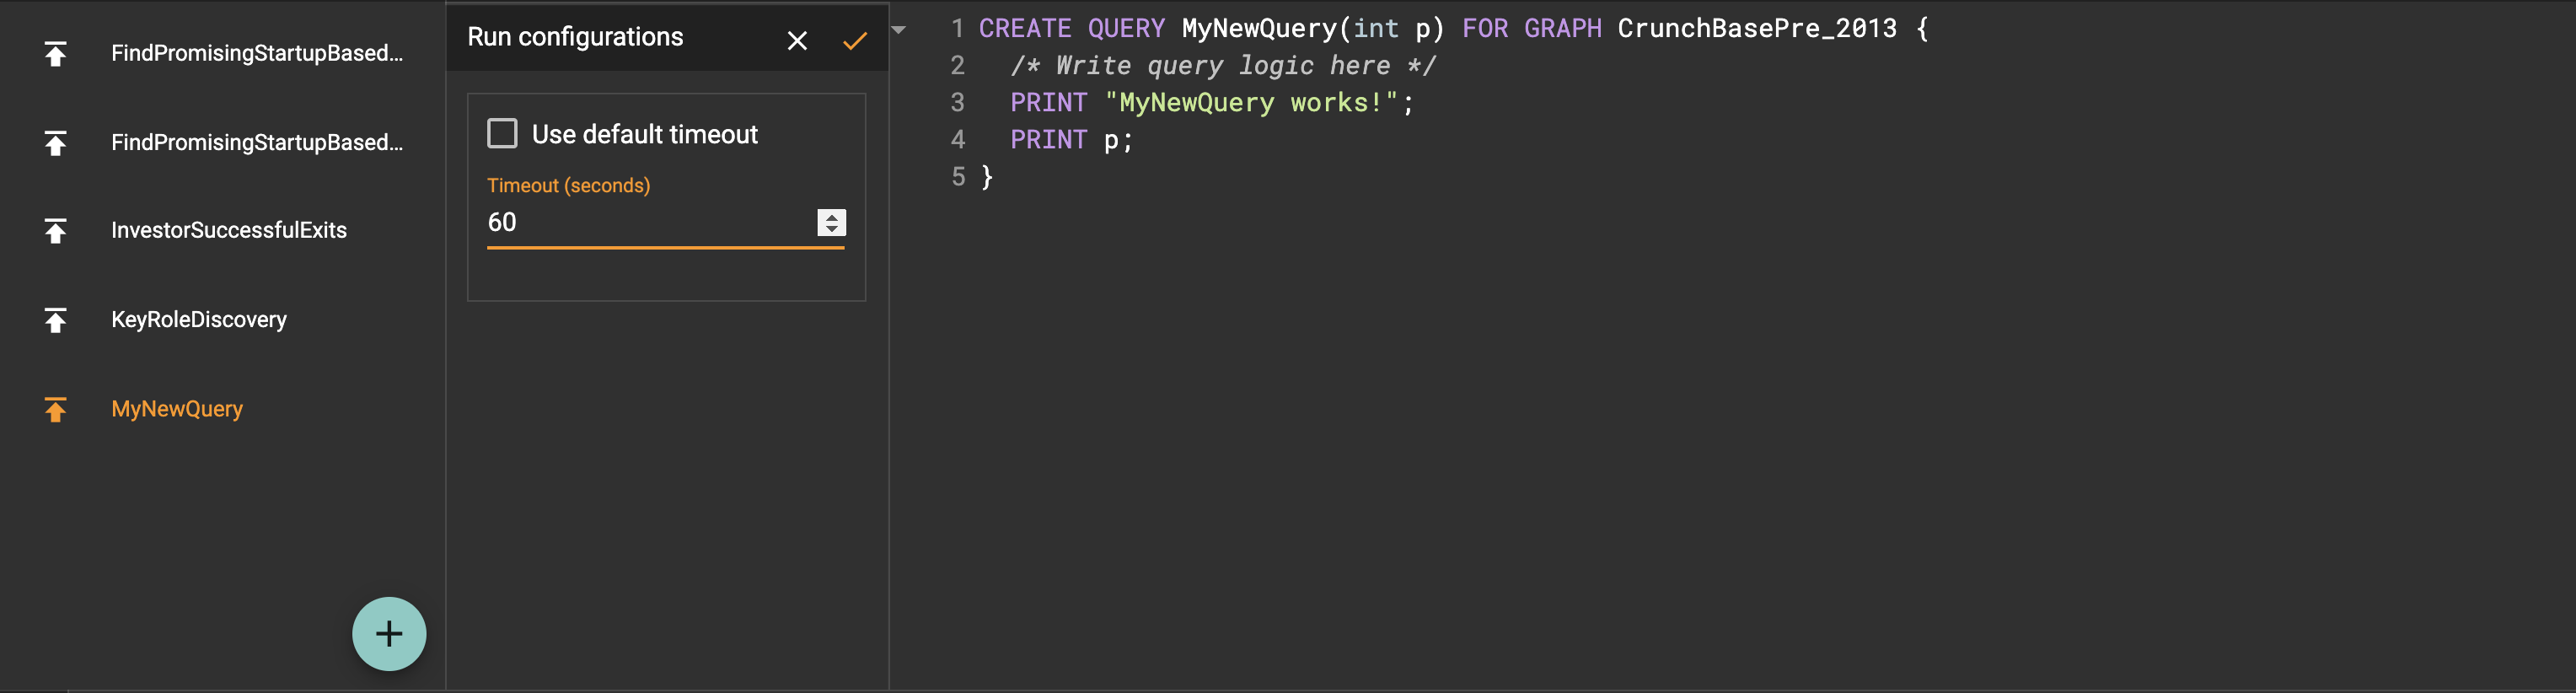
Click the submit button
 to apply your
changes.
to apply your
changes.
Delete Query
Choose the query you want to delete and click on the "delete"
button  . The query
will be deleted permanently.
. The query
will be deleted permanently.
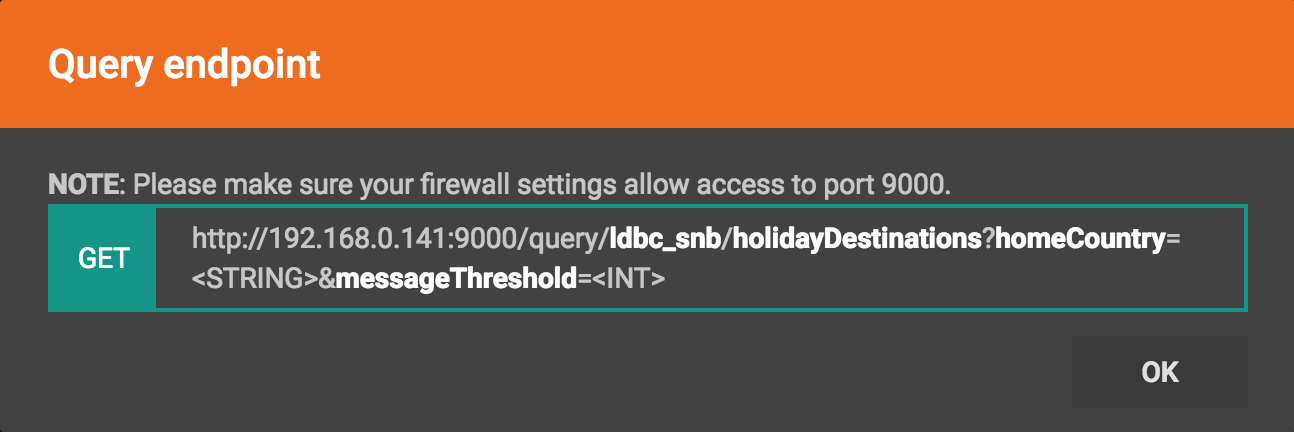
Show Query Endpoint
After finishing writing the GSQL queries and installing the queries, you
can access the queries via REST endpoints. By clicking the "show query
endpoint" button  , you can
see the format of the endpoint to access this query, so that you can
integrate the query with your applications.
, you can
see the format of the endpoint to access this query, so that you can
integrate the query with your applications.


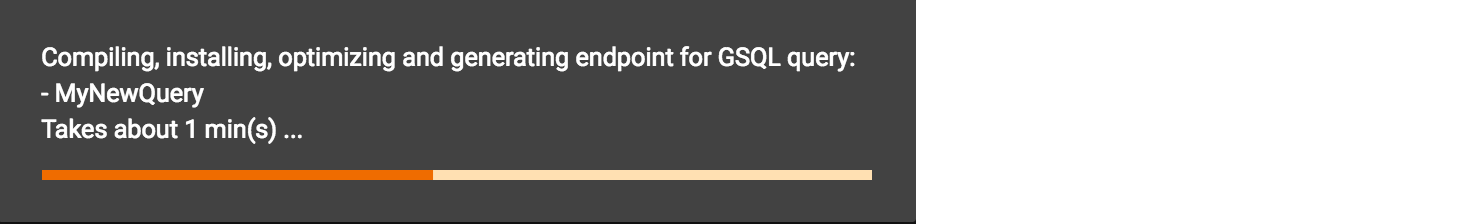
Install All Queries
If you want to install all queries that you haven’t installed yet, you
can click "Install all queries"
button  in GSQL
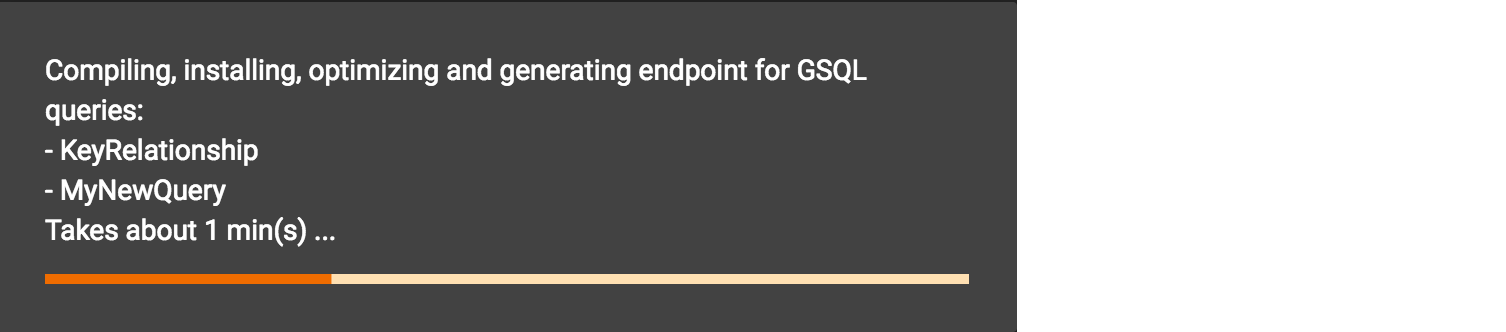
Queries list. After some verification time, a pop up window listing all queries to be installed will show:
in GSQL
Queries list. After some verification time, a pop up window listing all queries to be installed will show:

Click INSTALL button, then the listed queries will be installed:
Result Panel
The Result panel shows the result of the last run query. Each query generates up to three types of result: visualized graph, JSON text, or log messages. On the left is a toolbar with buttons for changing the the panel size or for switching to a different type of result. The buttons, from top to bottom, are the following:
| menu option | functionality |
|---|---|
|
Expand/Collapse: Expand or collapse the Result panel. |
|
View schema: Show the graph schema. |
|
Visualize graph result: Display query result in visualized graph. |
|
View JSON result: Display query result in JSON format. |
|
View table result : Display query result in a table. |
|
View logs: Show the log for the most recent query run. |


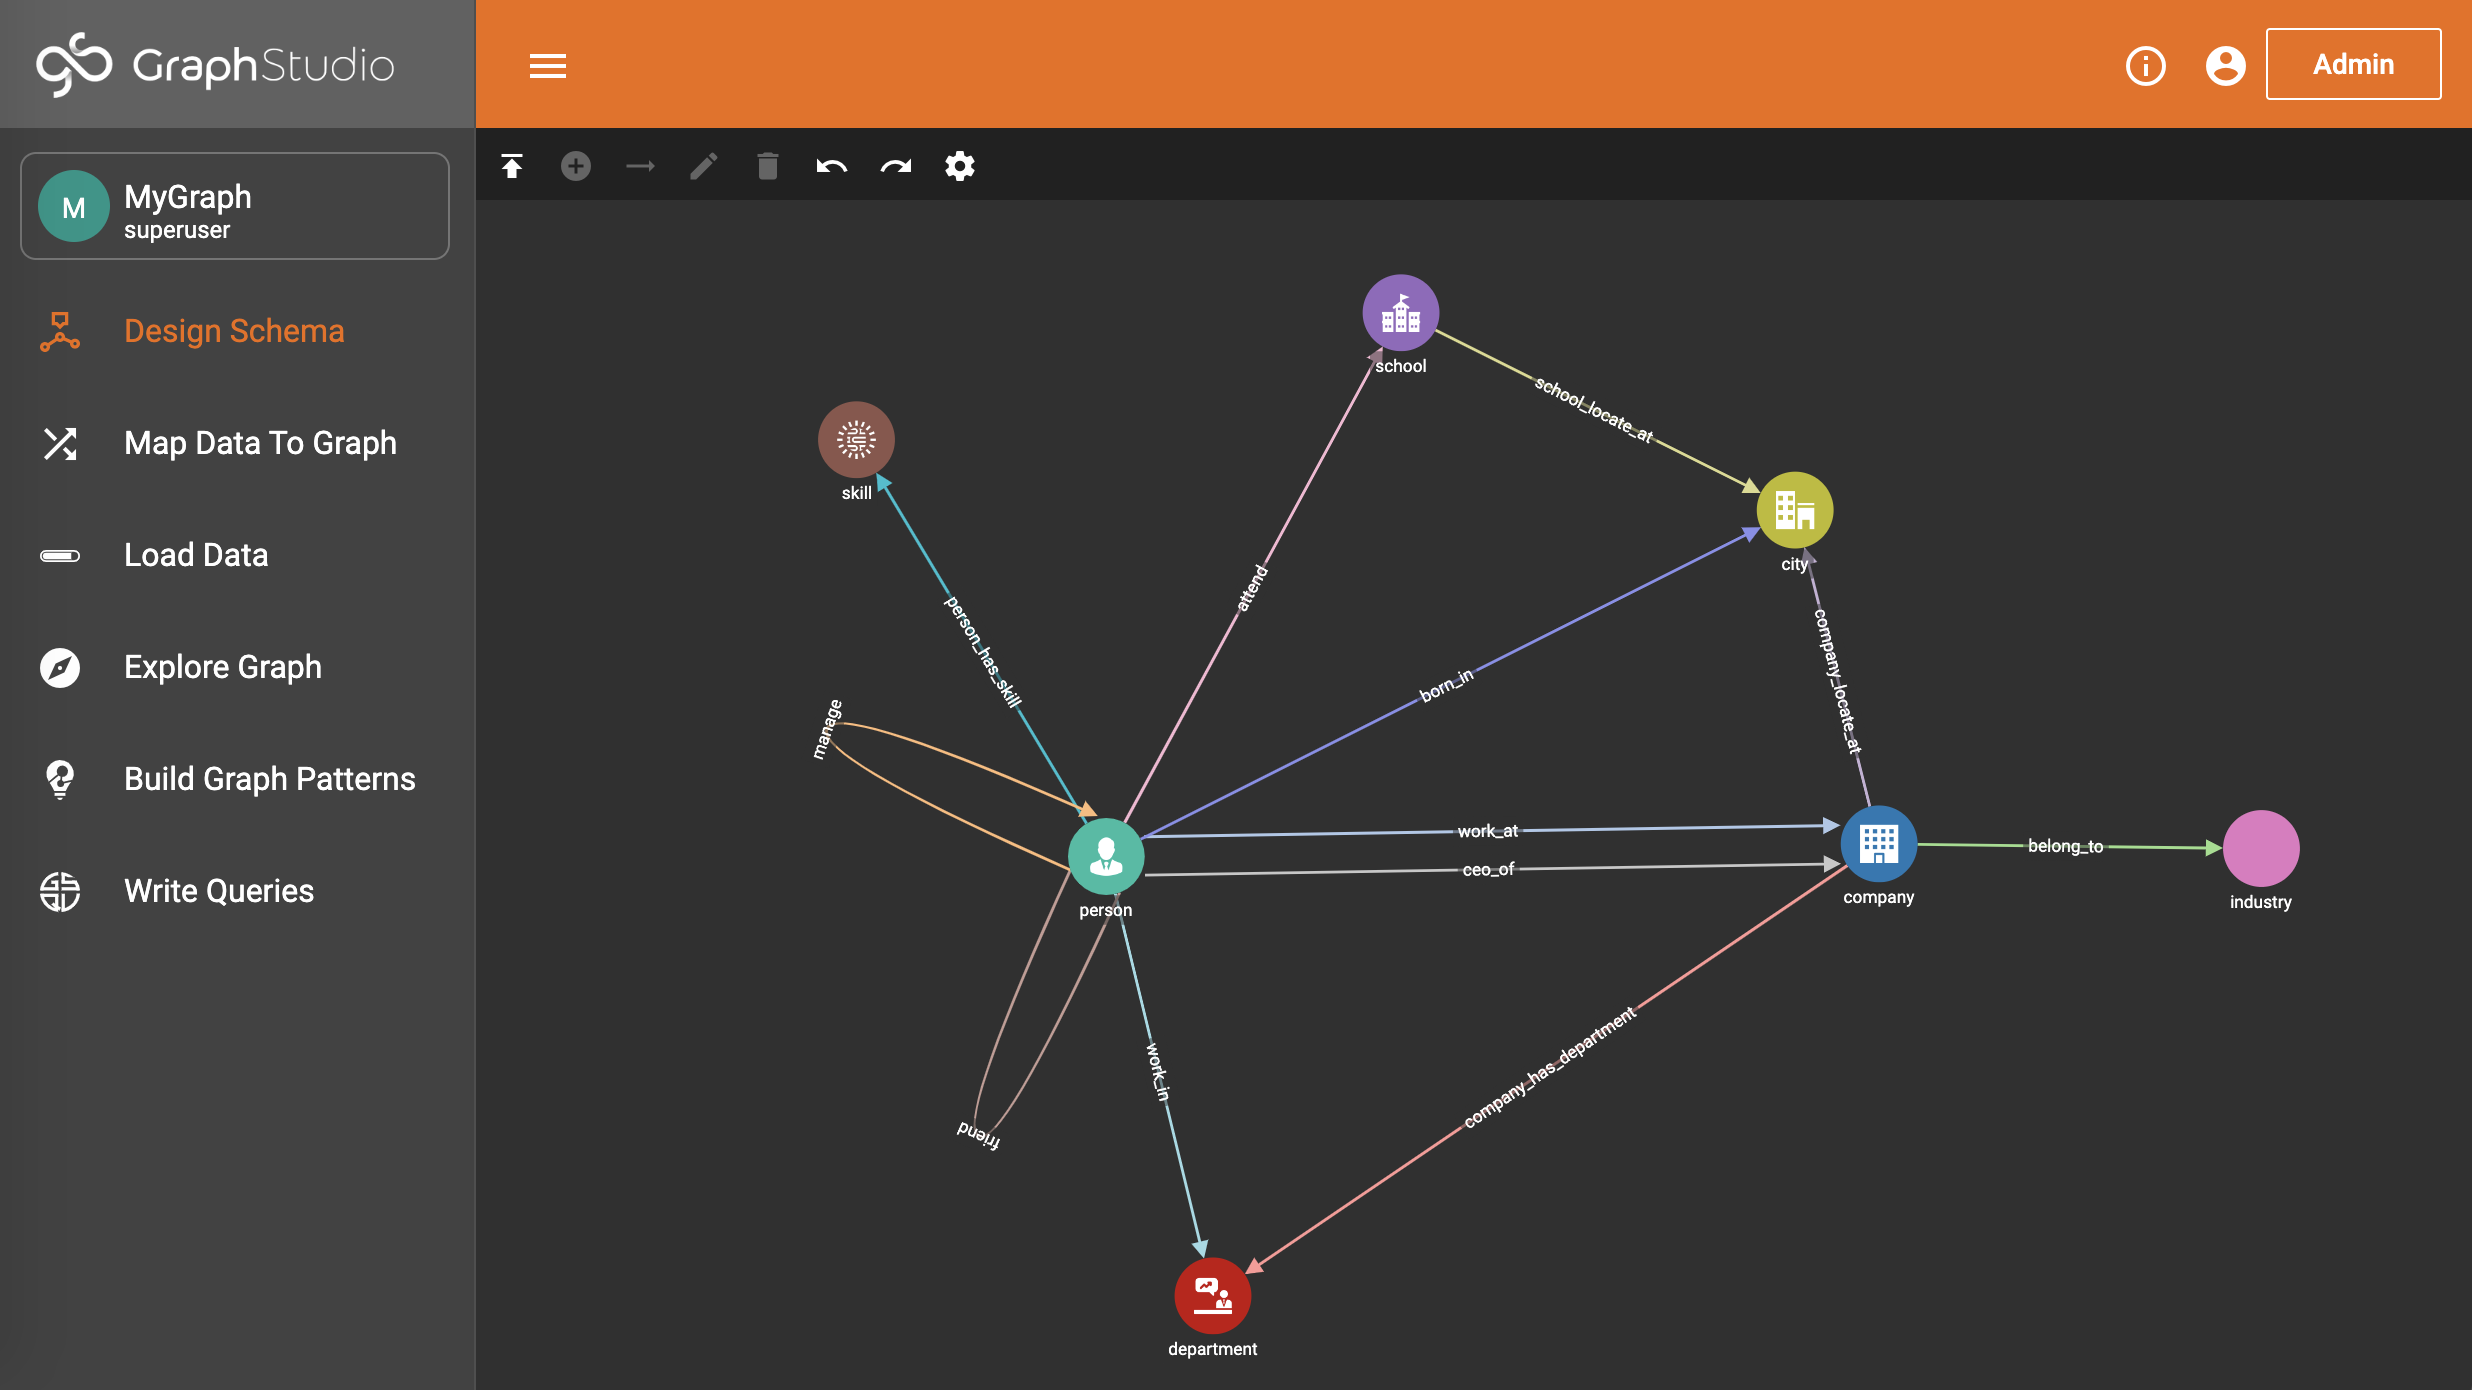
View schema
Viewing graph schema makes it more convenient for developers to refer to the schema topology logic and easier to write correct GSQL queries.
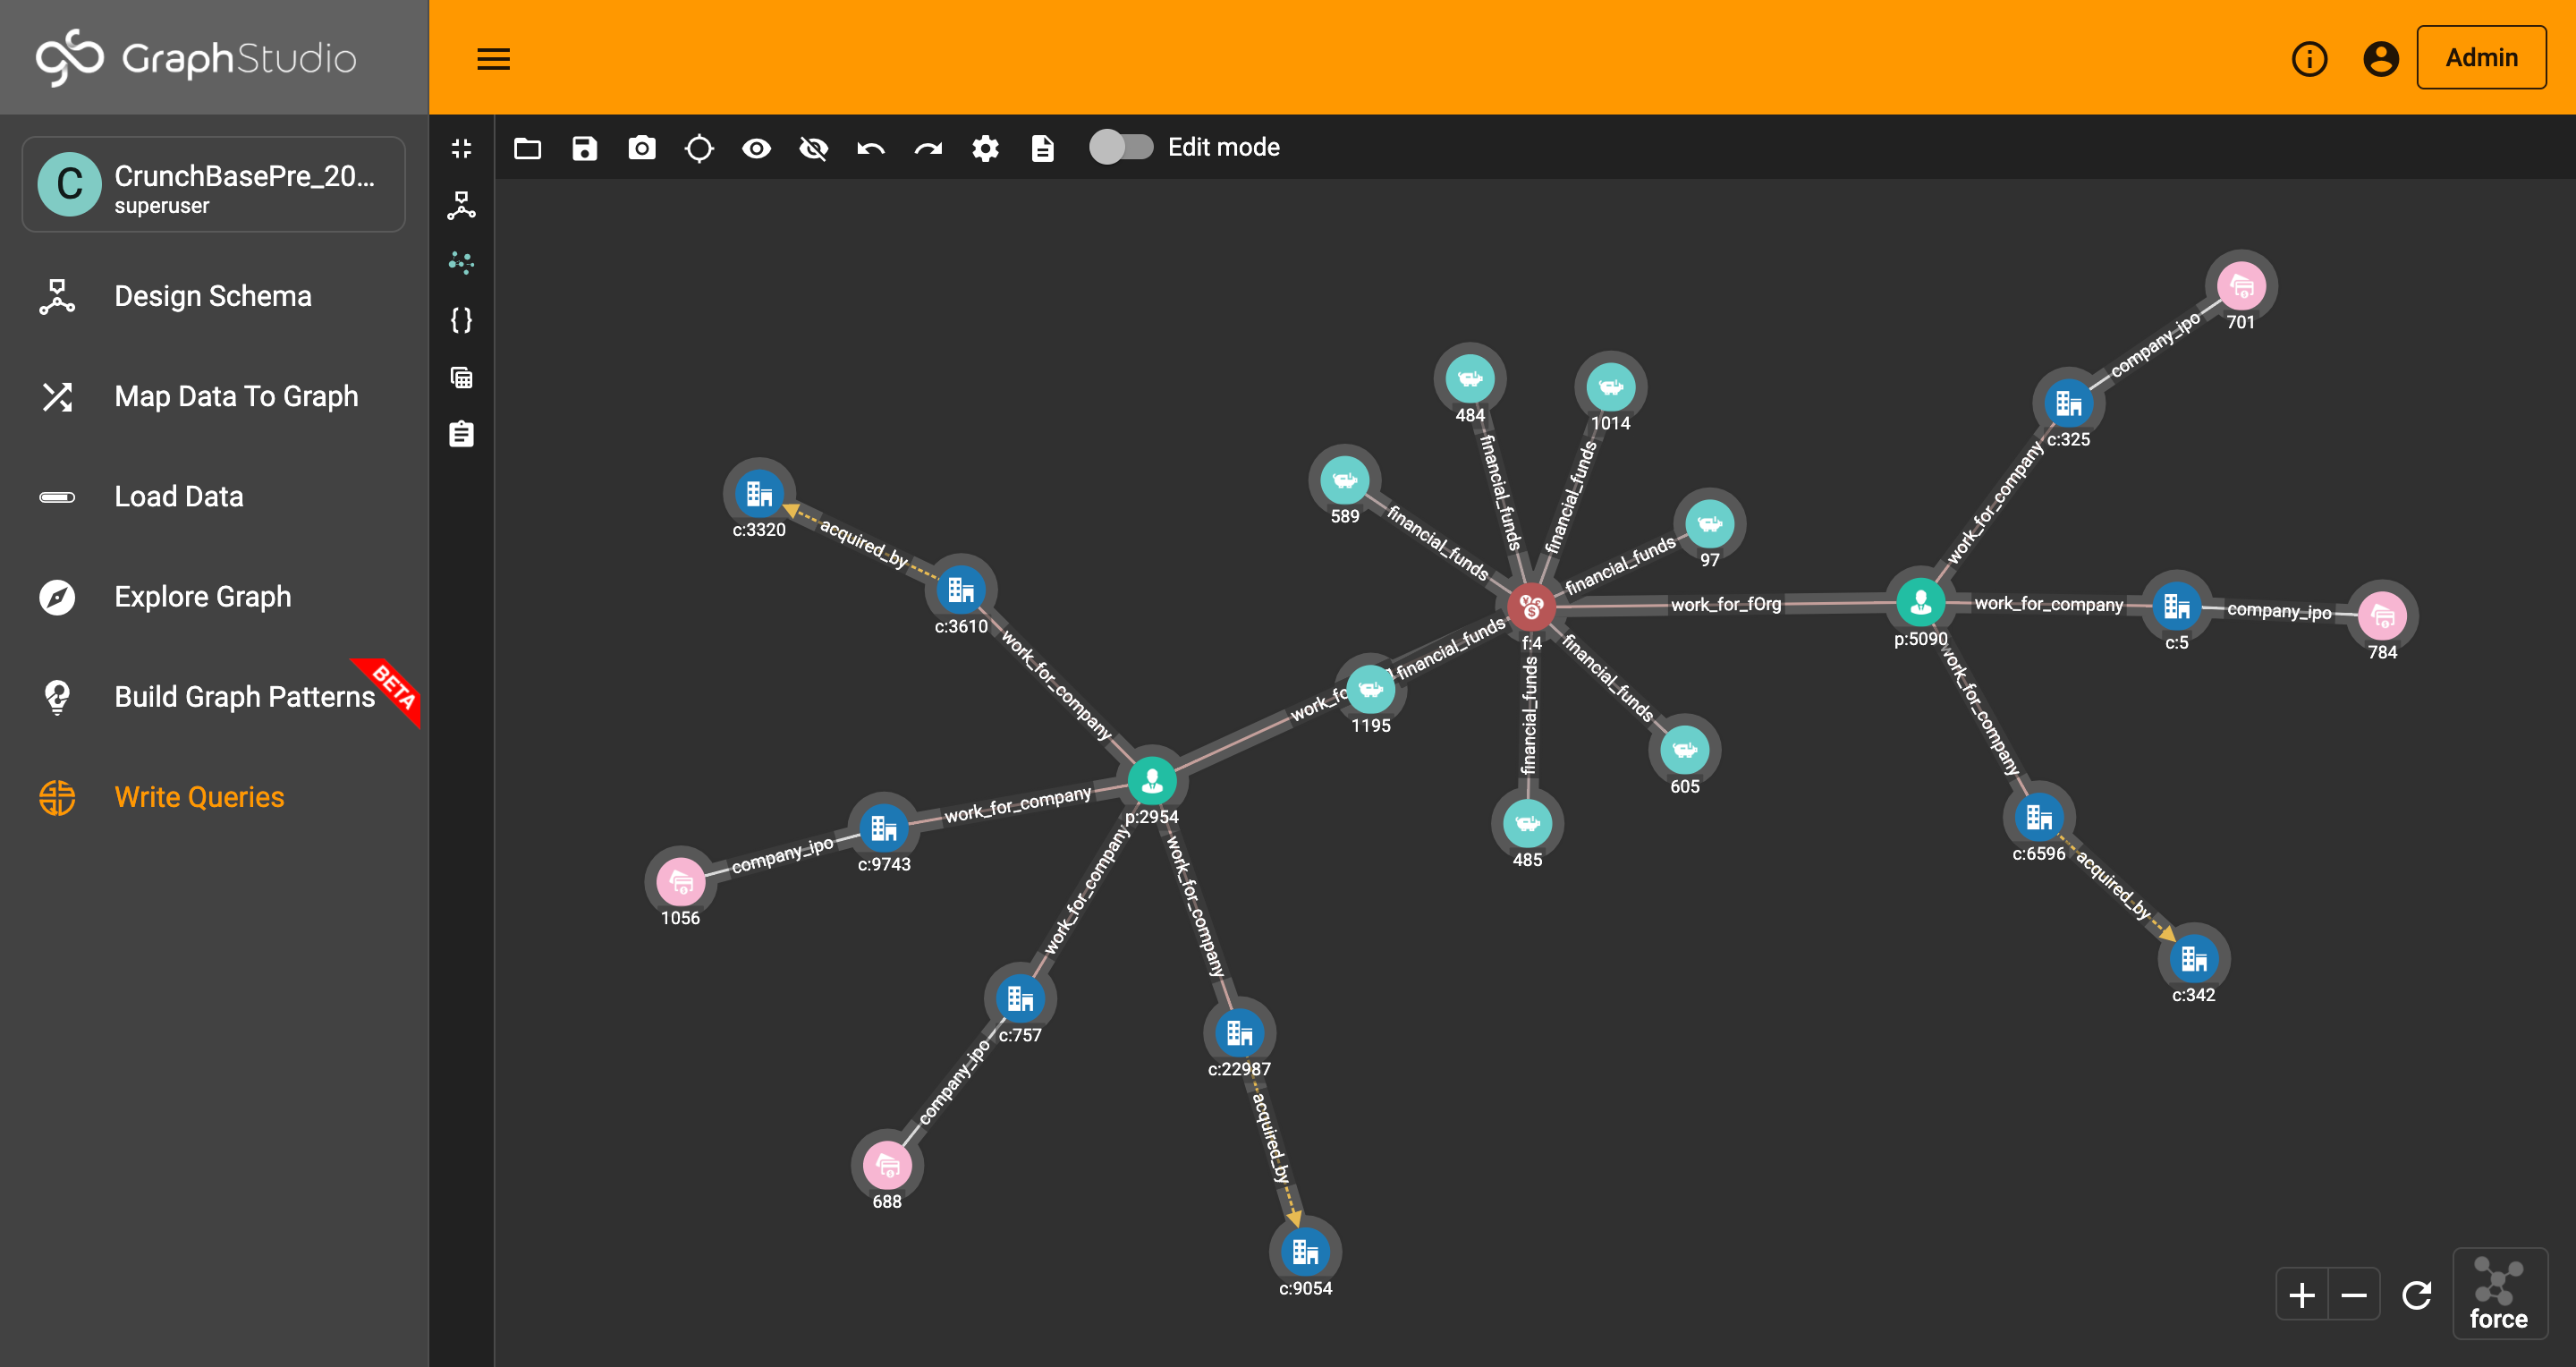
Visualize graph result
If the query execution result contains a graph structure, the result will be visualized in this panel as a graph. The panel is the same as the Explore Graph panel. The only difference is that each time you run a query, the previous result will be erased. In Explore Graph the results are added incrementally.
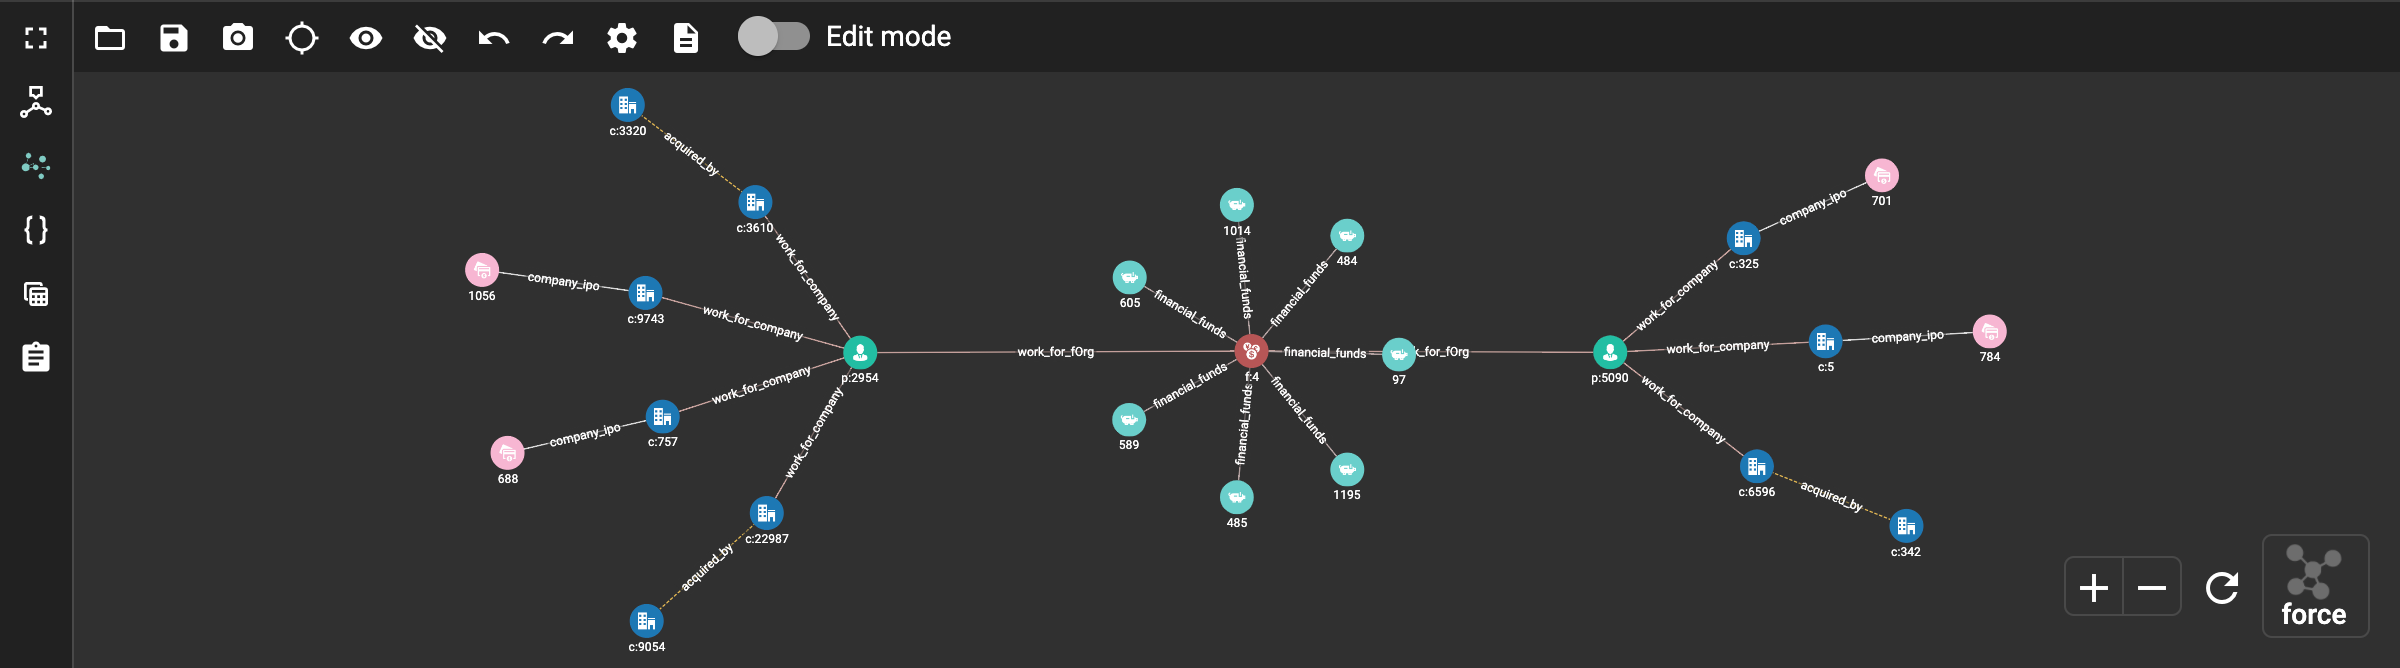
You can switch to the JSON Result panel to see the result in JSON format.
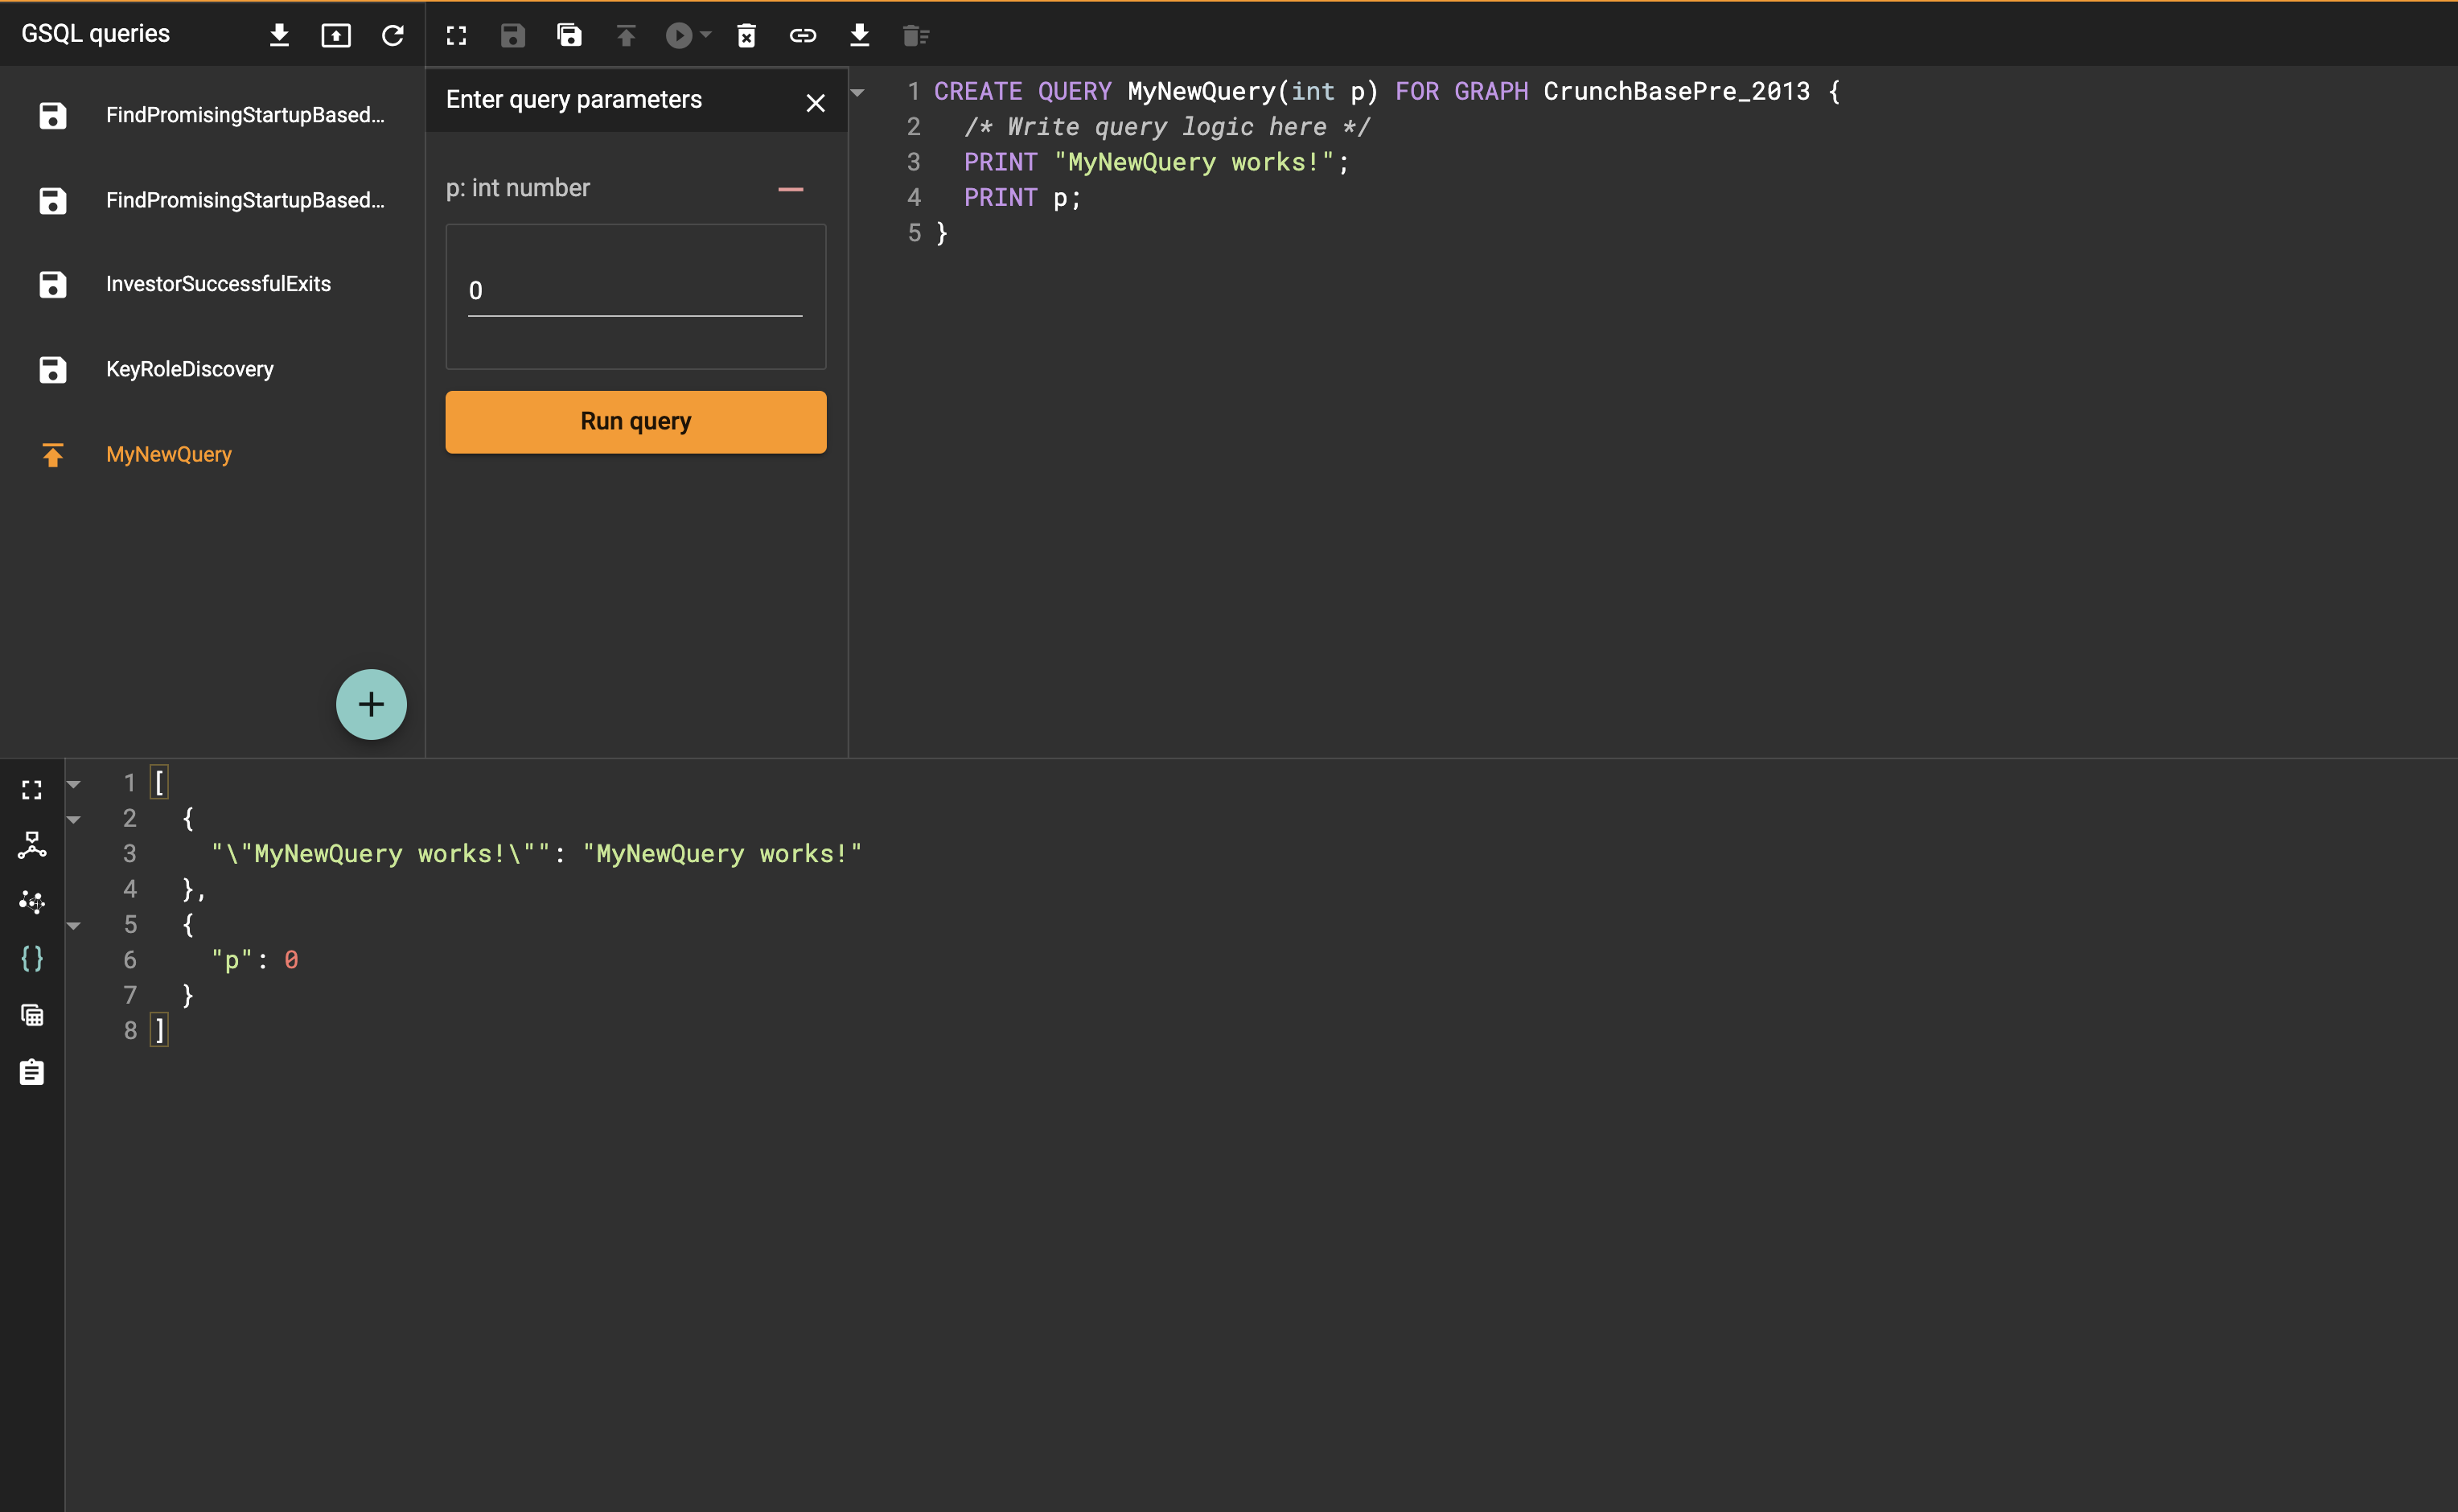
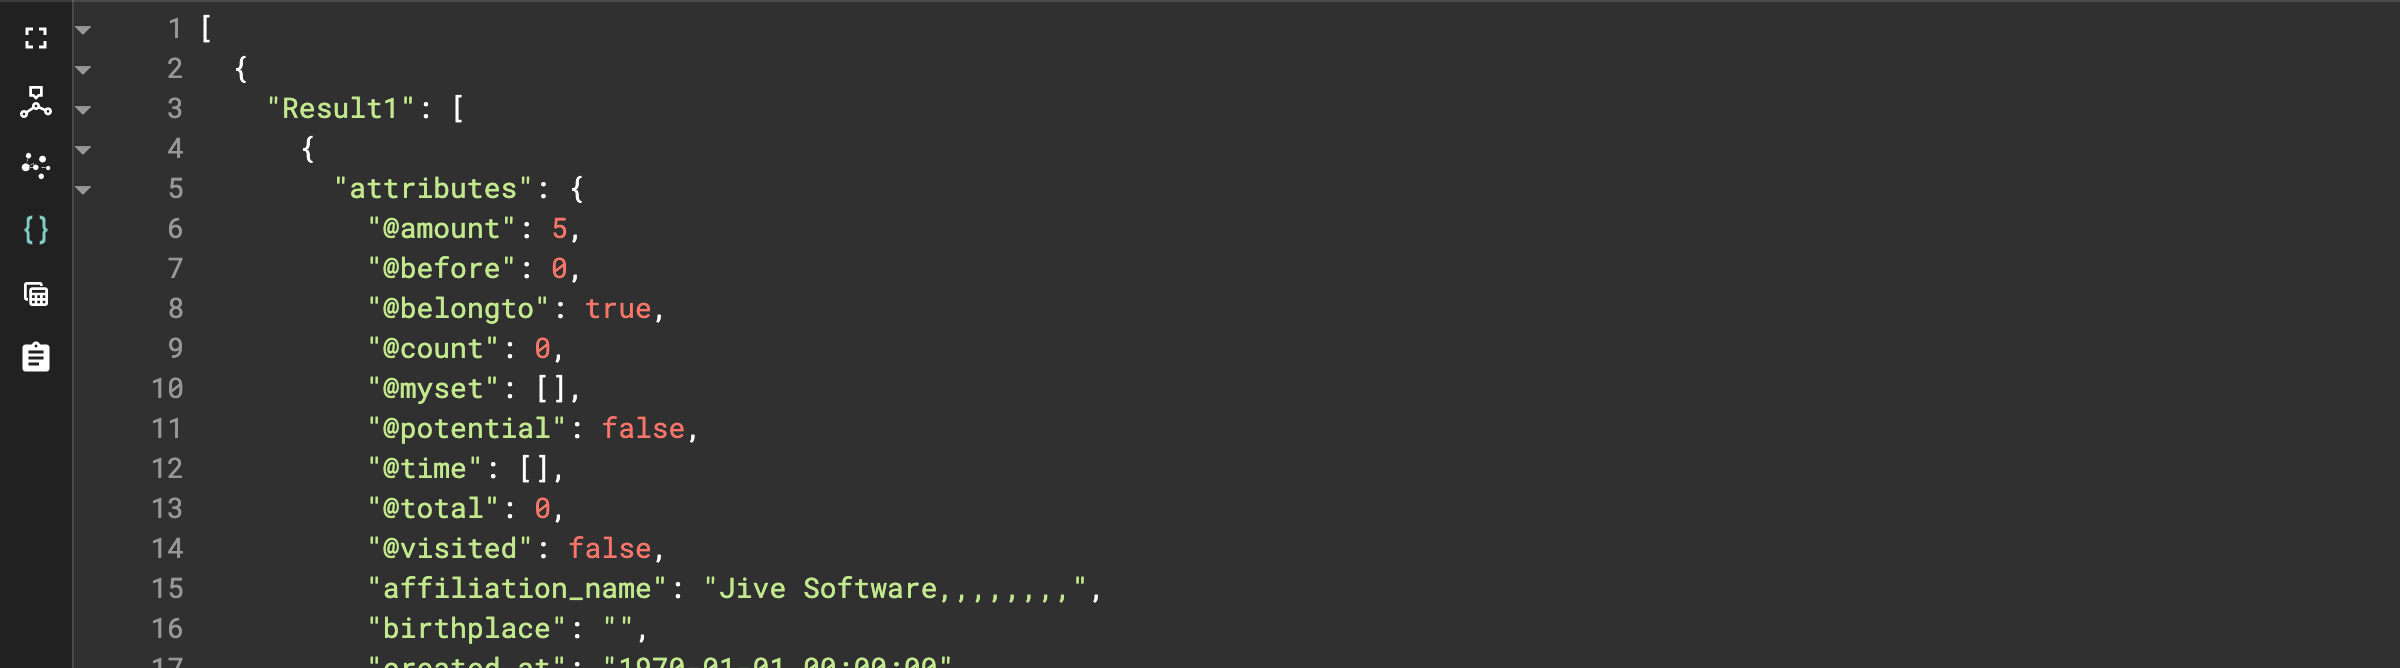
View JSON result
If there is no graph structure in the result, the result will be displayed in this panel as a JSON object.
View table result
You can display the query result as a table:
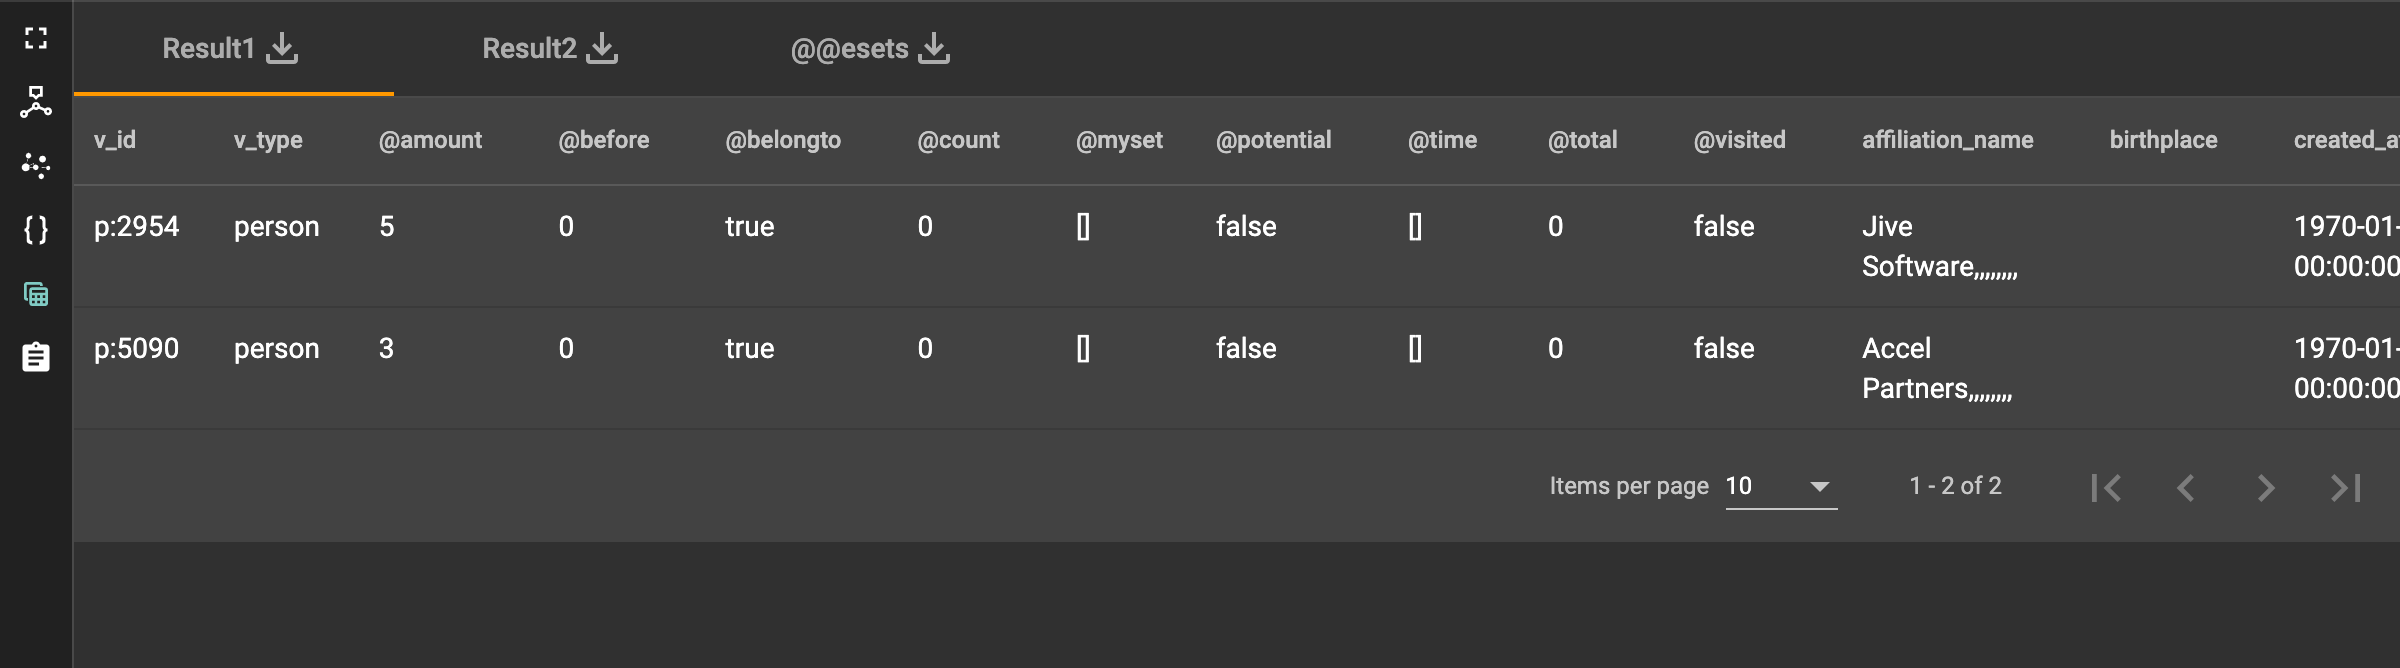
Table rows can be sorted by any column with primitive type values. You can also download the table as a CSV file by clicking the download button next to the table name.
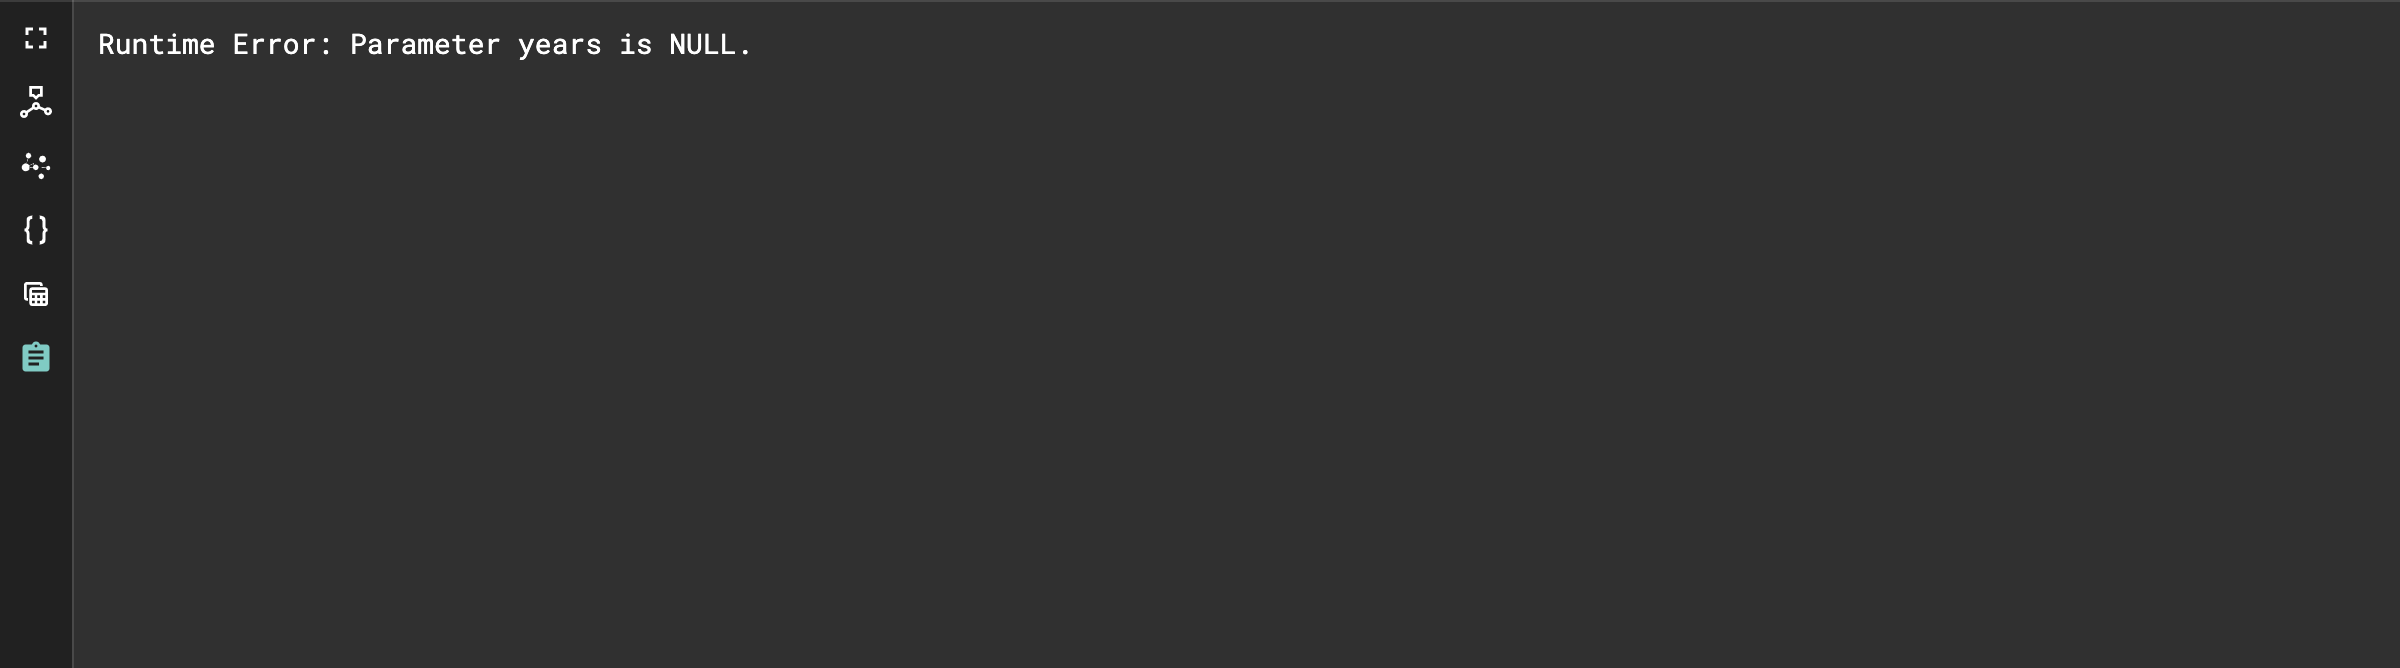
View logs
If a query ran successfully, the Query Log message will be "query ran successfully" or something similar. If there was anything wrong when executing your query, such as invalid parameters or runtime errors, an error message will be shown in the Query Log panel:
Expand Panels
If you just want to focus on developing your query, or want to have more
space to view your result, click the Expand button
 in either the Query
Editing panel or the Result panel.
in either the Query
Editing panel or the Result panel.
If you expand the Query Editing panel, it looks like this:
If you expand the Result panel, it looks like this:
When the panel is expanded, the Expand button becomes the Collapse
button  . Clicking it
will return the display to the split panel view.
. Clicking it
will return the display to the split panel view.