Visual Pattern Examples
You have learnt all the basic concepts of Visual Query Builder in the previous article. In this article we will walk you through building several visual patterns step by step, and then show you more graph analytics questions and how to solve them with visual patterns.
Example 1. Find all the departments with male employees
Click  in the pattern list pattern, input the pattern name, and click
  :
:

Click in the toolbar to add a vertex pattern:
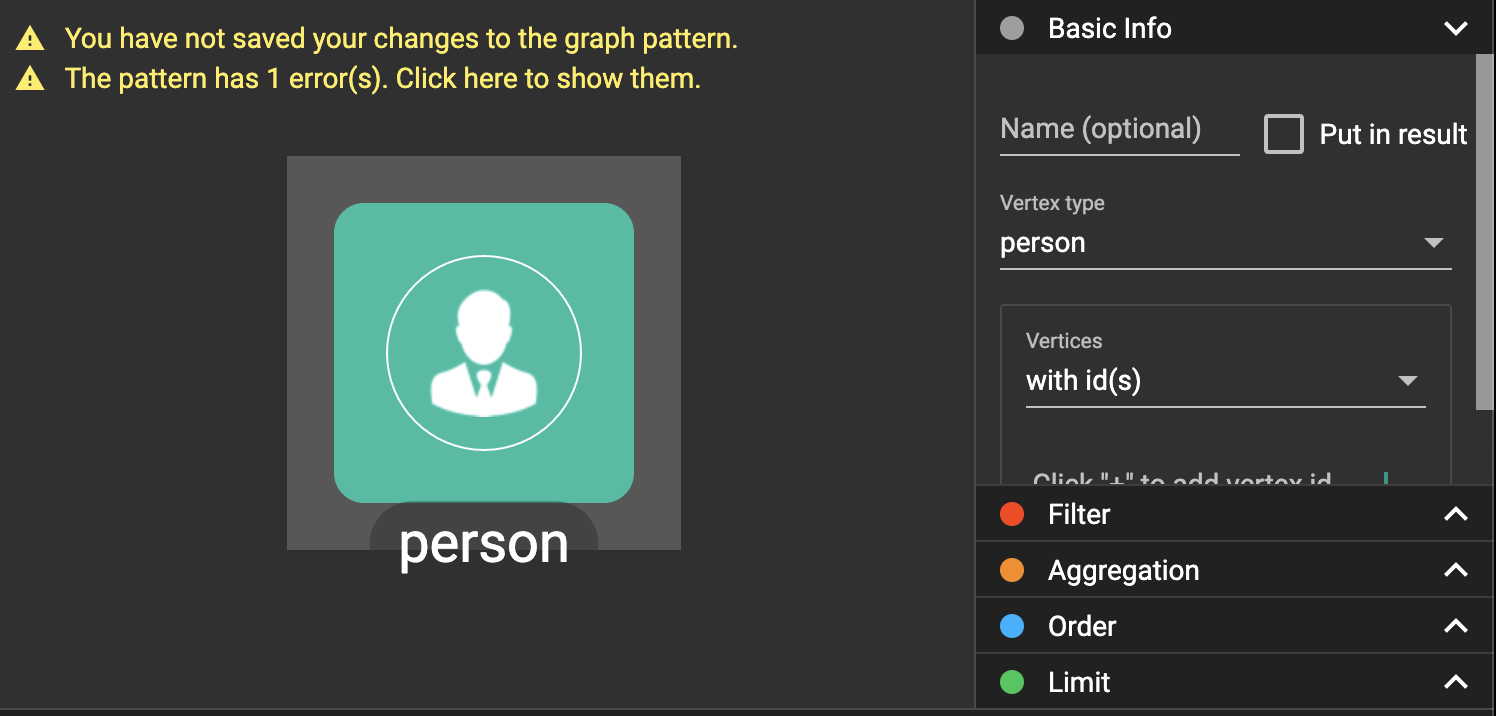
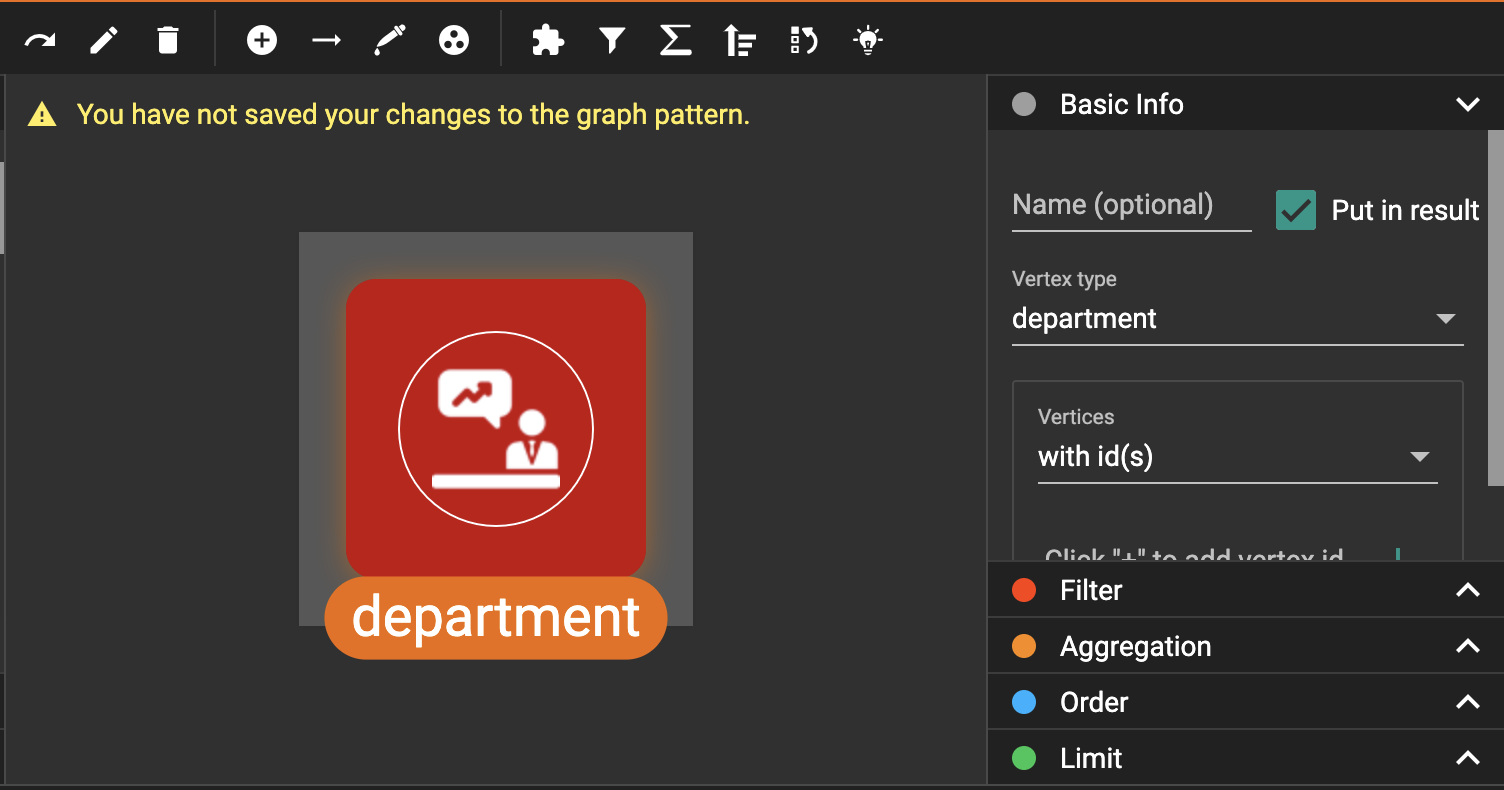
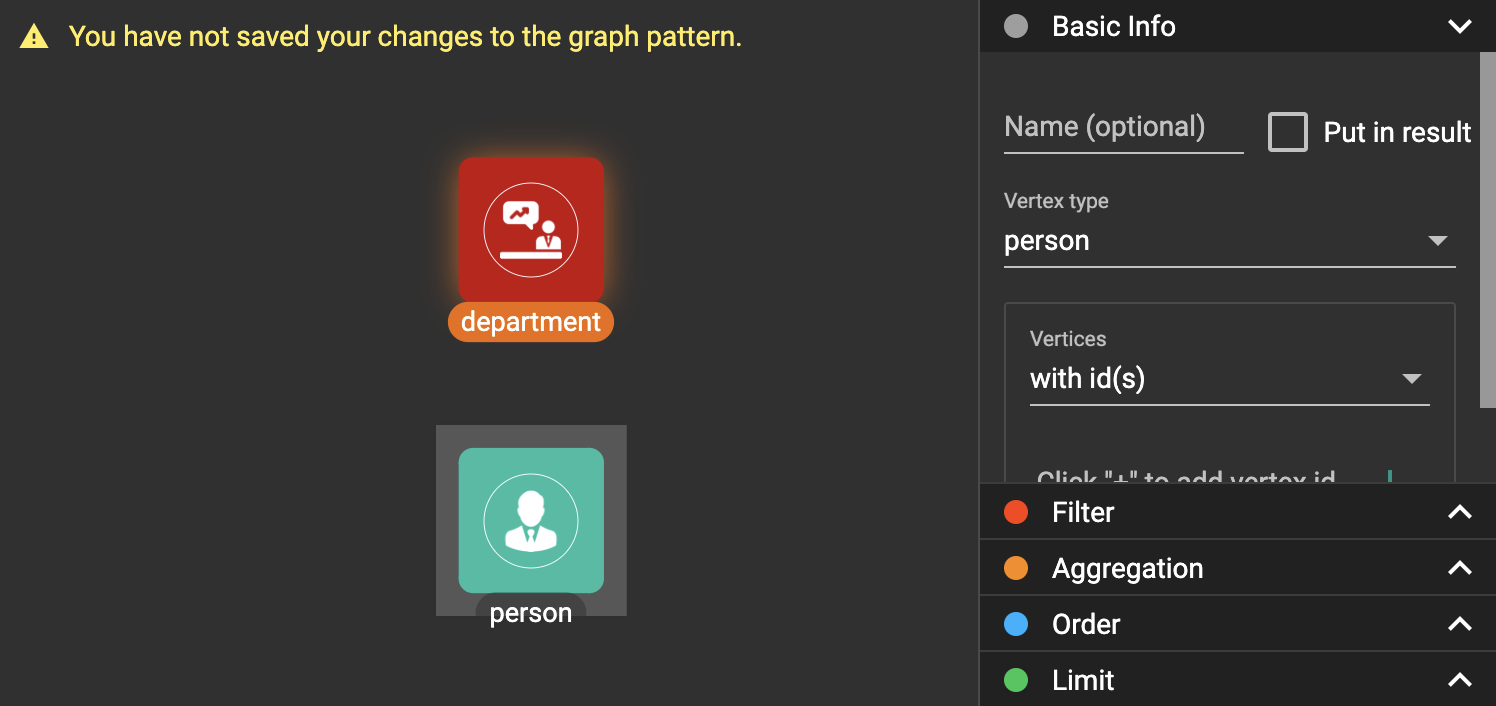
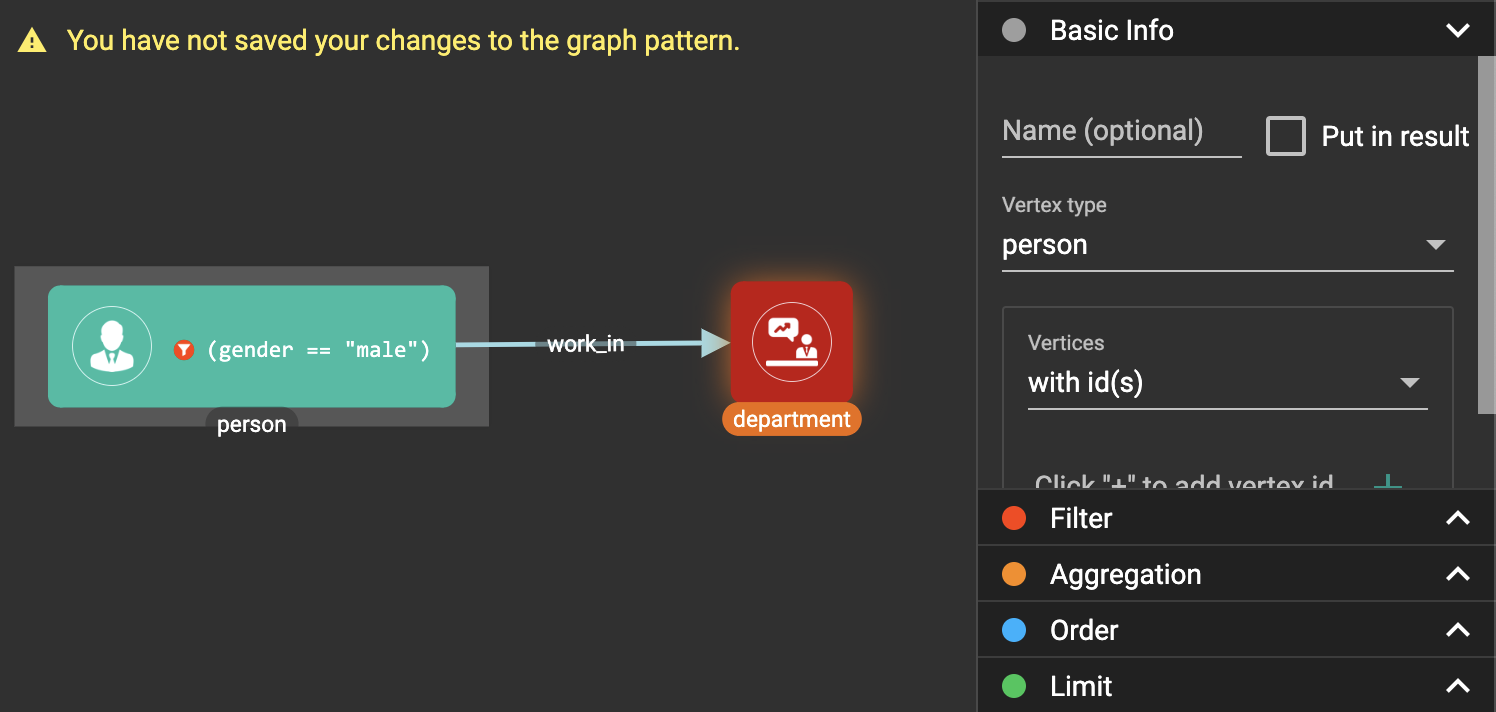
In the config panel, change the vertex type to be department, and put it in result:
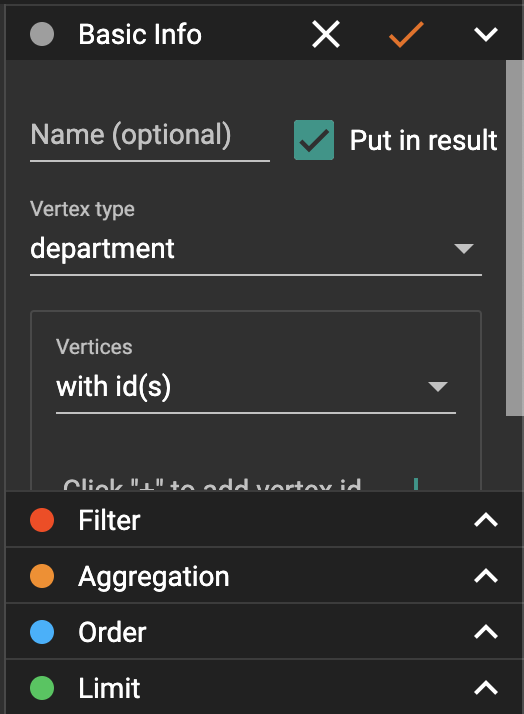
Confirm the change by click :
:
Clickin the toolbar to add another vertex pattern:
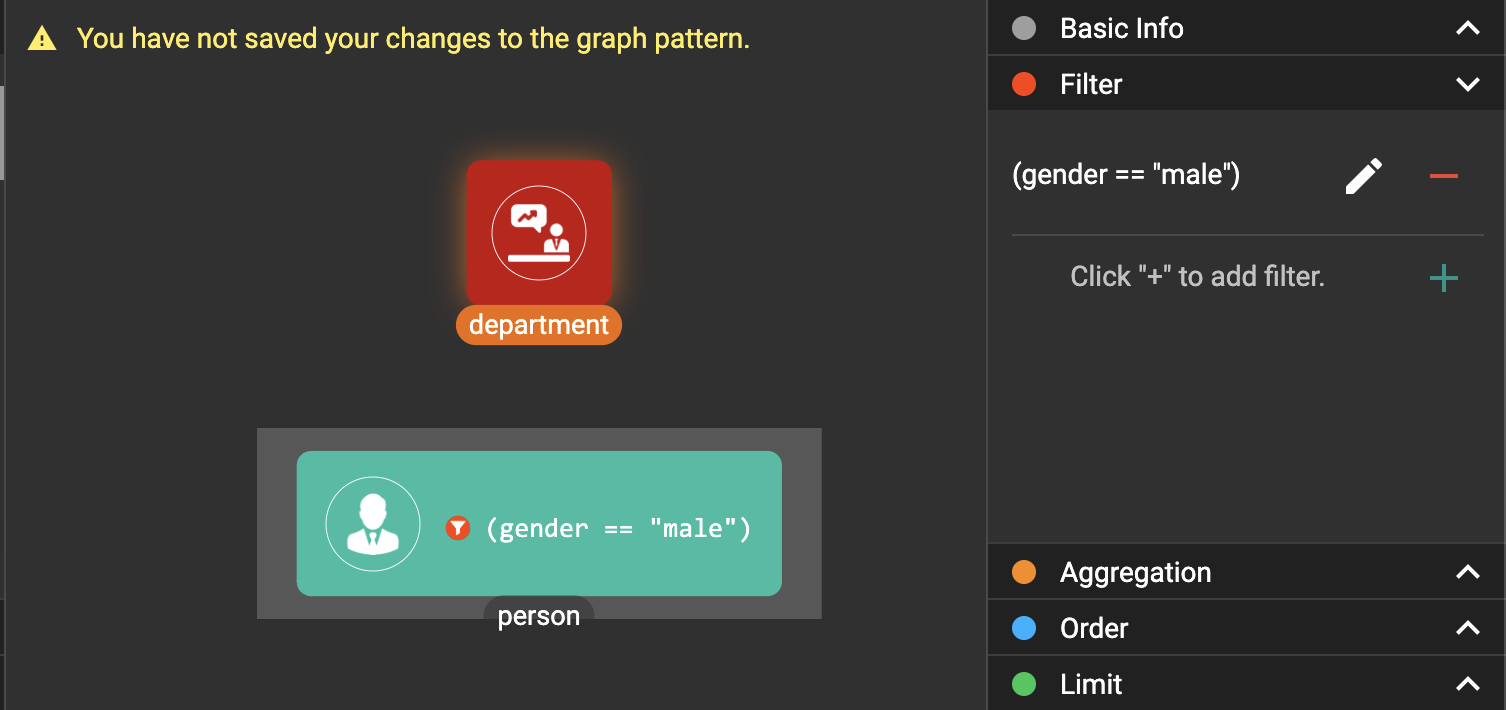
Expand the Filter section in the config panel:
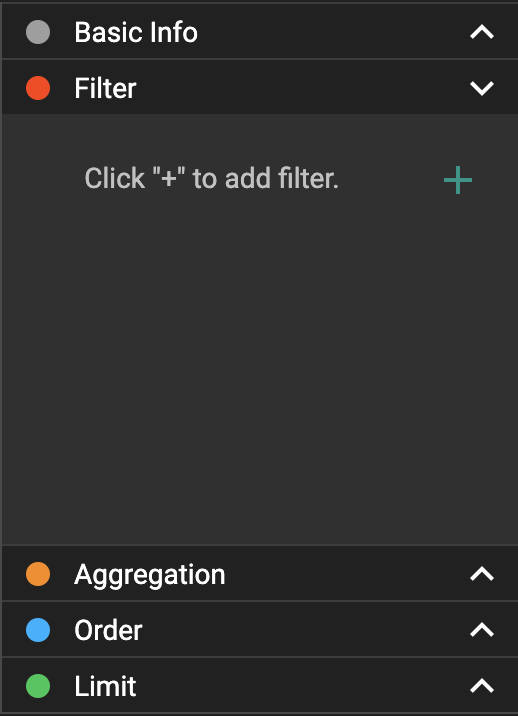
Click to add a filter:
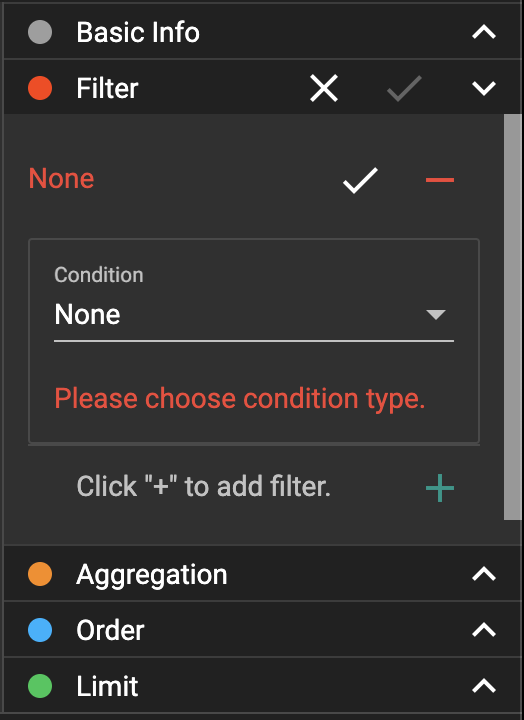
Edit the filter to be (gender == "male"):
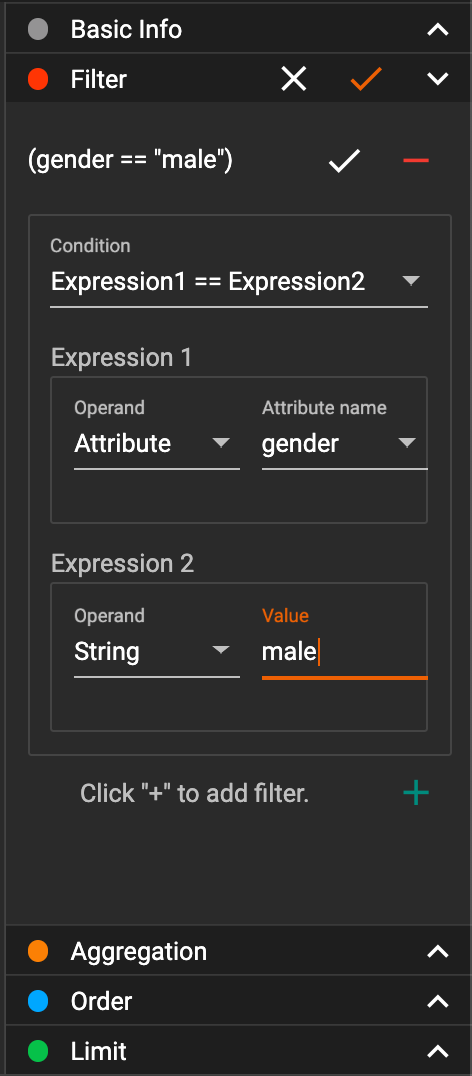
Confirm the change:
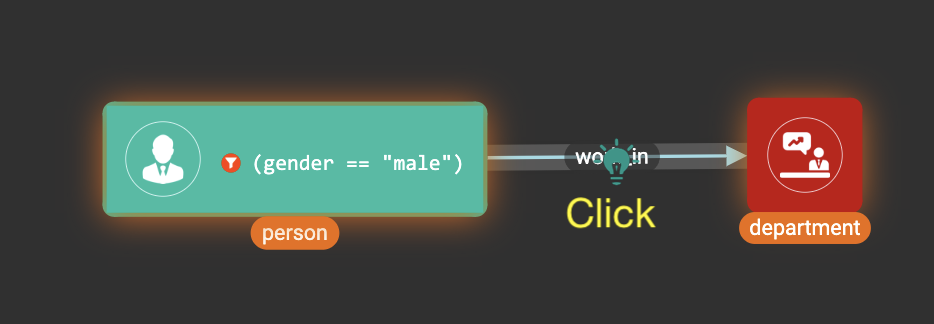
Click in the toolbar, then click the person vertex pattern in the working panel:
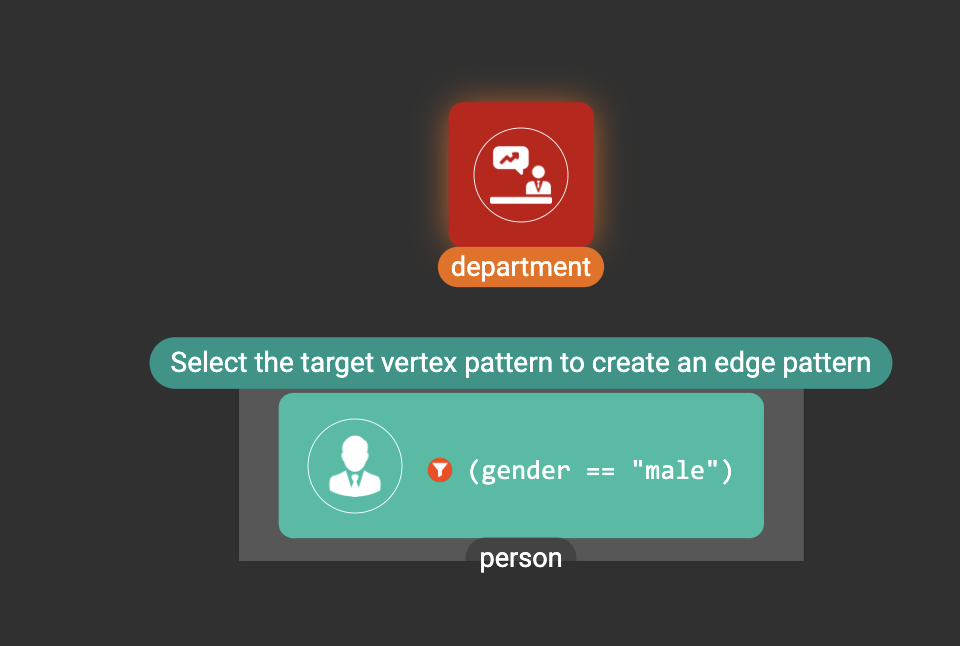
Then click department vertex pattern in the working panel to create an edge pattern between the two vertex patterns:
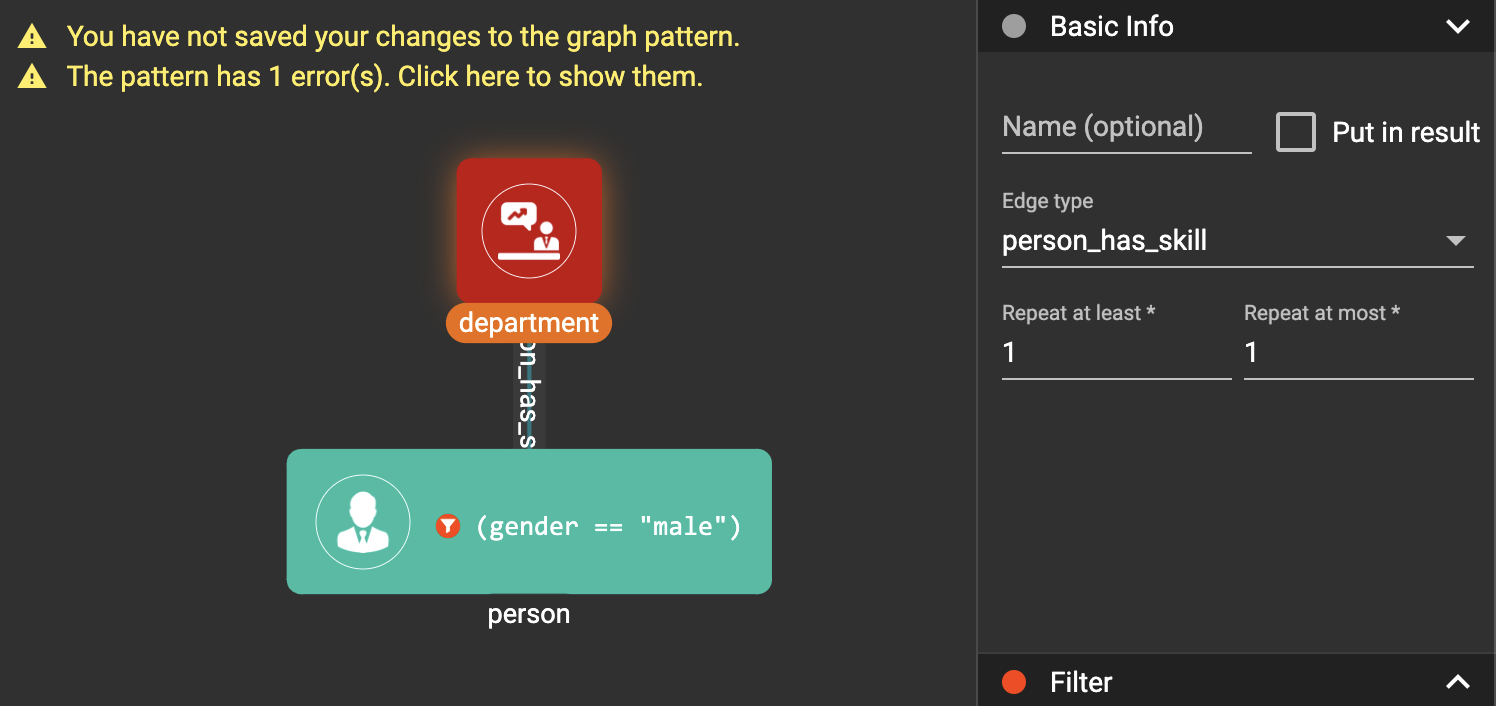
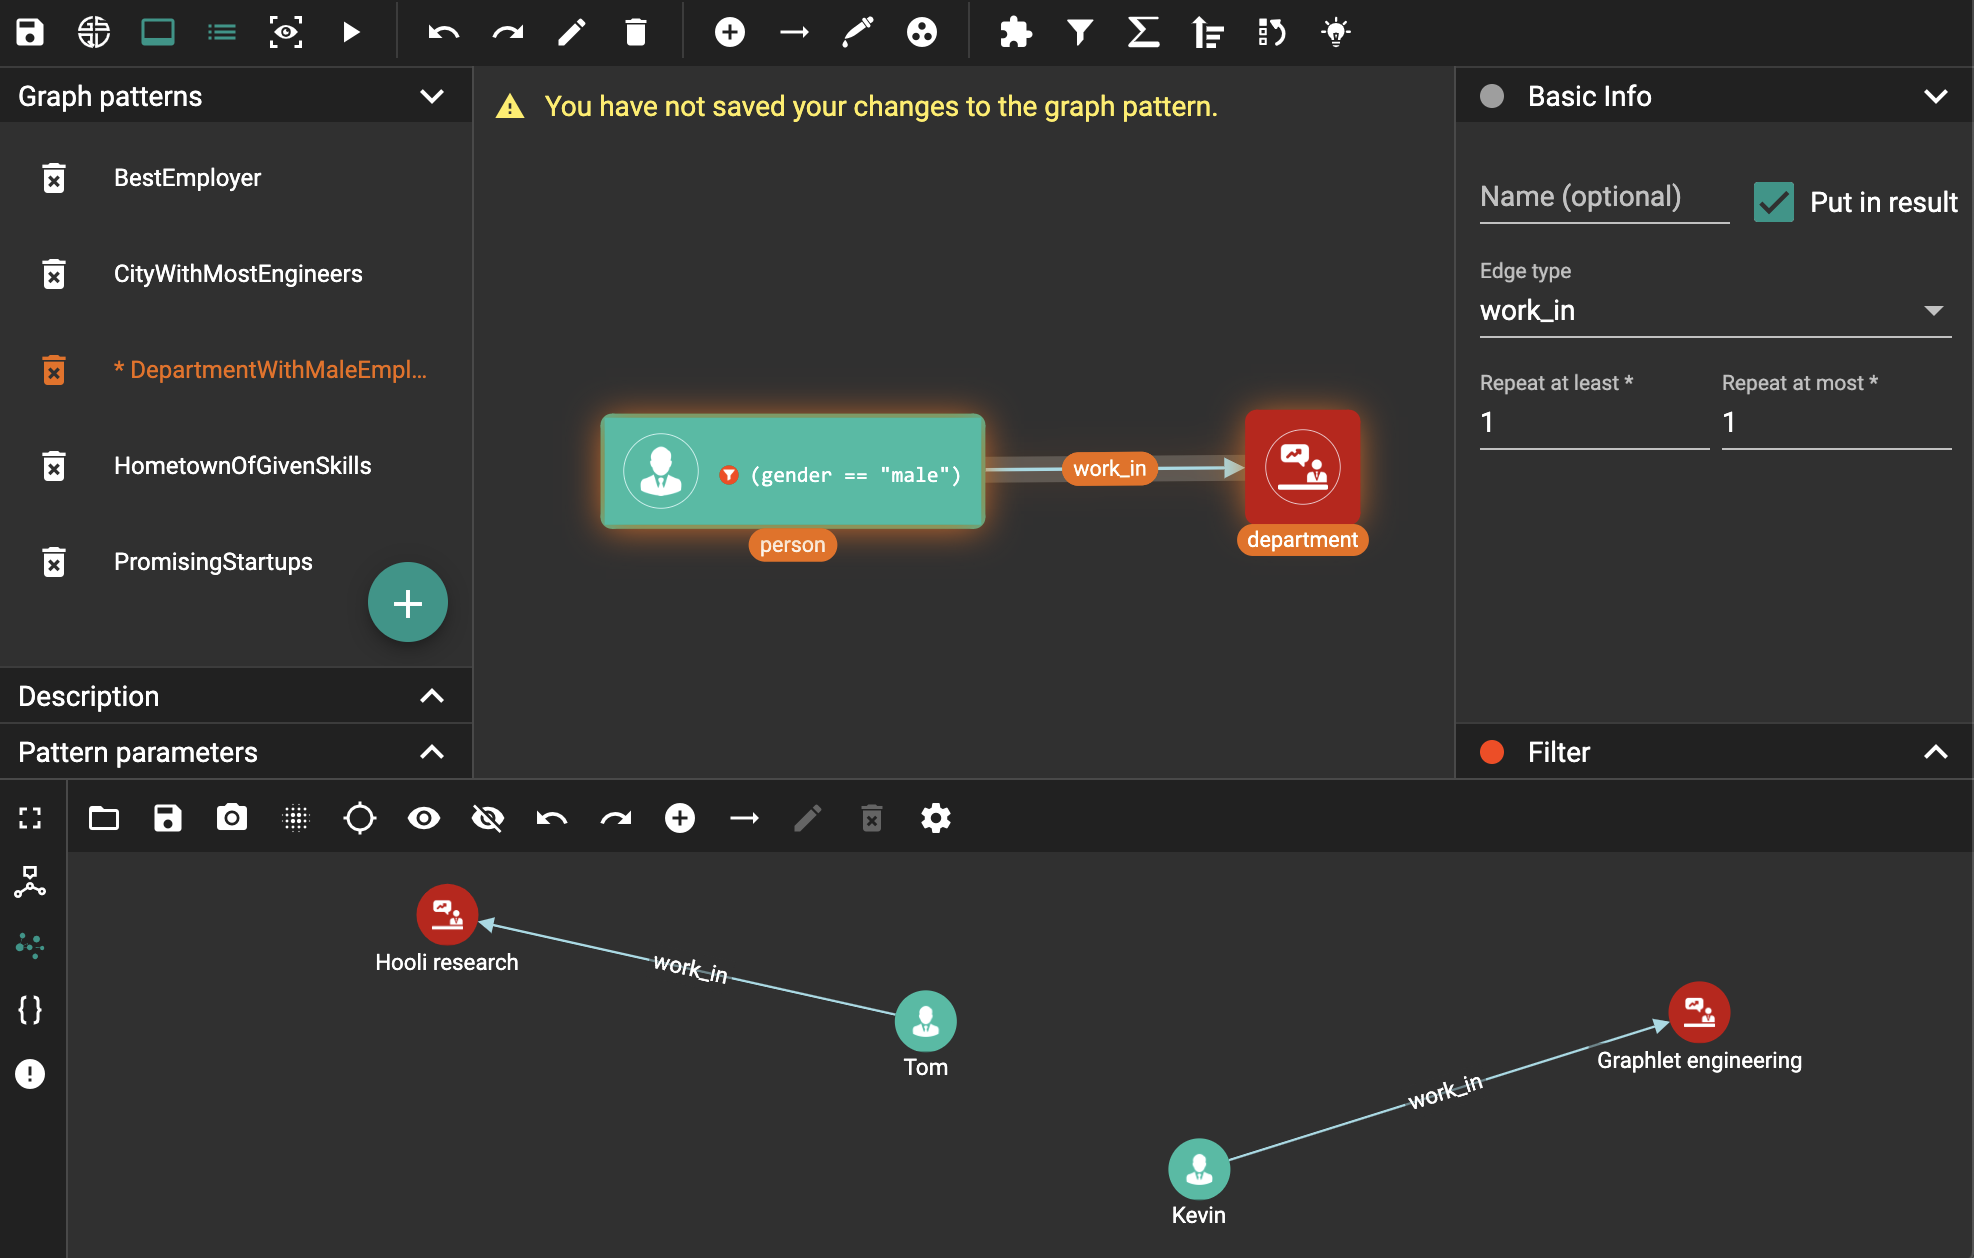
In the config panel, change the edge type to be work_in:
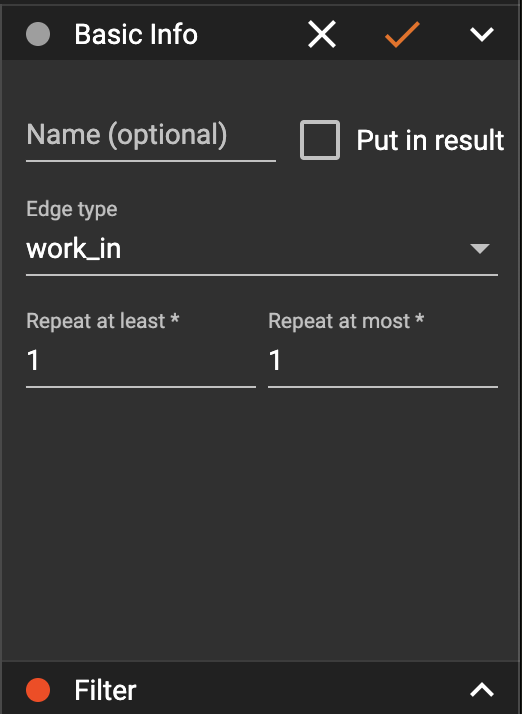
Apply the change, and drag the person vertex pattern to a better position:
Click  in the toolbar to
save the pattern, and
click
in the toolbar to
save the pattern, and
click  in the
toolbar to run the pattern:assets_-lhvjxin4__6ba0t-qmu_-lvvuteg9eqbxemig3sx_-lvwdbsyr4slvpf3q_x3_run-pattern.png[image]
in the
toolbar to run the pattern:assets_-lhvjxin4__6ba0t-qmu_-lvvuteg9eqbxemig3sx_-lvwdbsyr4slvpf3q_x3_run-pattern.png[image]
You can also try to output the entire matched subgraphs.
Click  in the toolbar
to enter output toggle mode, then click the person vertex pattern and
the work_in edge pattern:
in the toolbar
to enter output toggle mode, then click the person vertex pattern and
the work_in edge pattern:
Click in the toolbar
again to exit output toggle mode, then
click to run the
pattern:
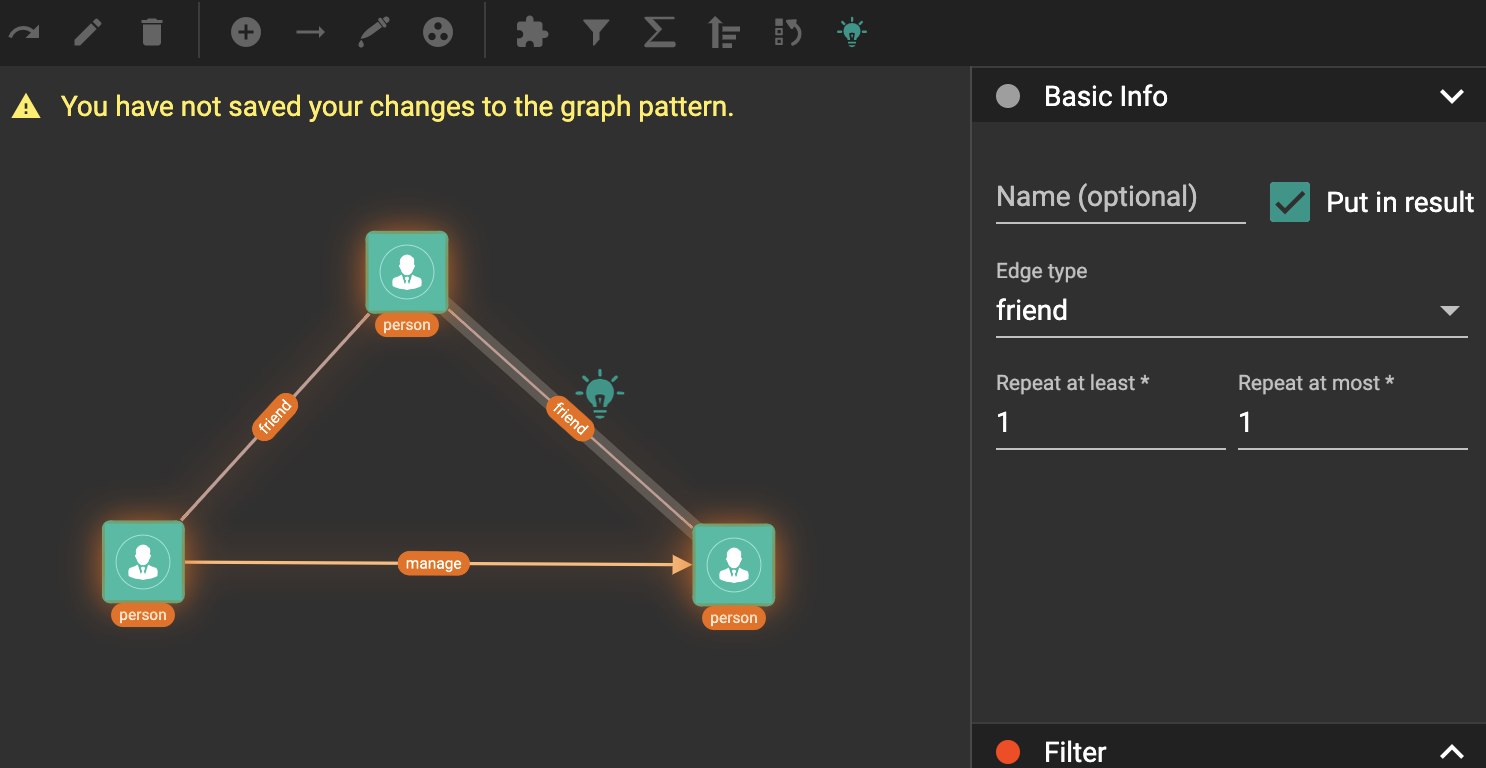
Example 2. Find all such people A, B, C: A and B are friends, A and C are friends, and B manages C.
Create a new visual pattern named FriendsManagerABC.
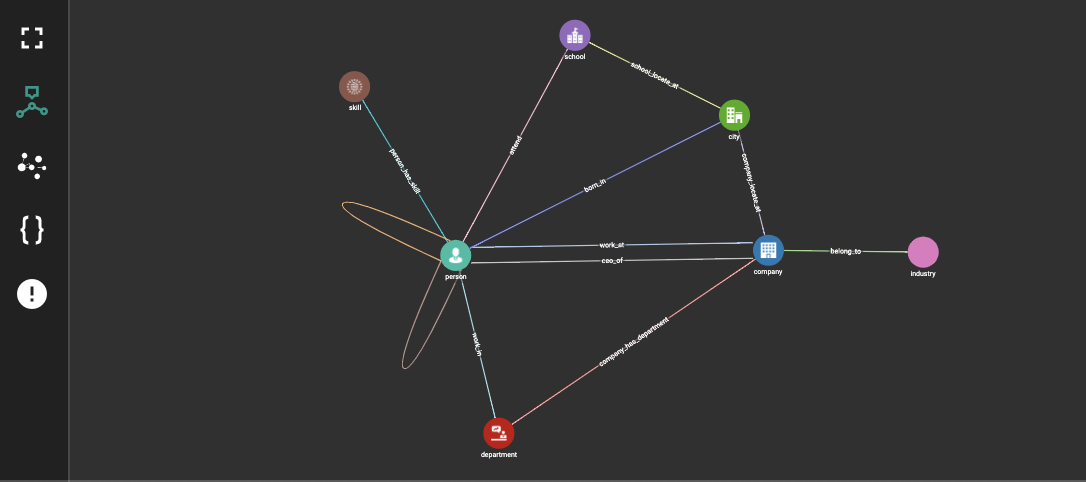
Click %20(1).png) in
the console panel to switch to graph schema:
in
the console panel to switch to graph schema:
Click  in the toolbar,
then click the friend edge type in the graph schema:
in the toolbar,
then click the friend edge type in the graph schema:
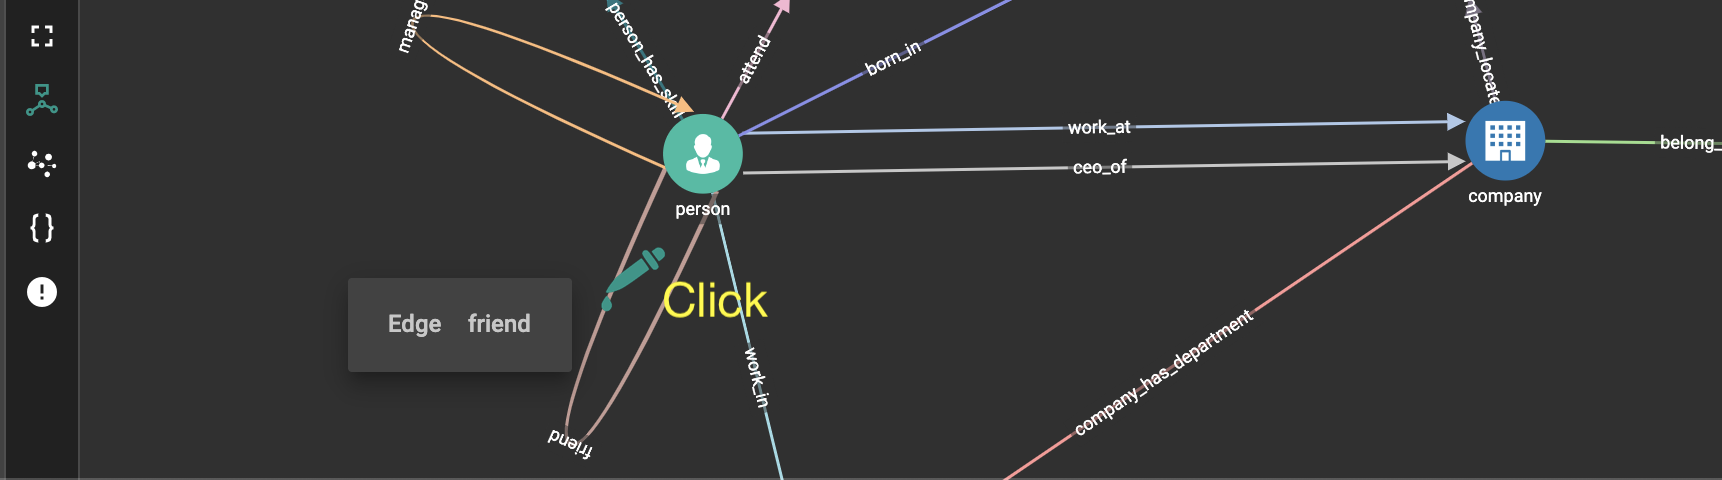
An edge pattern is added into the working panel:
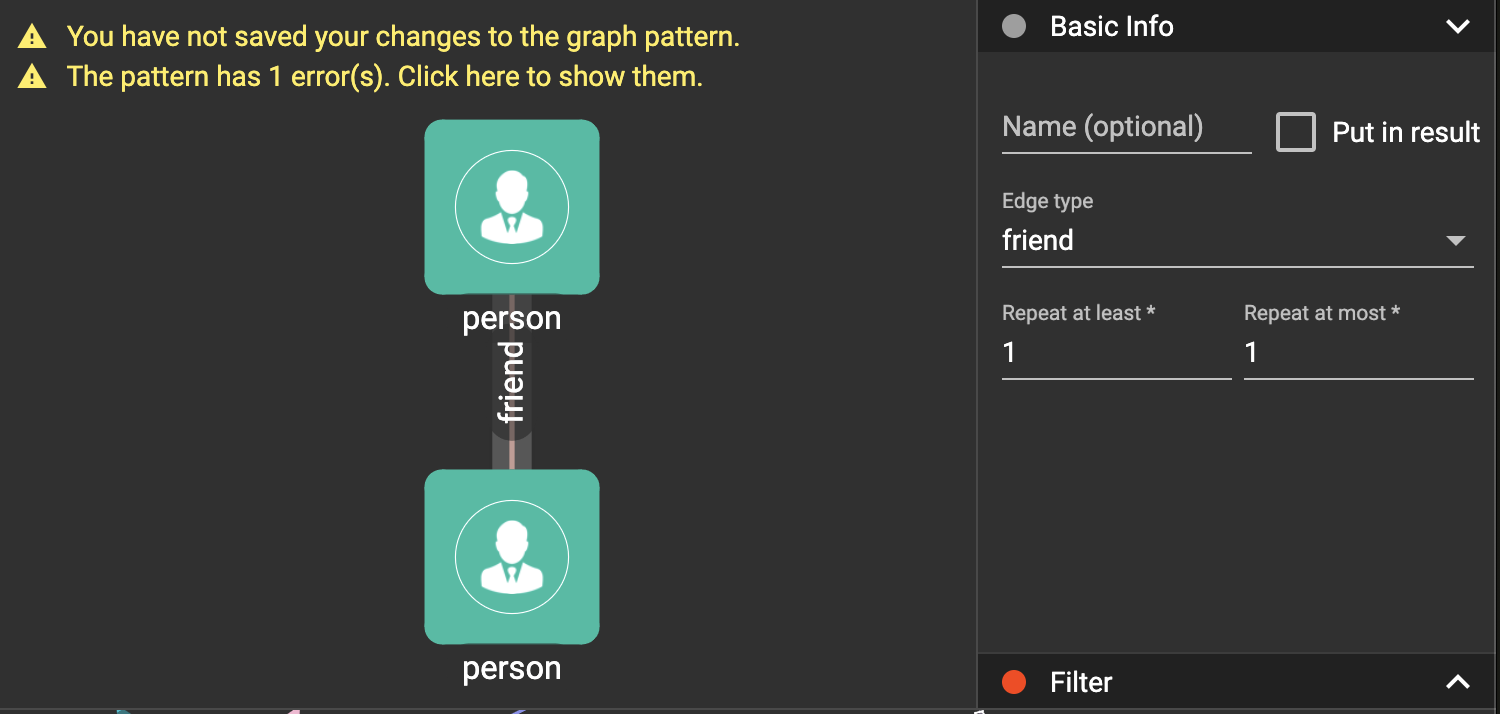
Similarly, use to add
another friend edge pattern and a manage edge pattern into the working
panel:
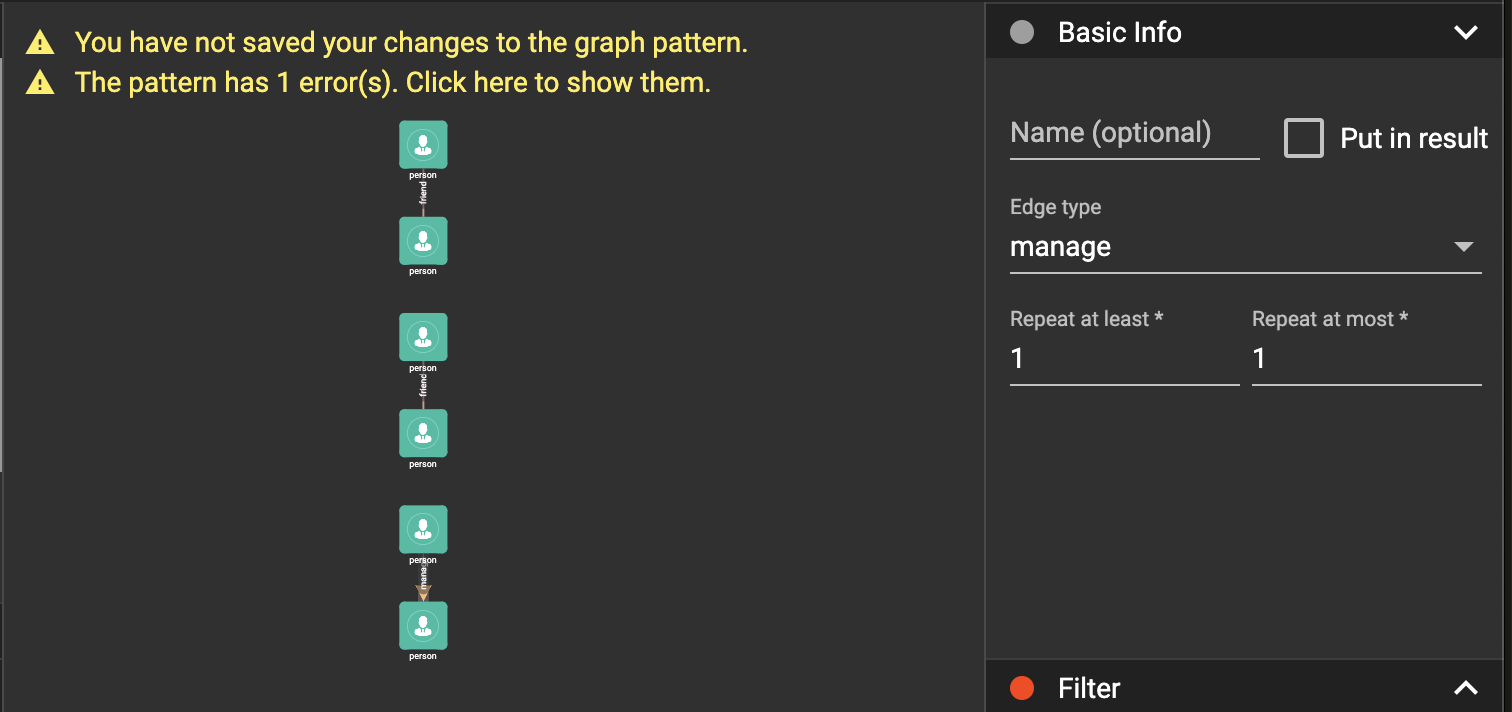
Adjust the vertex patterns' positions:
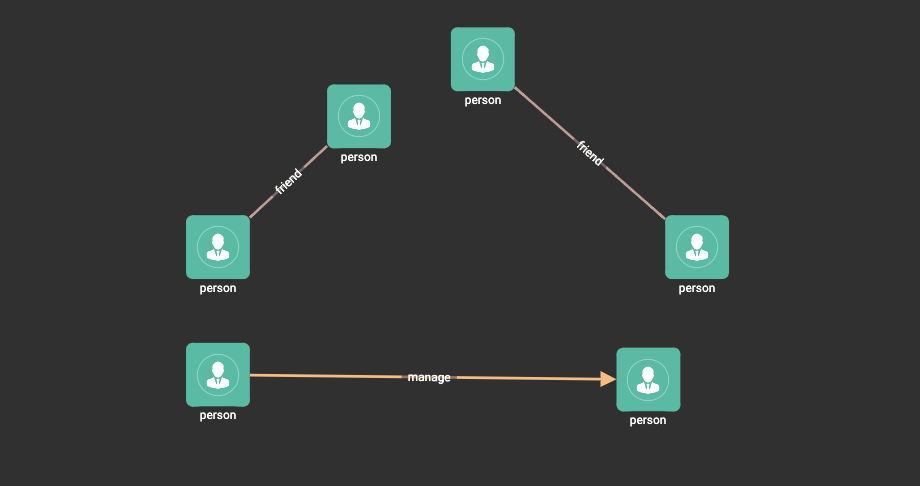
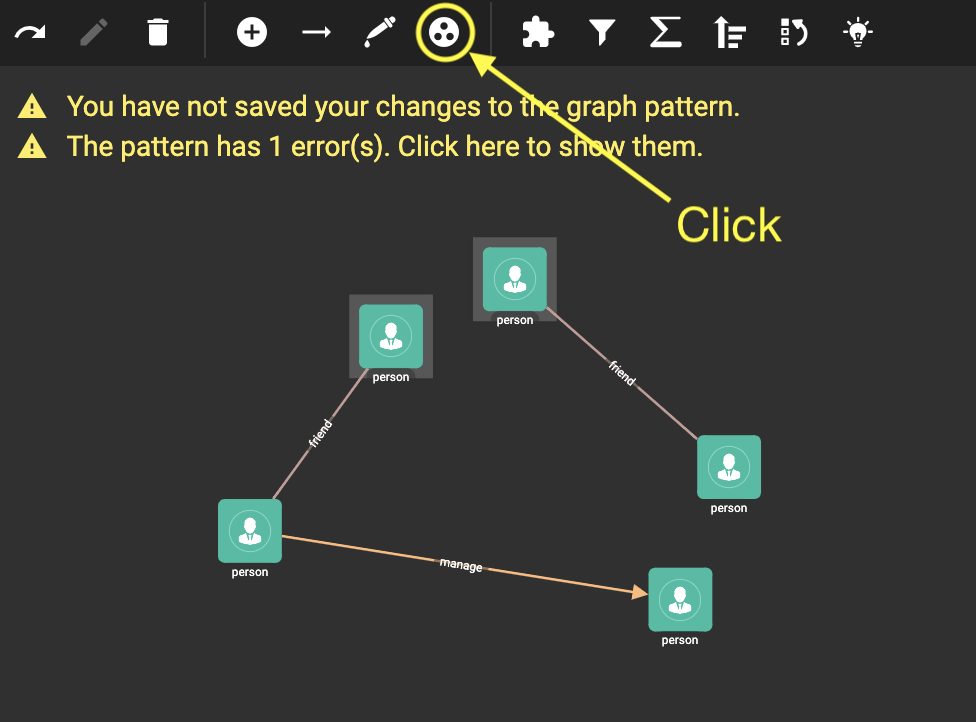
Hold Shift key and choose the two vertex patterns on the left, then
click  in the toolbar
to merge them together:
in the toolbar
to merge them together:
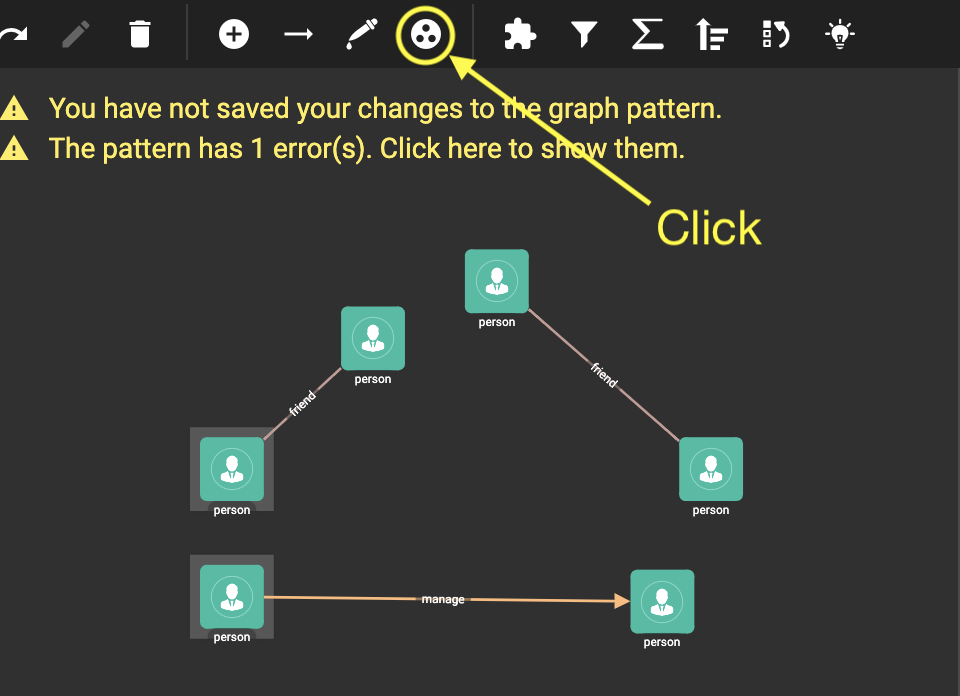
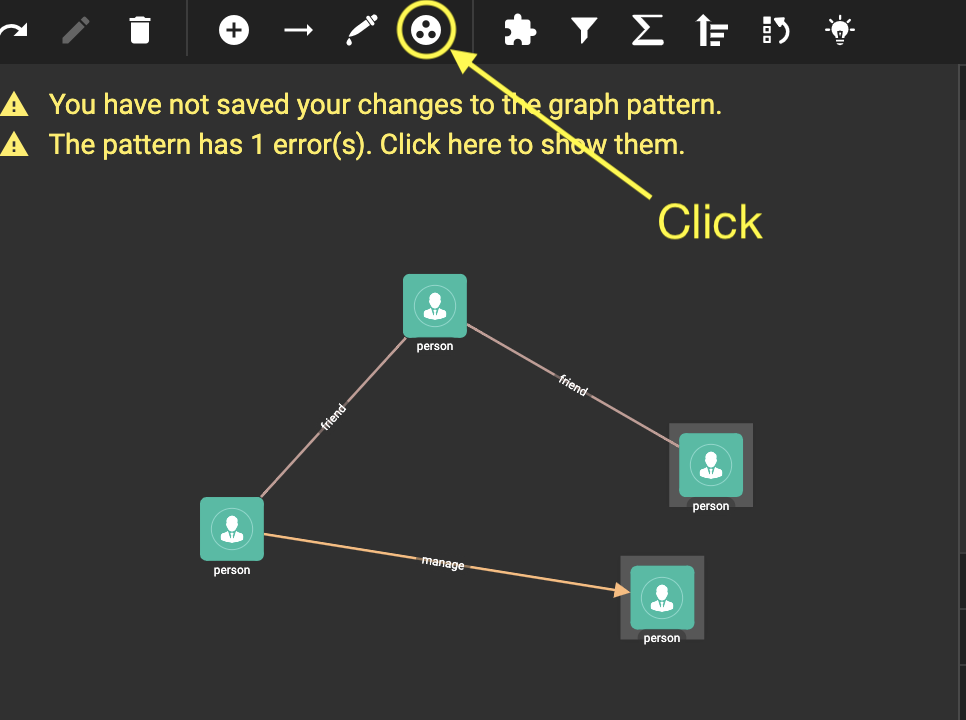
Then, merge the top two vertex patterns:
Then, merge the right two vertex patterns:
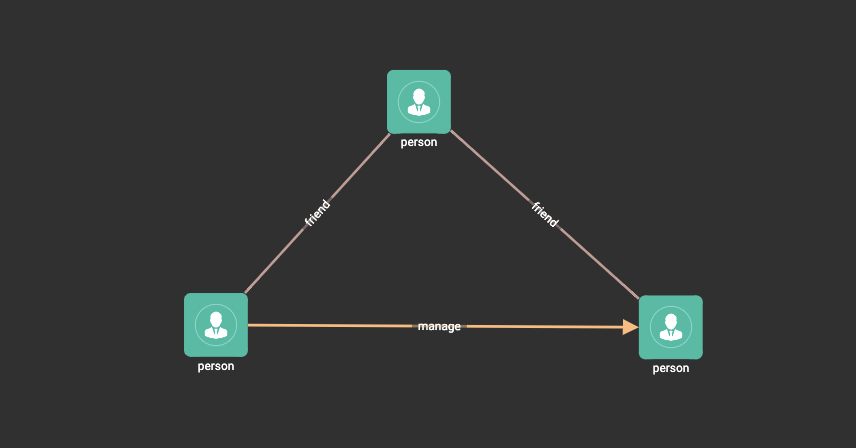
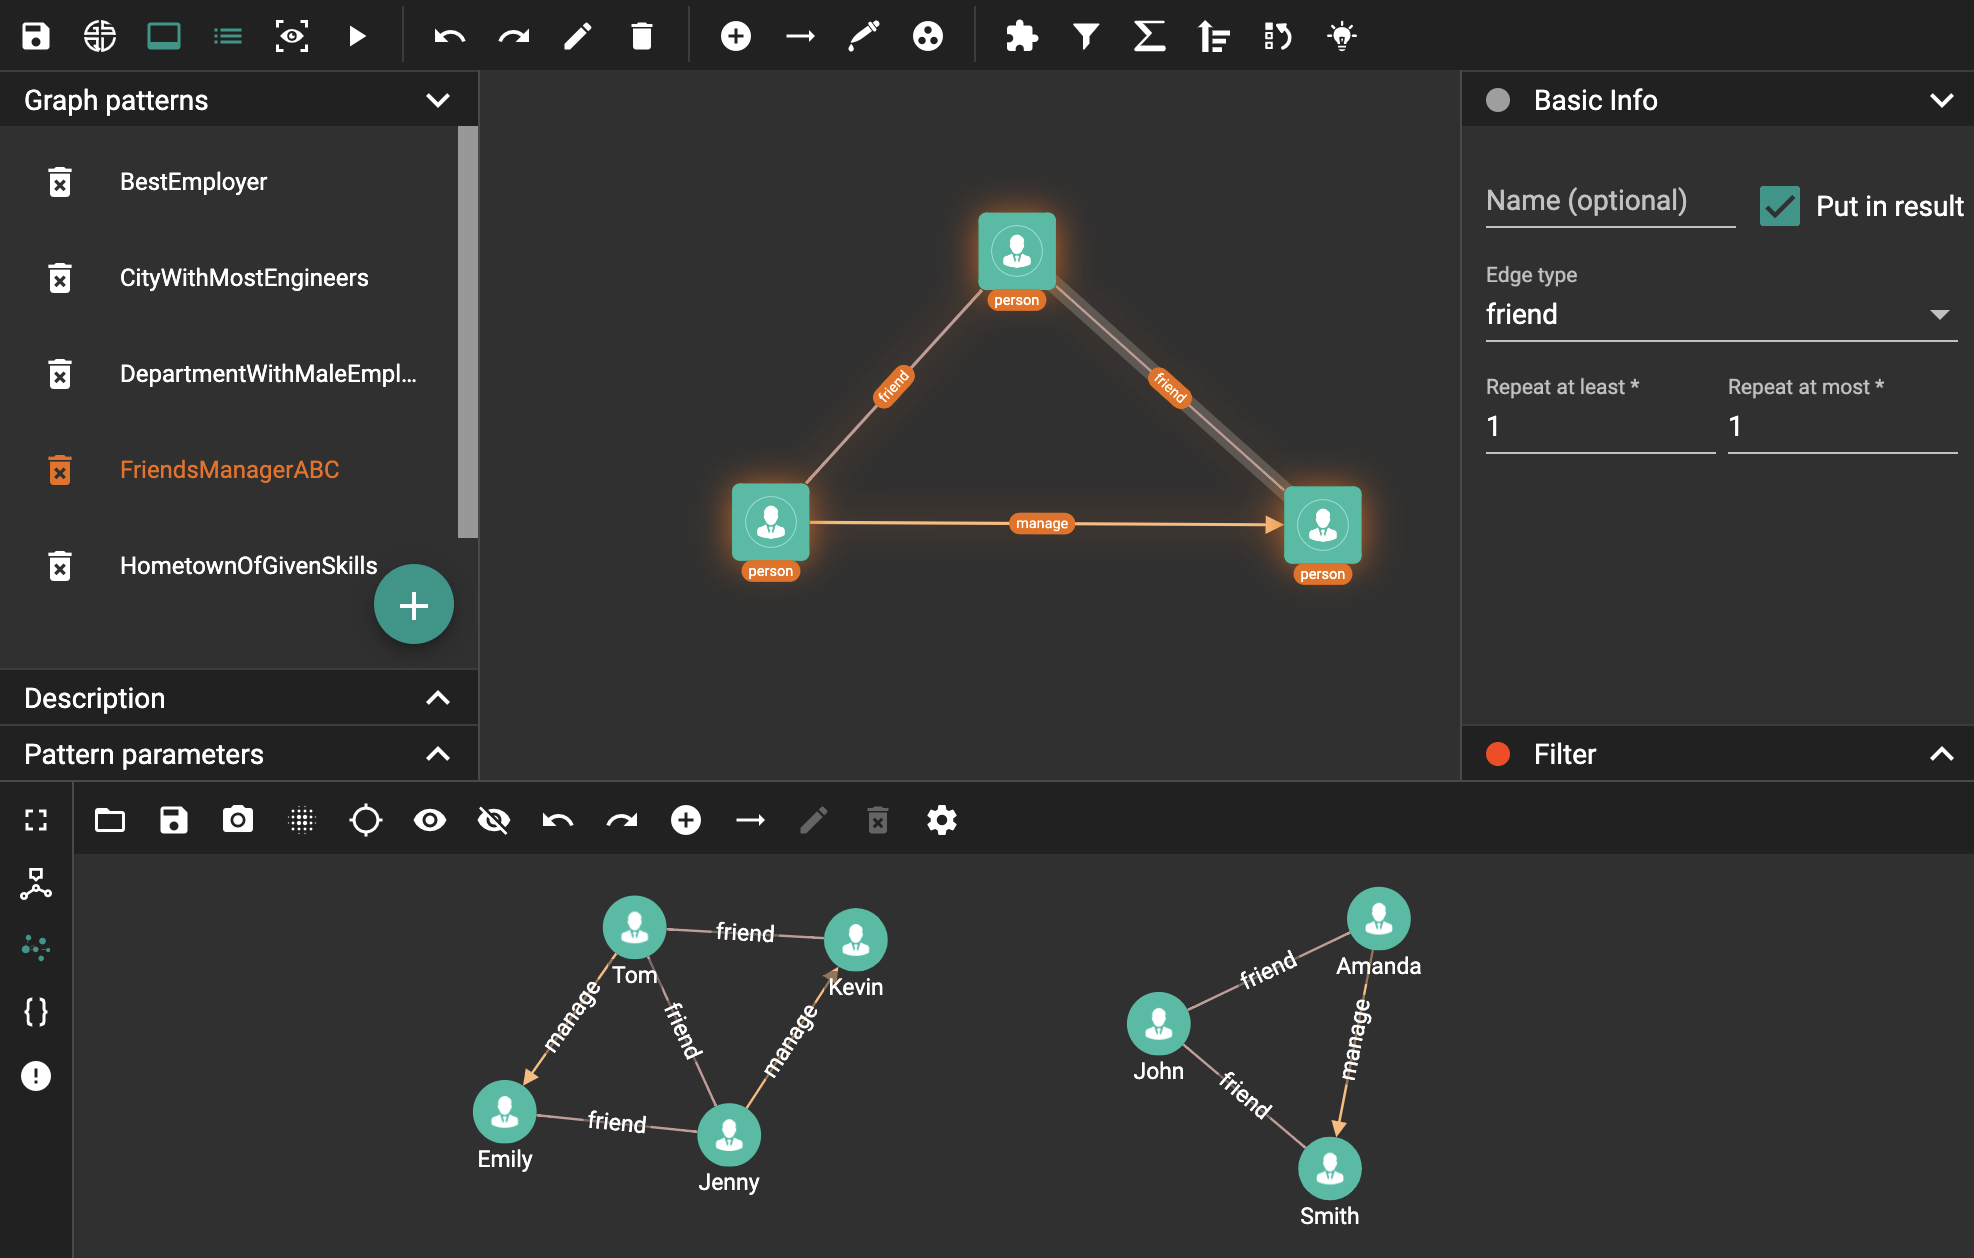
Now you have a triangle visual pattern representing the three people relationship!
Now, click in the
toolbar and put all the vertex patterns and edge patterns into result:
Click again to exit
output toggle mode,
click to save the
pattern, and
click to run the
pattern:
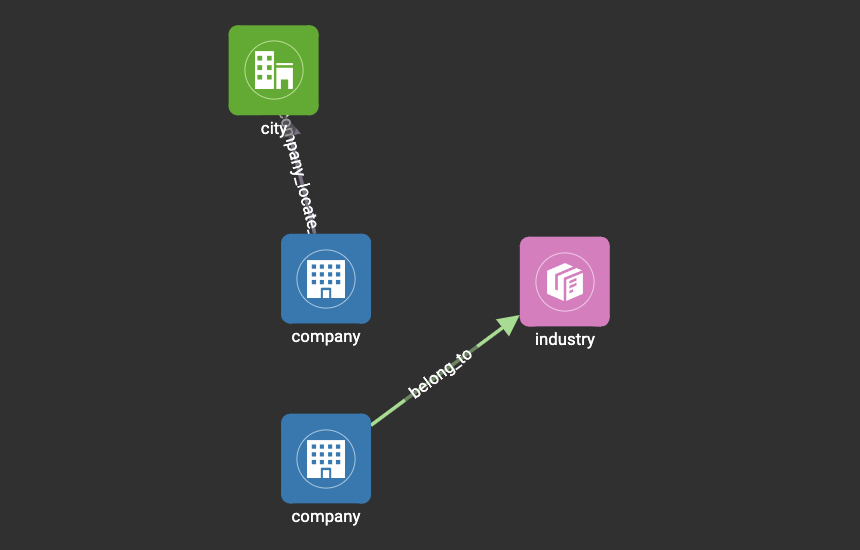
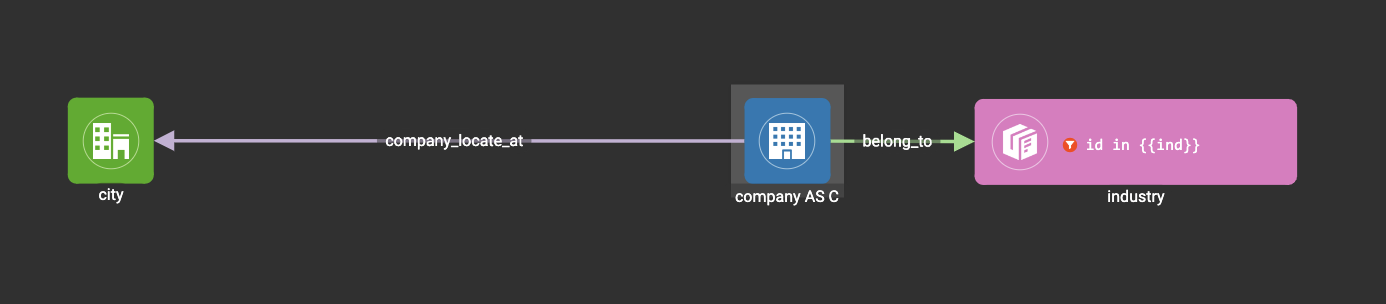
Example 3. Find the top 2 cities where the most number of companies of an industry are located in.
Create a new visual pattern named IndustryCenterCity.
Click  in
the console panel to switch to graph schema.
in
the console panel to switch to graph schema.
Use in the toolbar to
pick the company_locate_at edge type and belong_to edge type in graph
schema:
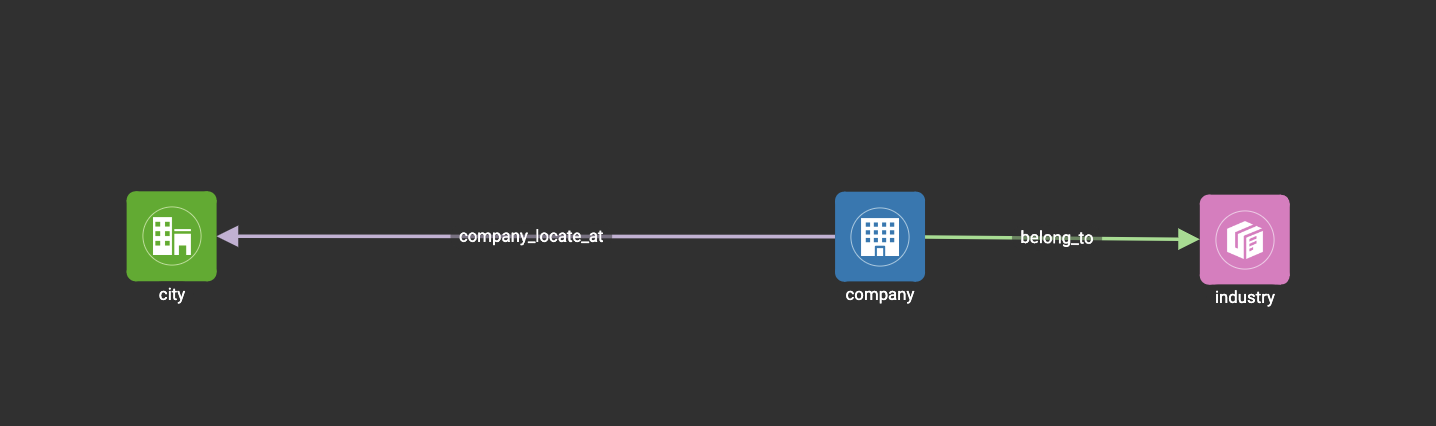
Use Shift key to select the two company vertex patterns, and
click to merge them
into one. Drag the vertex patterns to make their positions look good:
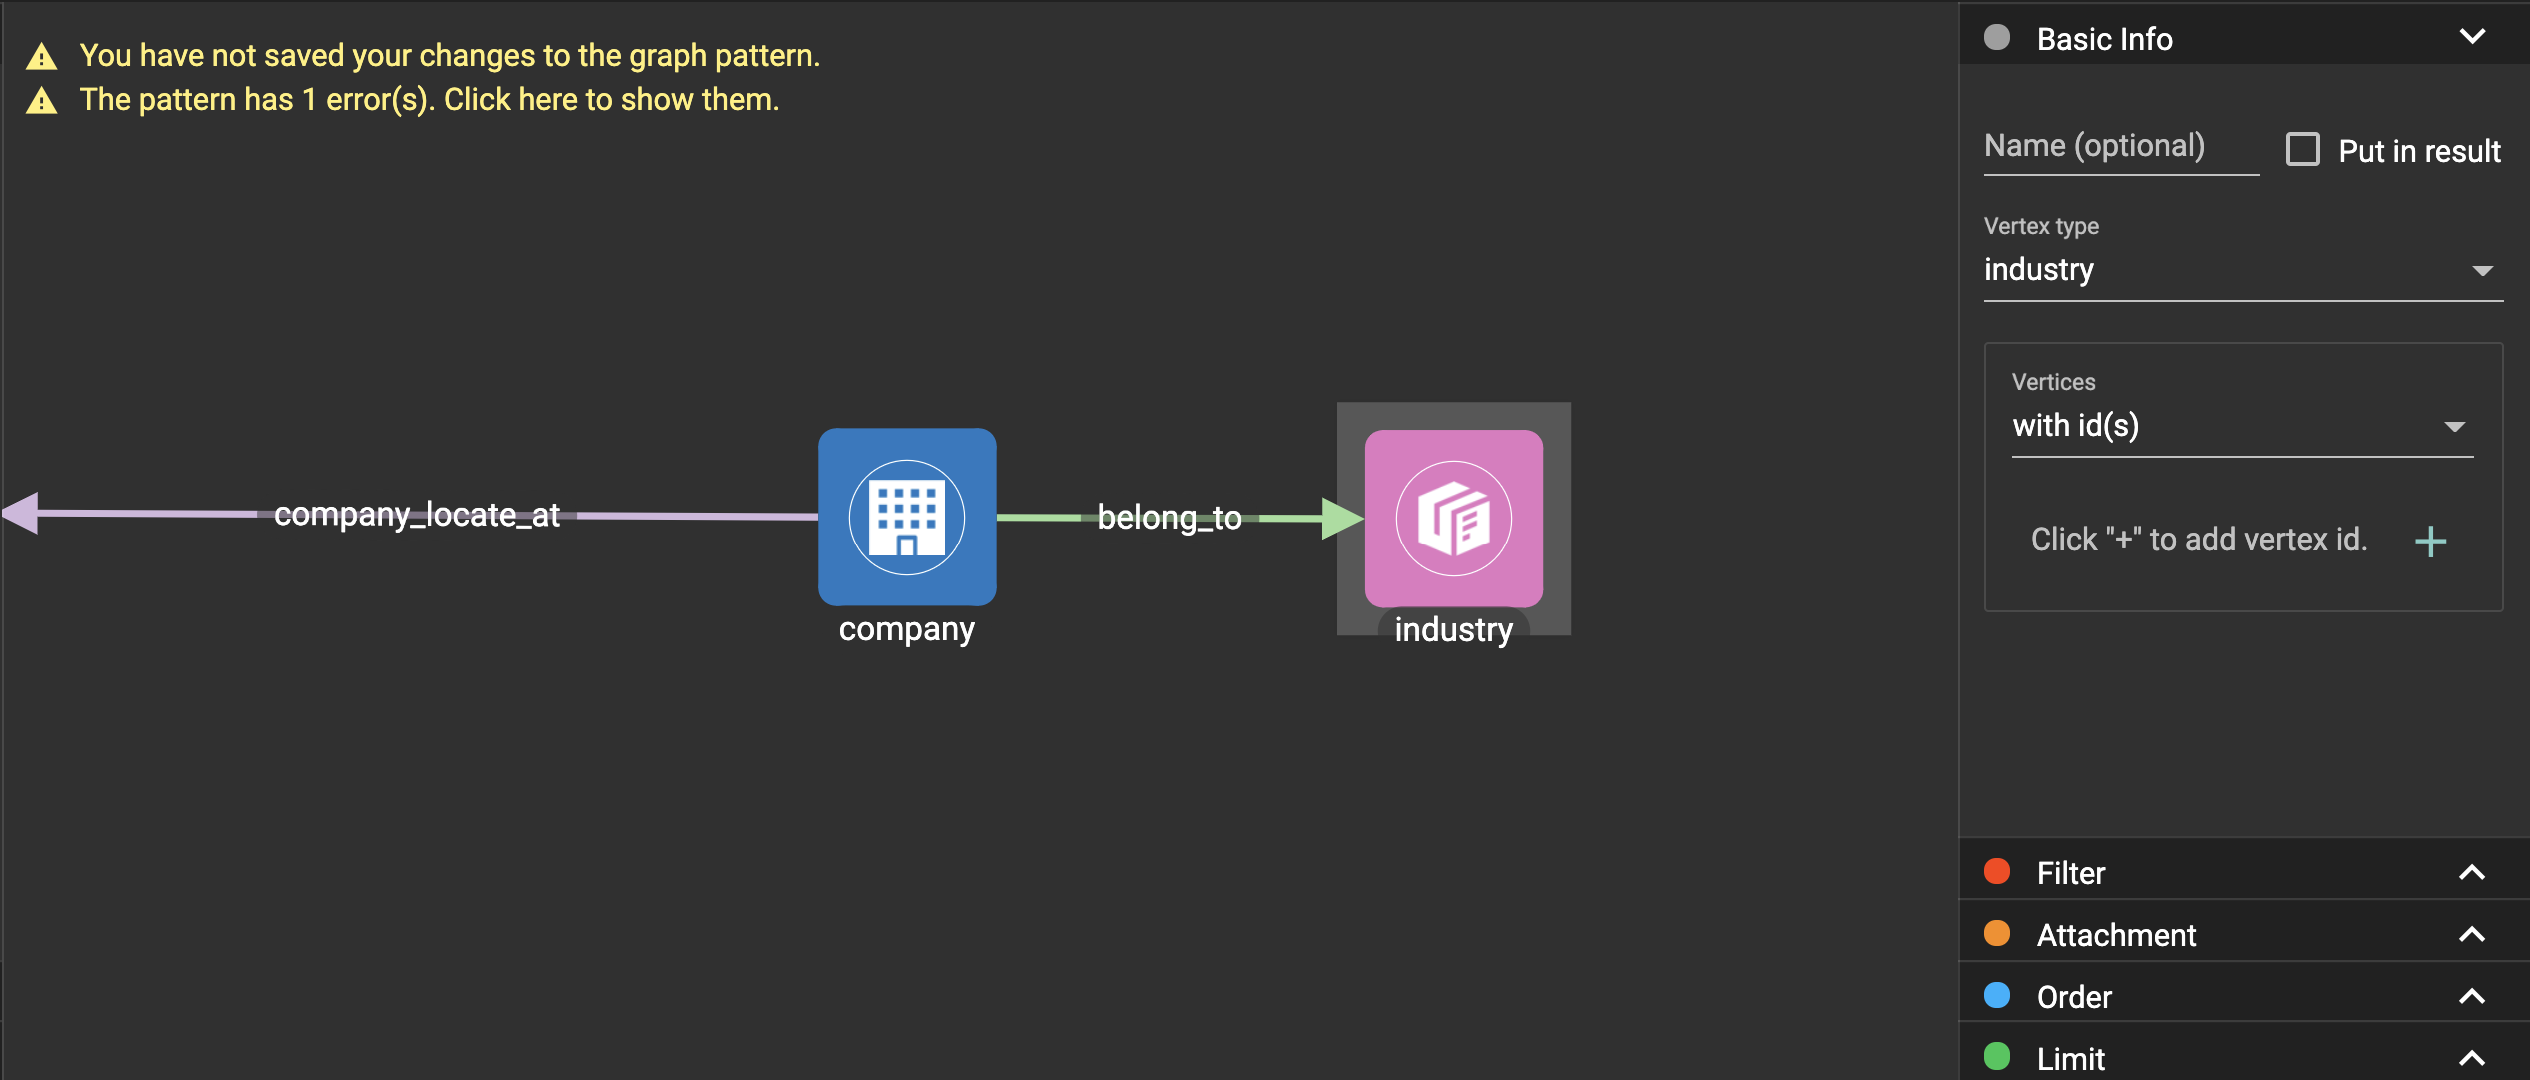
Click the industry vertex pattern, then
click  in the toolbar (or
double click the industry vertex pattern), now you are in edit mode:
in the toolbar (or
double click the industry vertex pattern), now you are in edit mode:
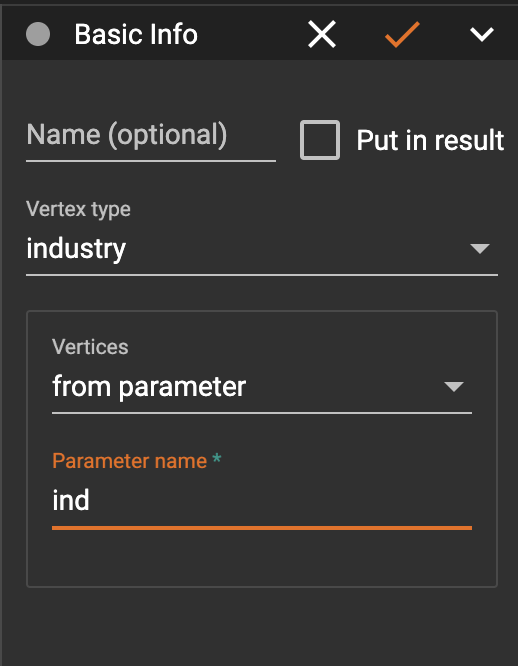
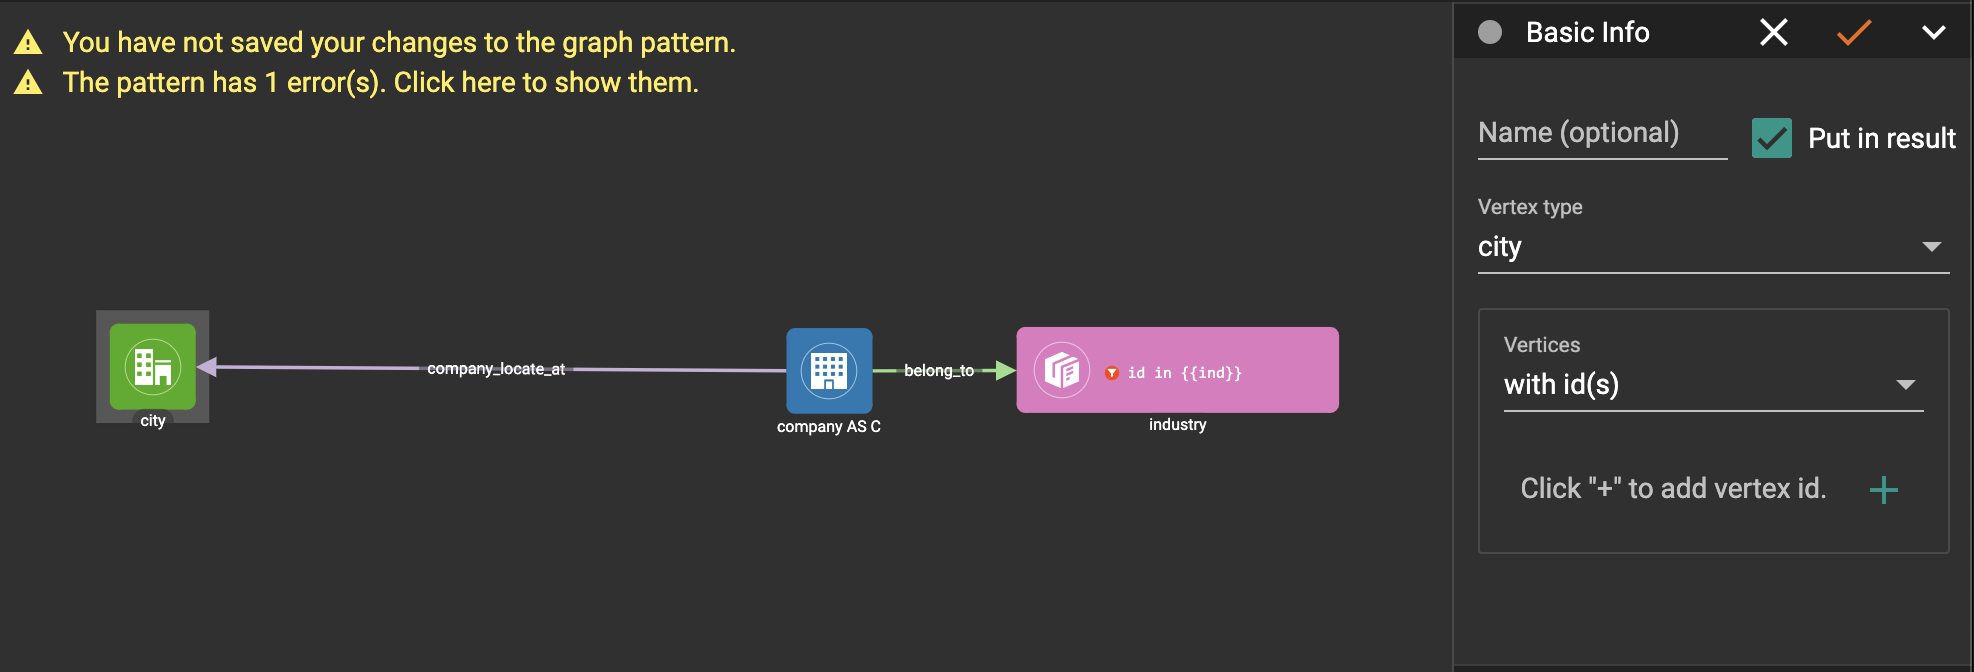
Change the vertices to be from parameter, and give a parameter name ind. This annotates the industry as an input vertex set when running the pattern:
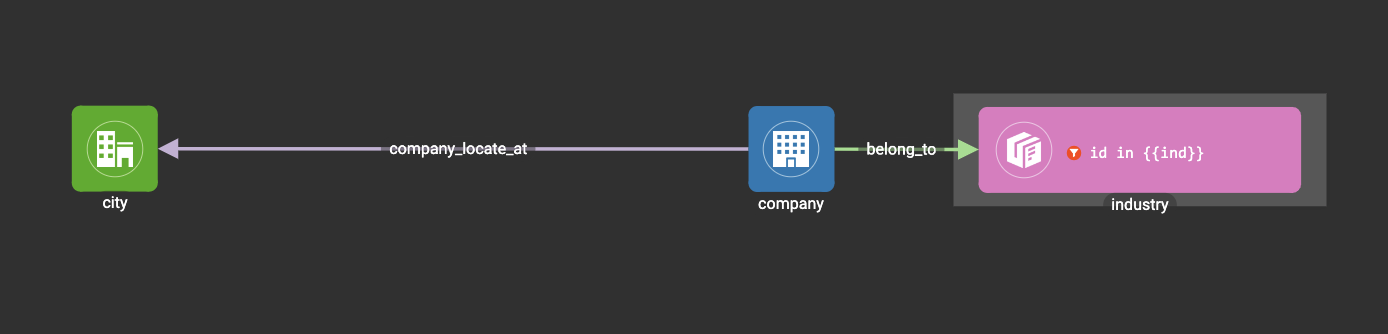
Confirm the change, and notice there is an id condition on the industry vertex pattern:
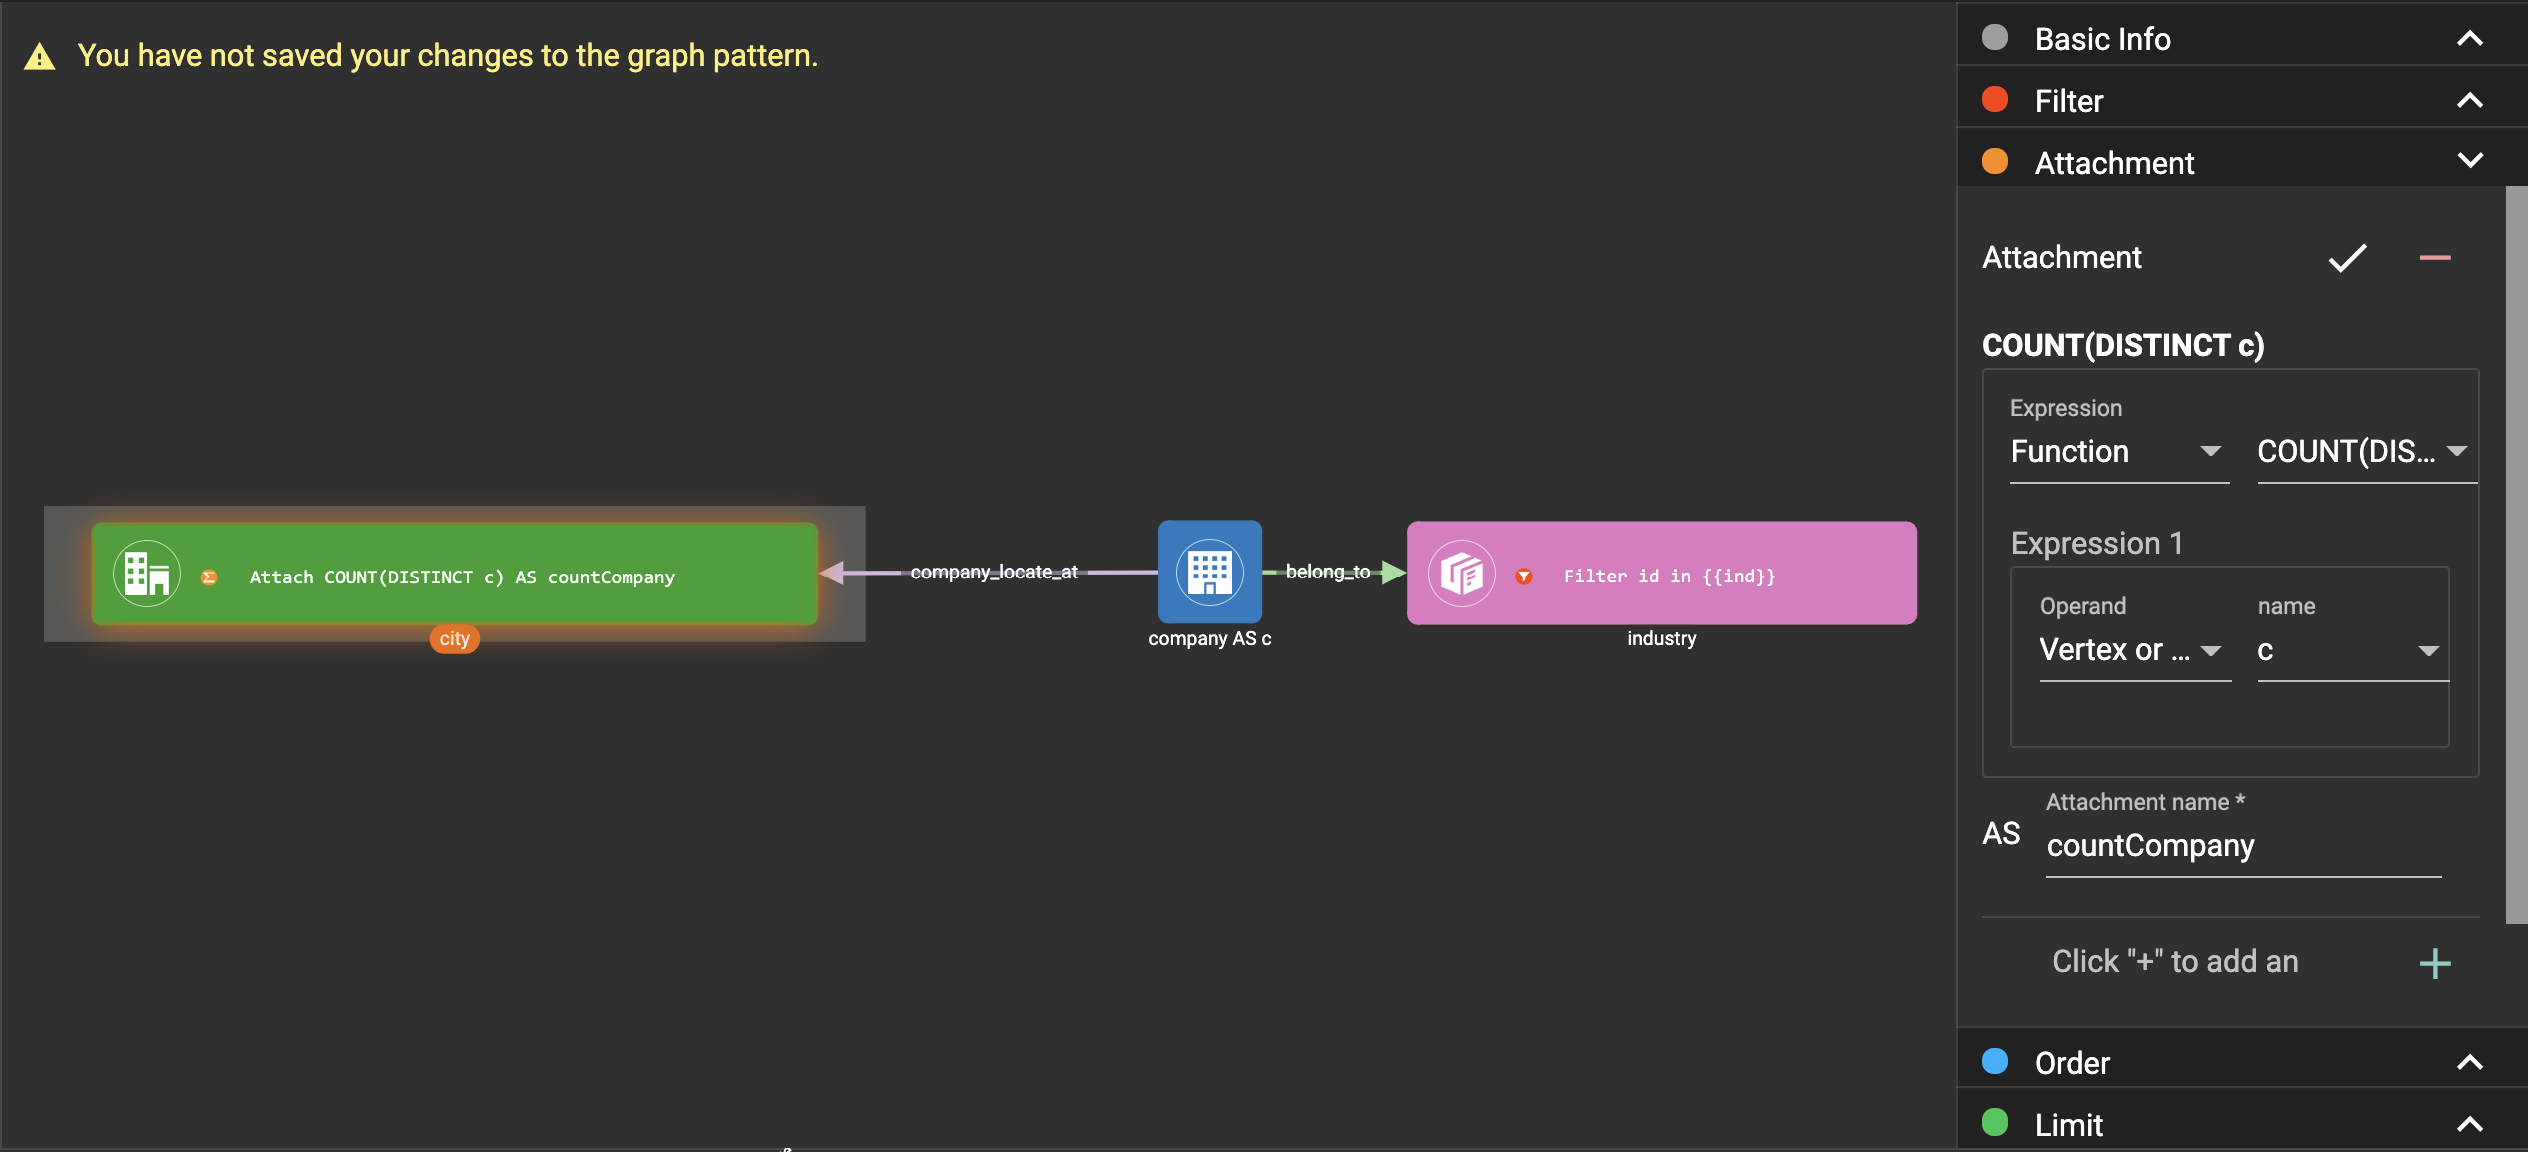
Click the company vertex pattern, then
click in the toolbar, and
change the Name to C:
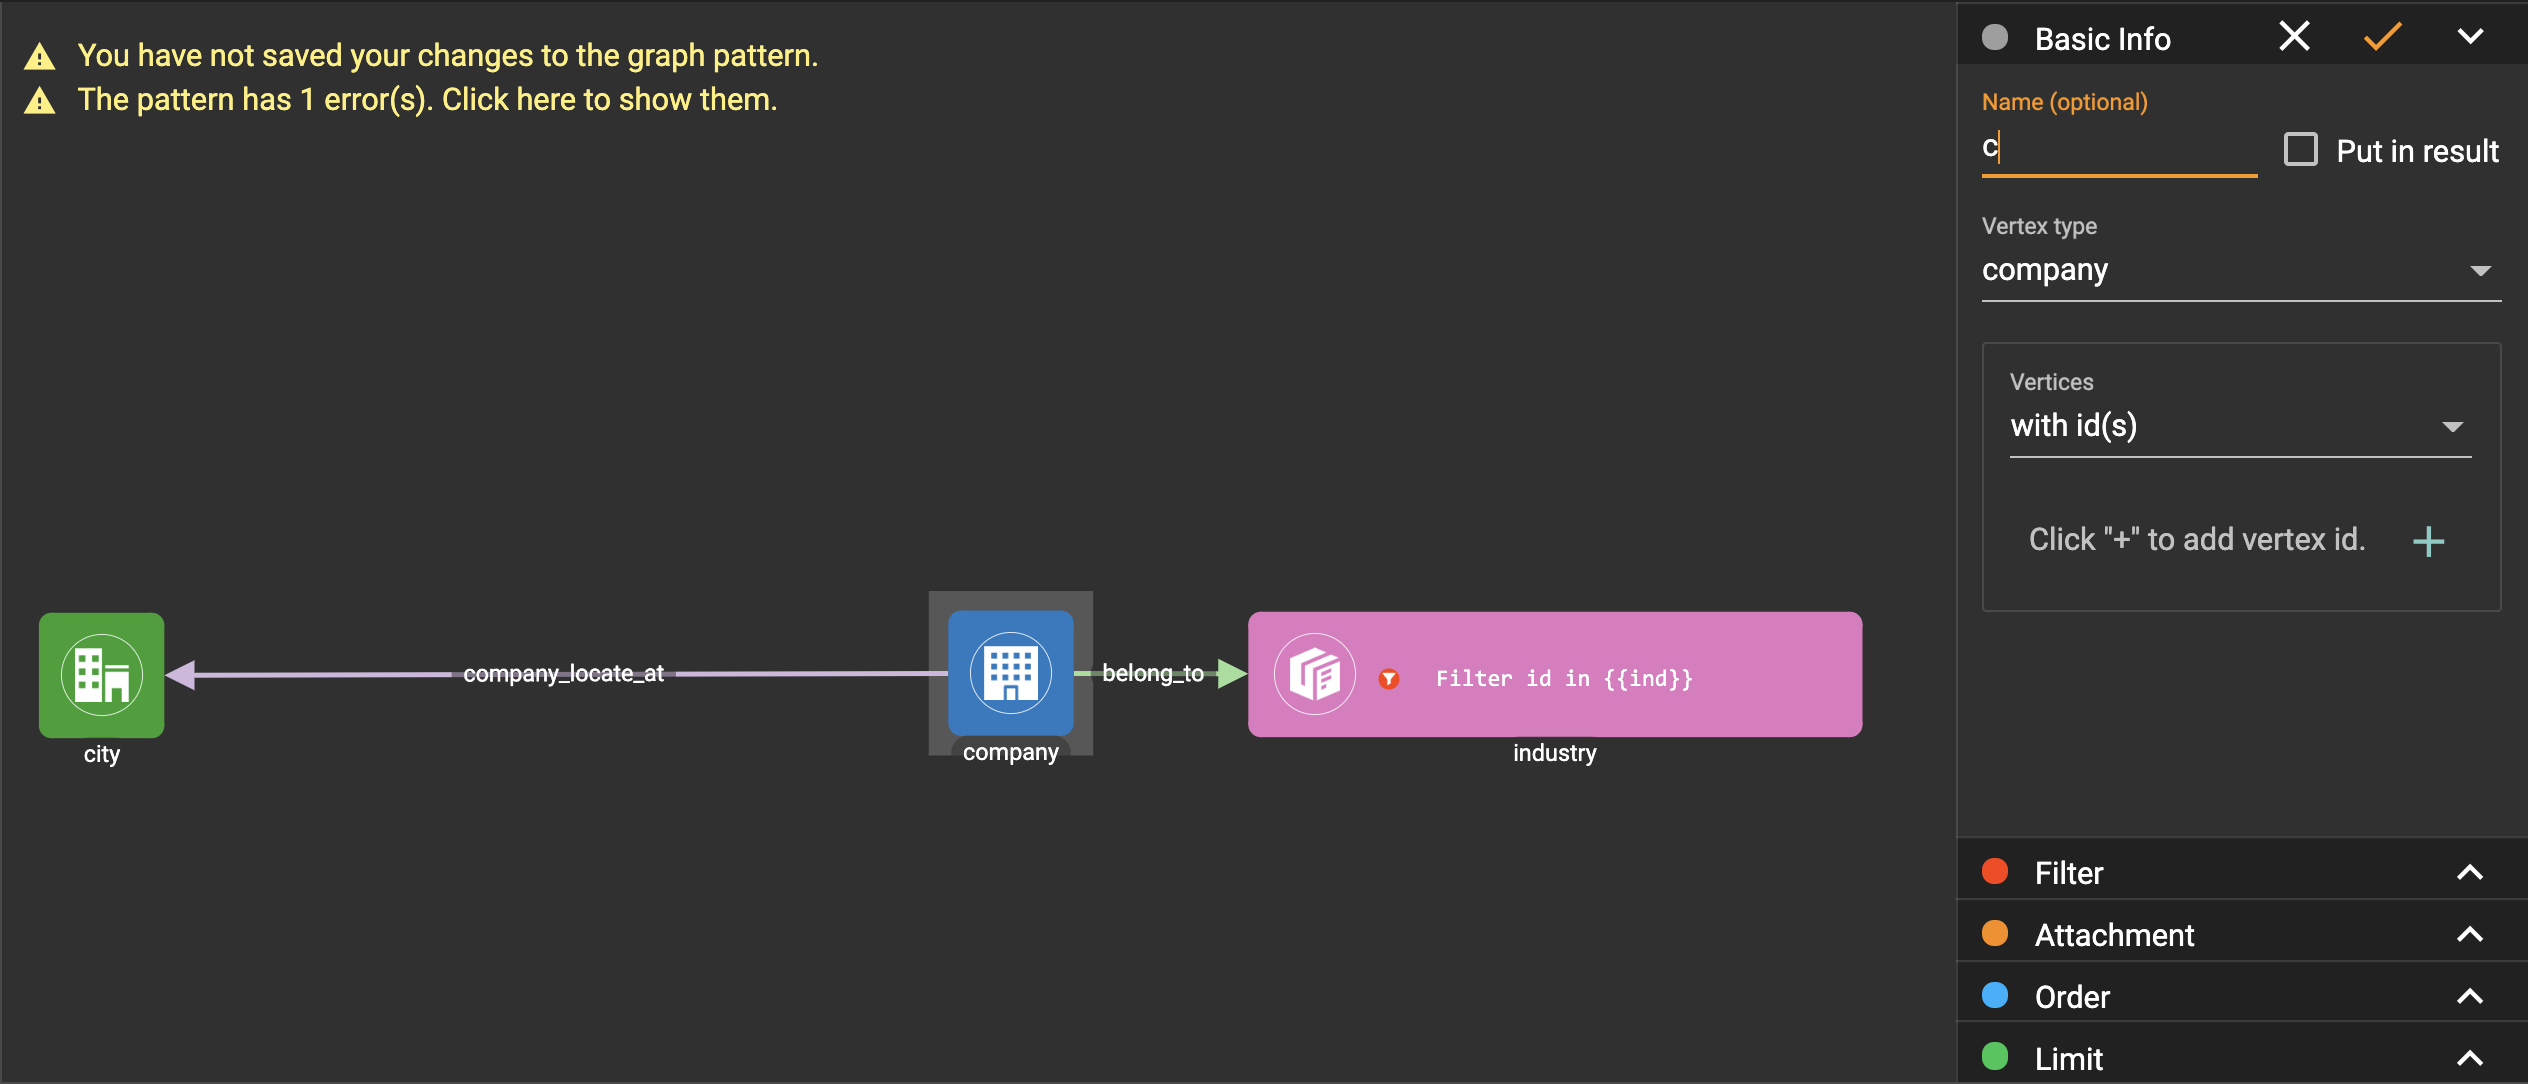
Confirm the change, and the label of company vertex pattern becomes company as C:
Click the city vertex pattern, then
click in the toolbar:
Expand the Aggregation section in the config panel, and add an aggregation:
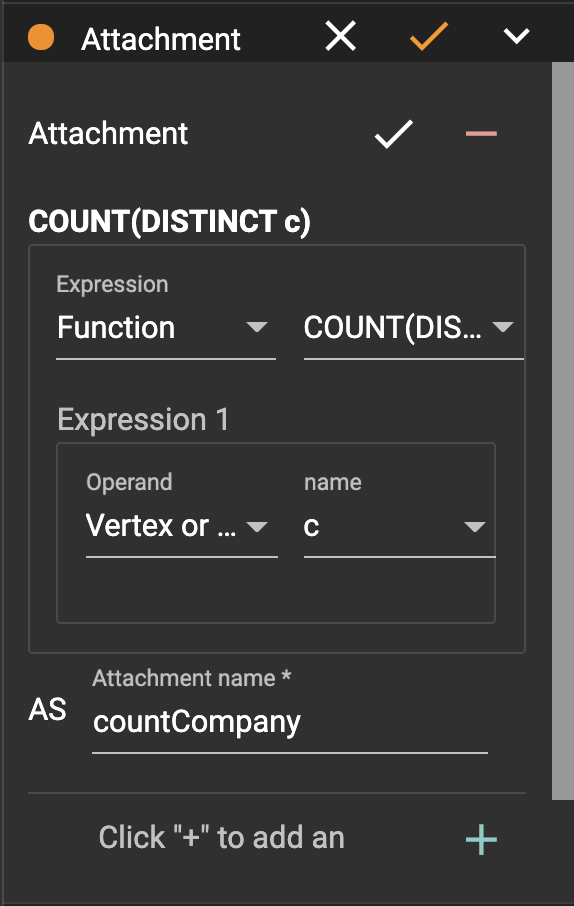
Confirm the change:
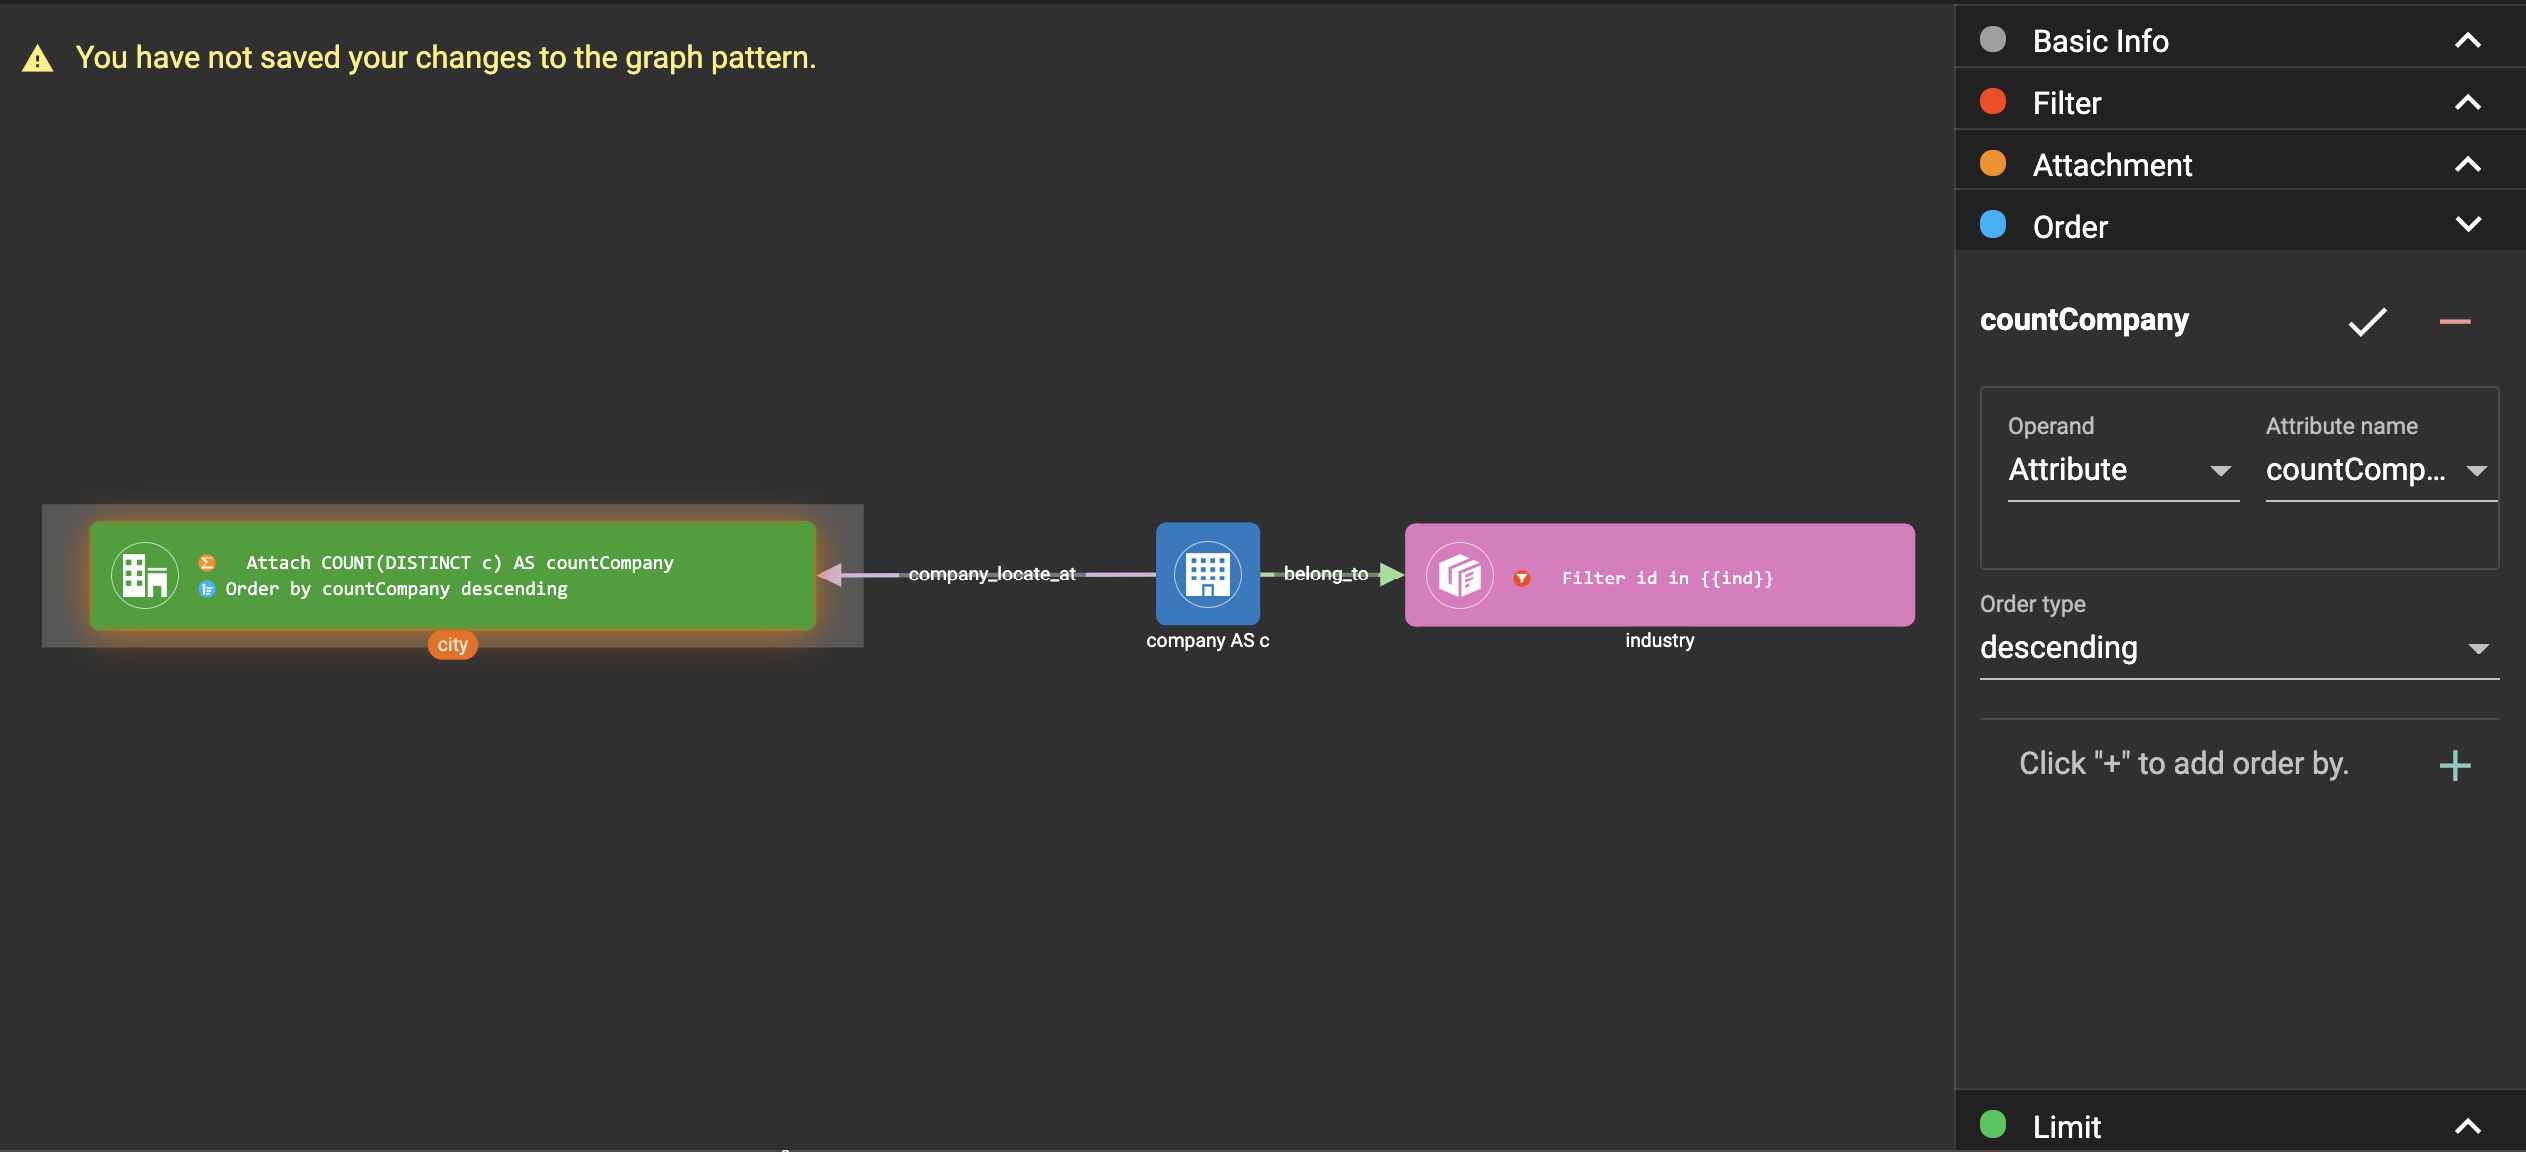
Expand the Order section in the config panel, and add a descending order of aggregation result countCompany:
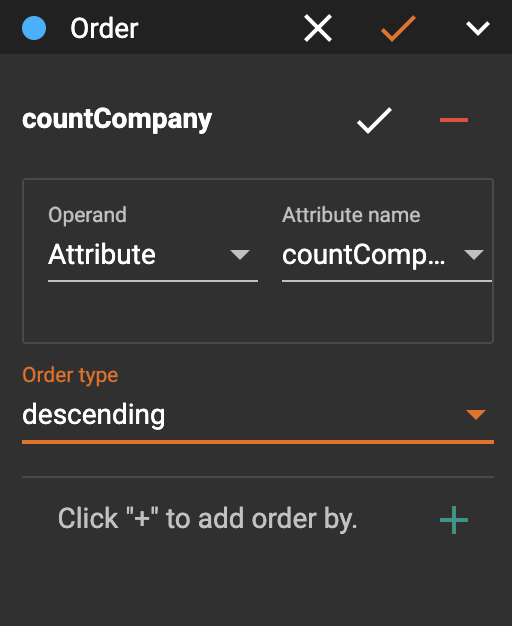
Confirm the change:
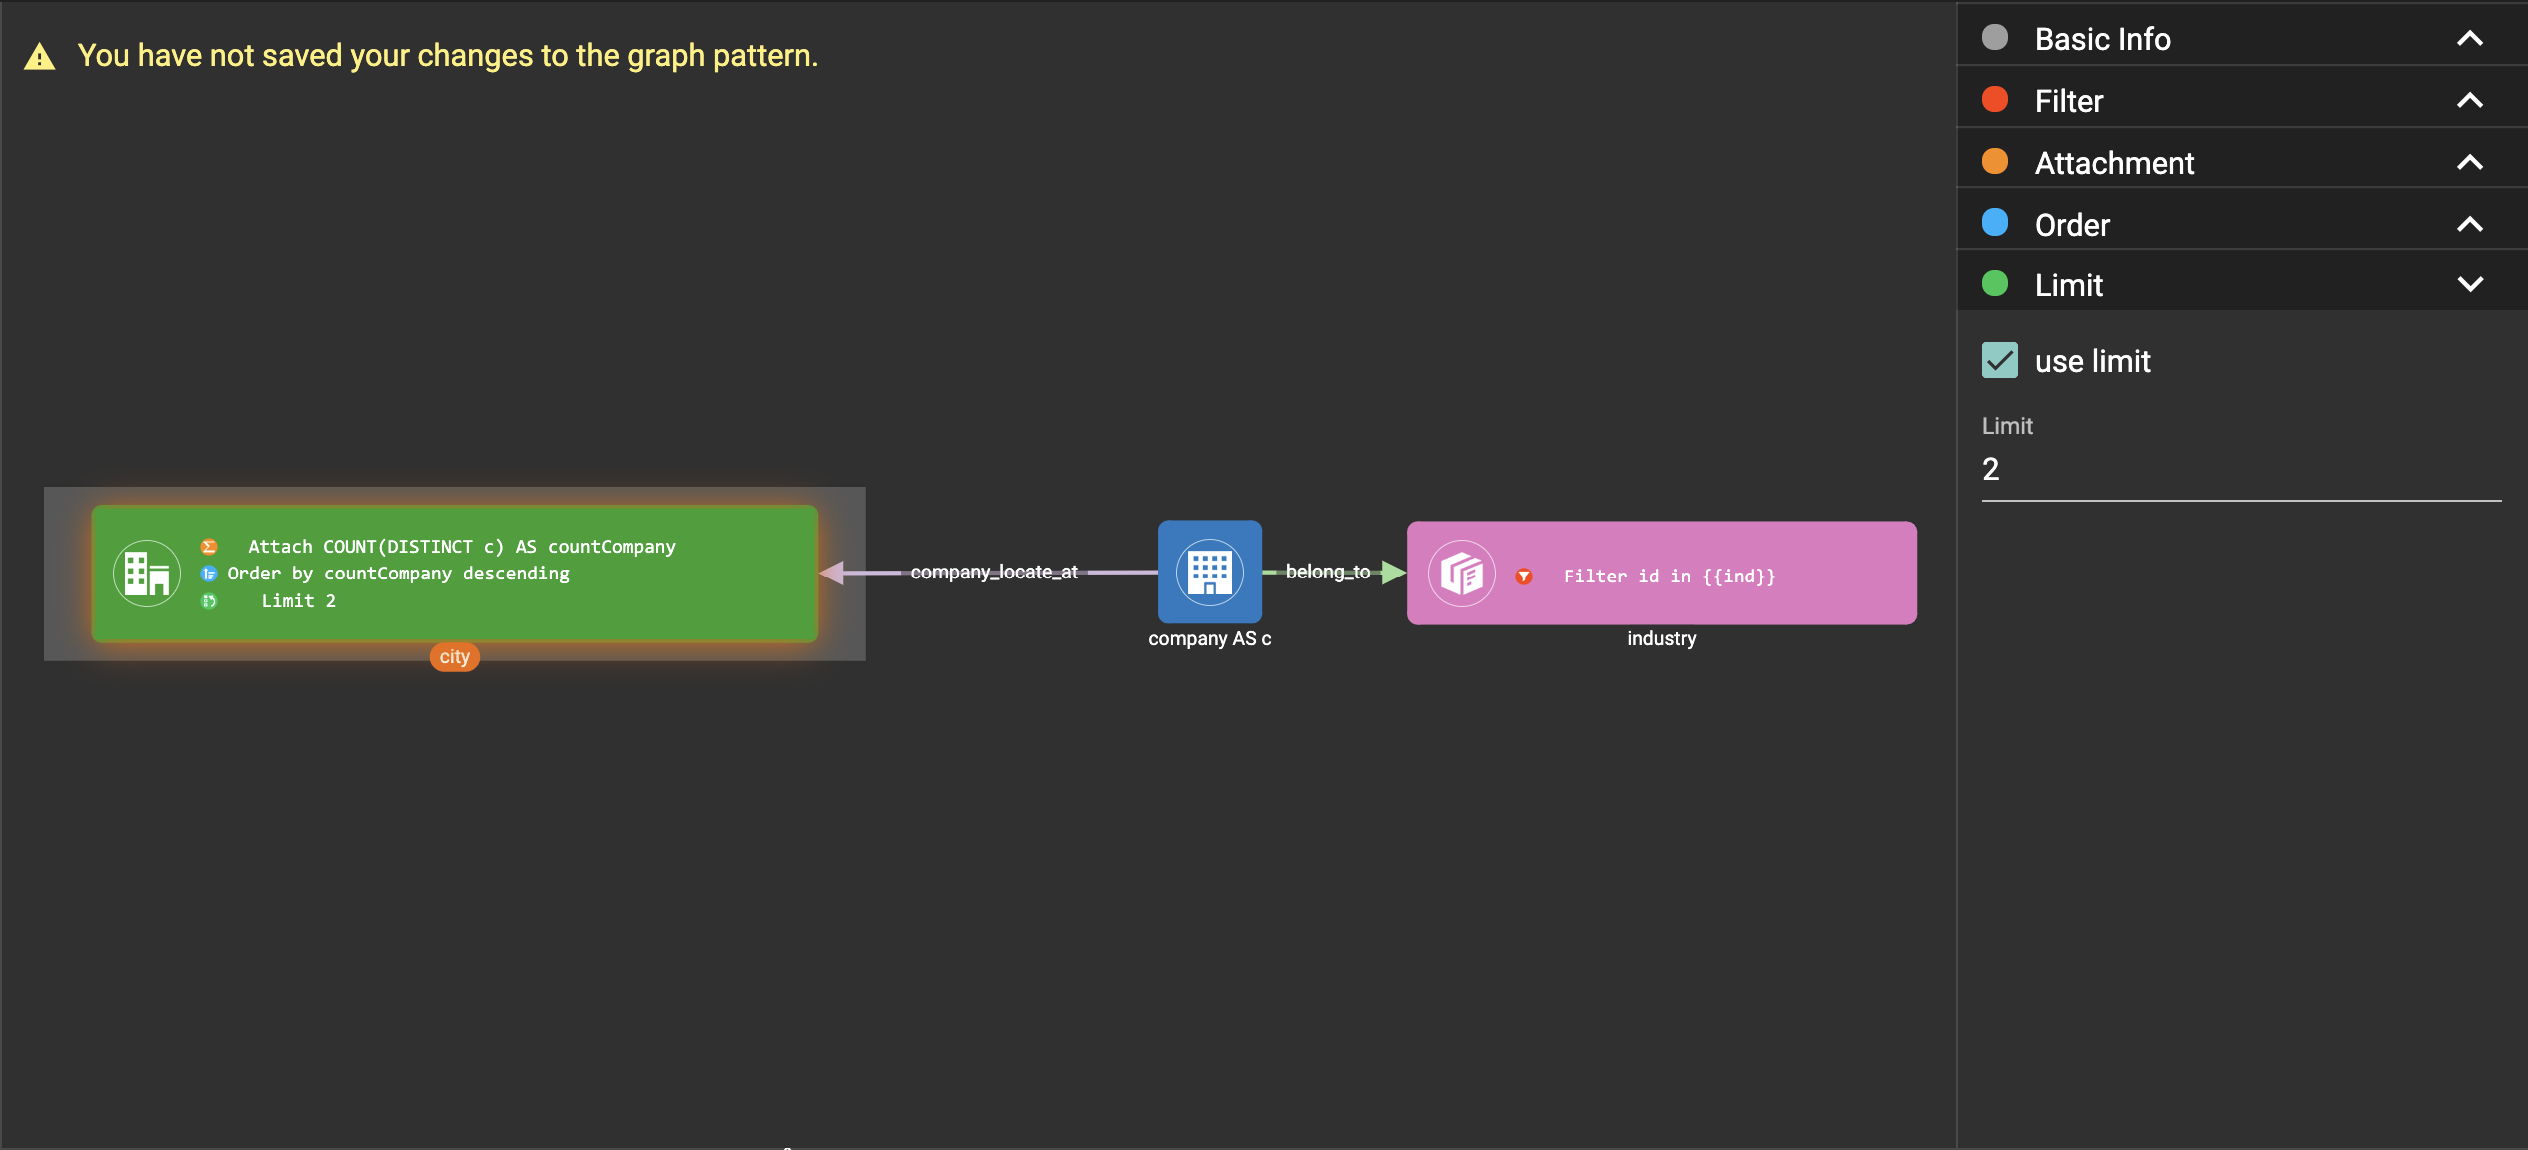
Expand the Limit section in the config panel, check the use limit checkbox, and change limit to 2:
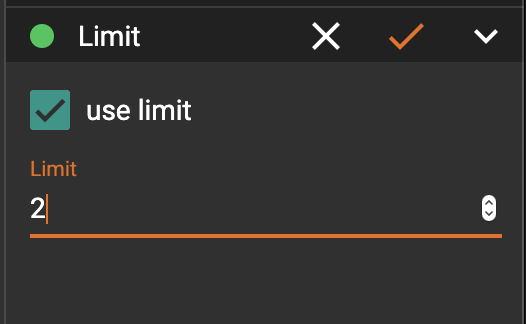
Confirm the change:
Click , then click
the city vertex pattern, then
click again to exit
output toggle mode,
click to save the
pattern:
Click . Because
the pattern has one input parameter ind, the Pattern parameters
section in the pattern list panel expands:
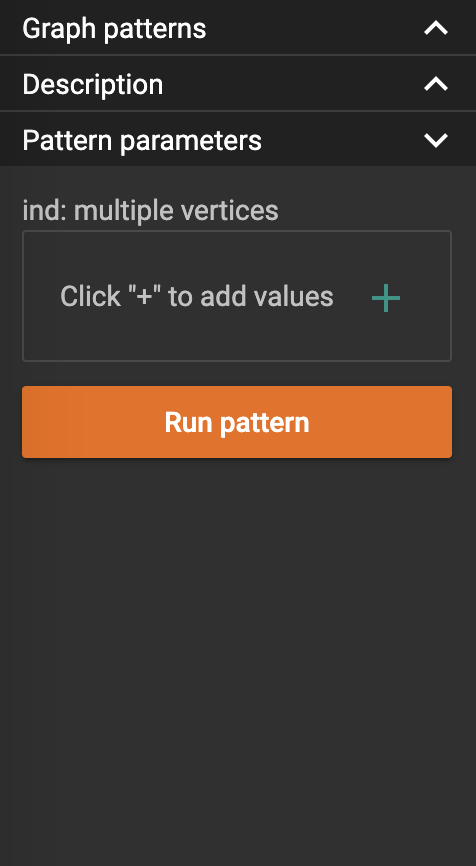
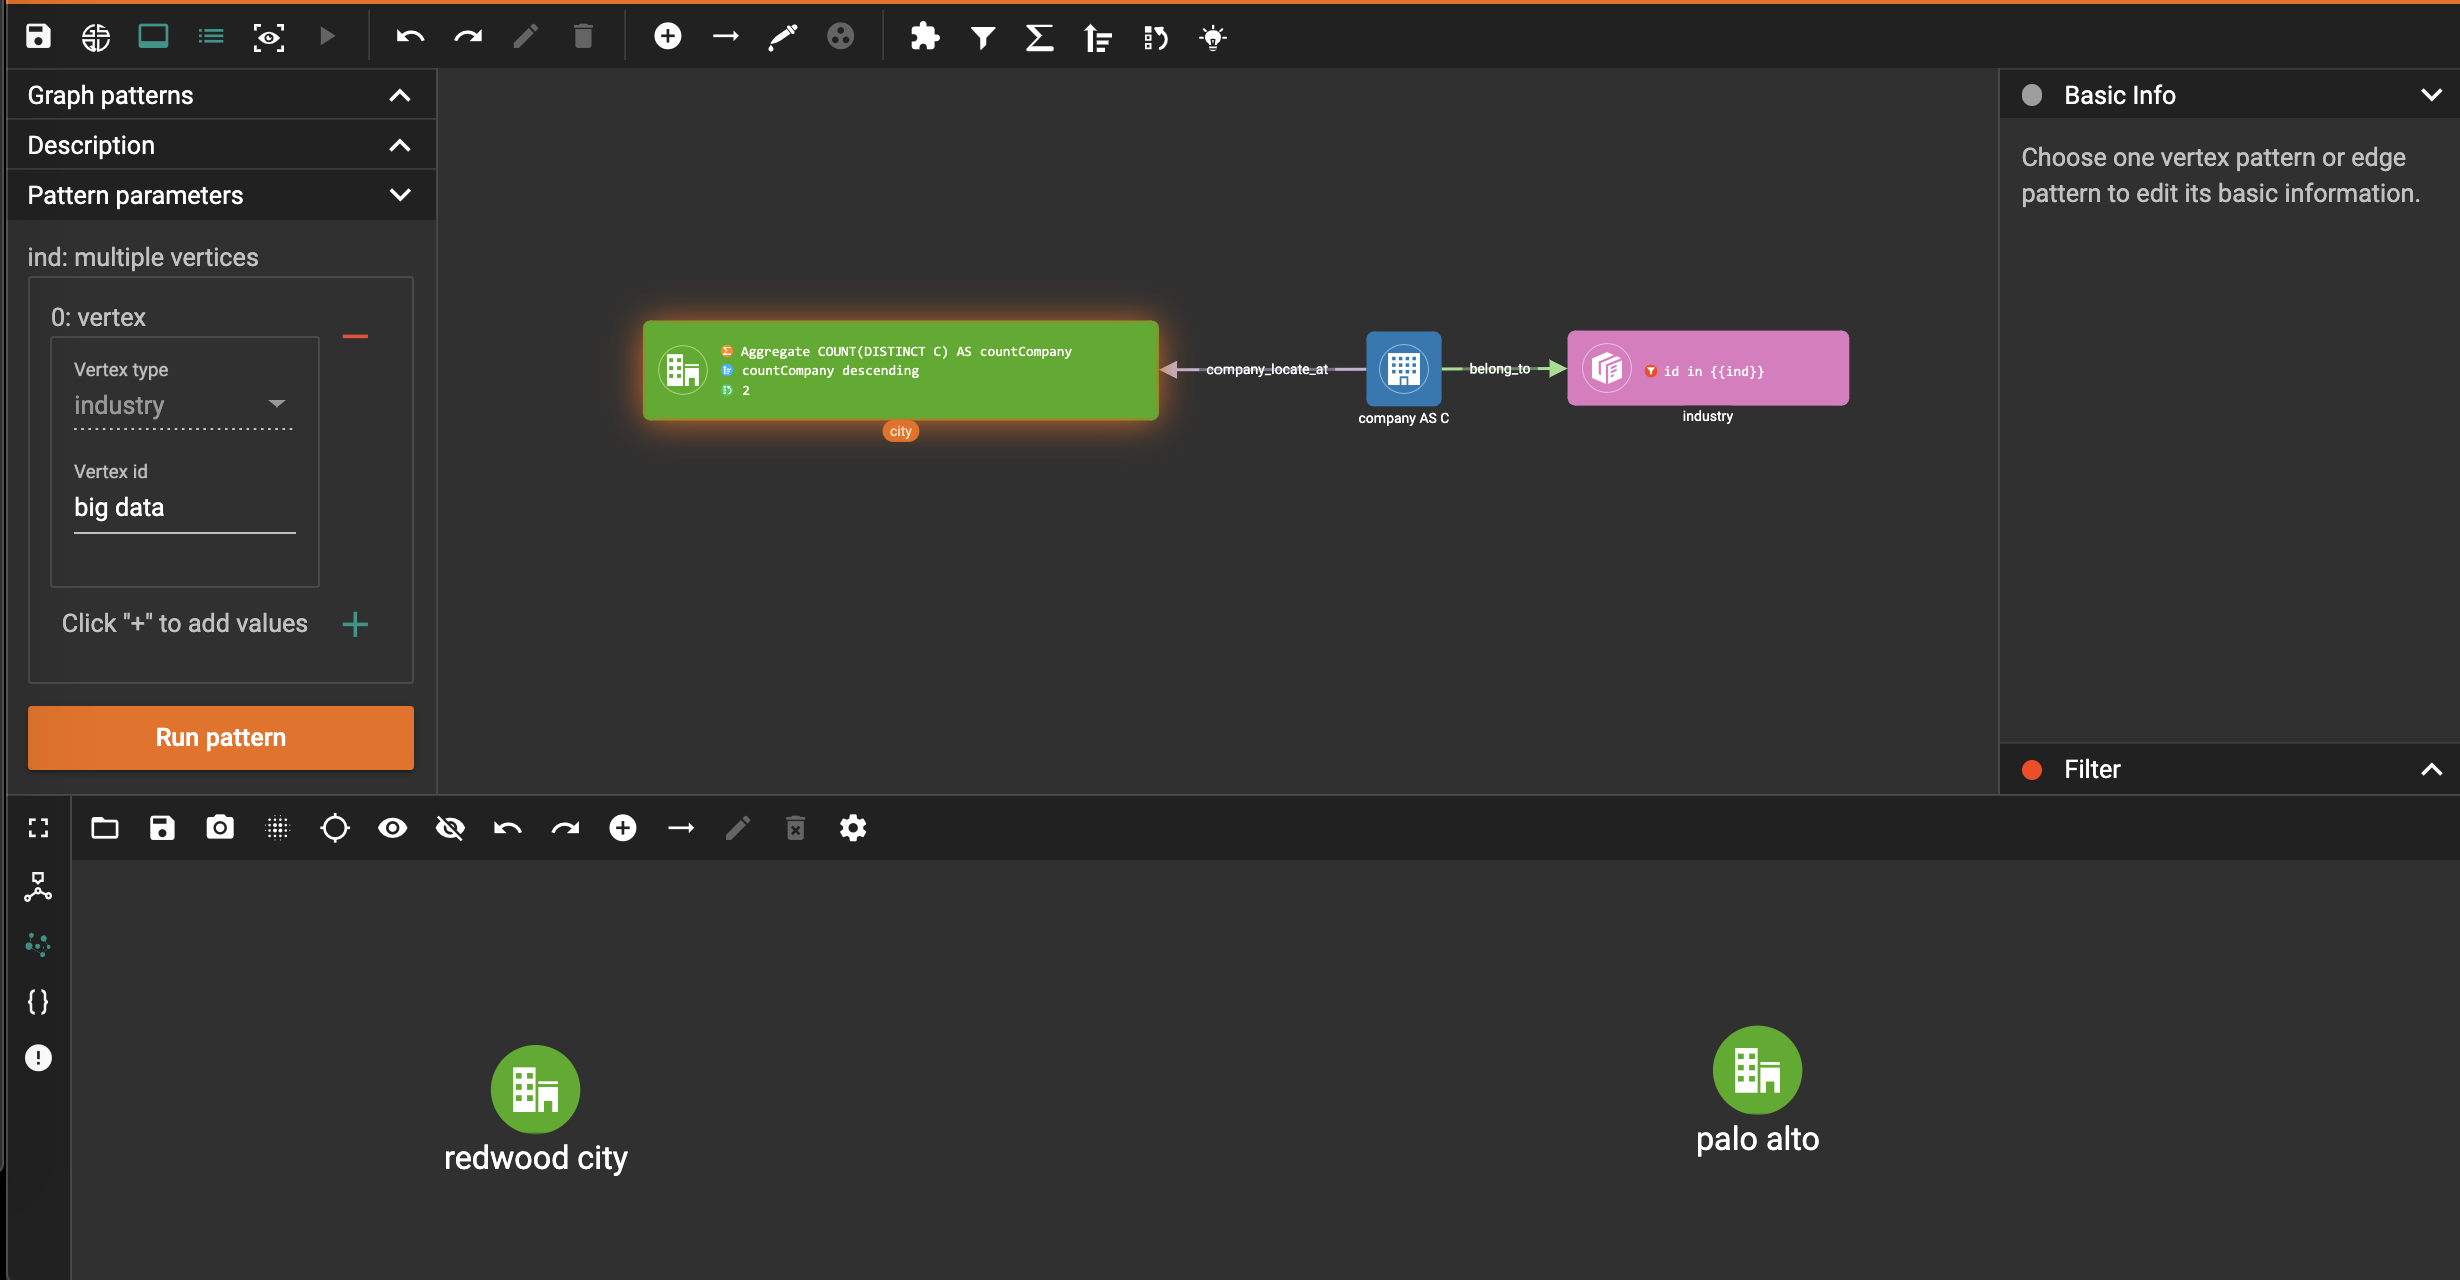
Click to add one
industry vertex, and input "big data" for vertex id, then click
 :
:
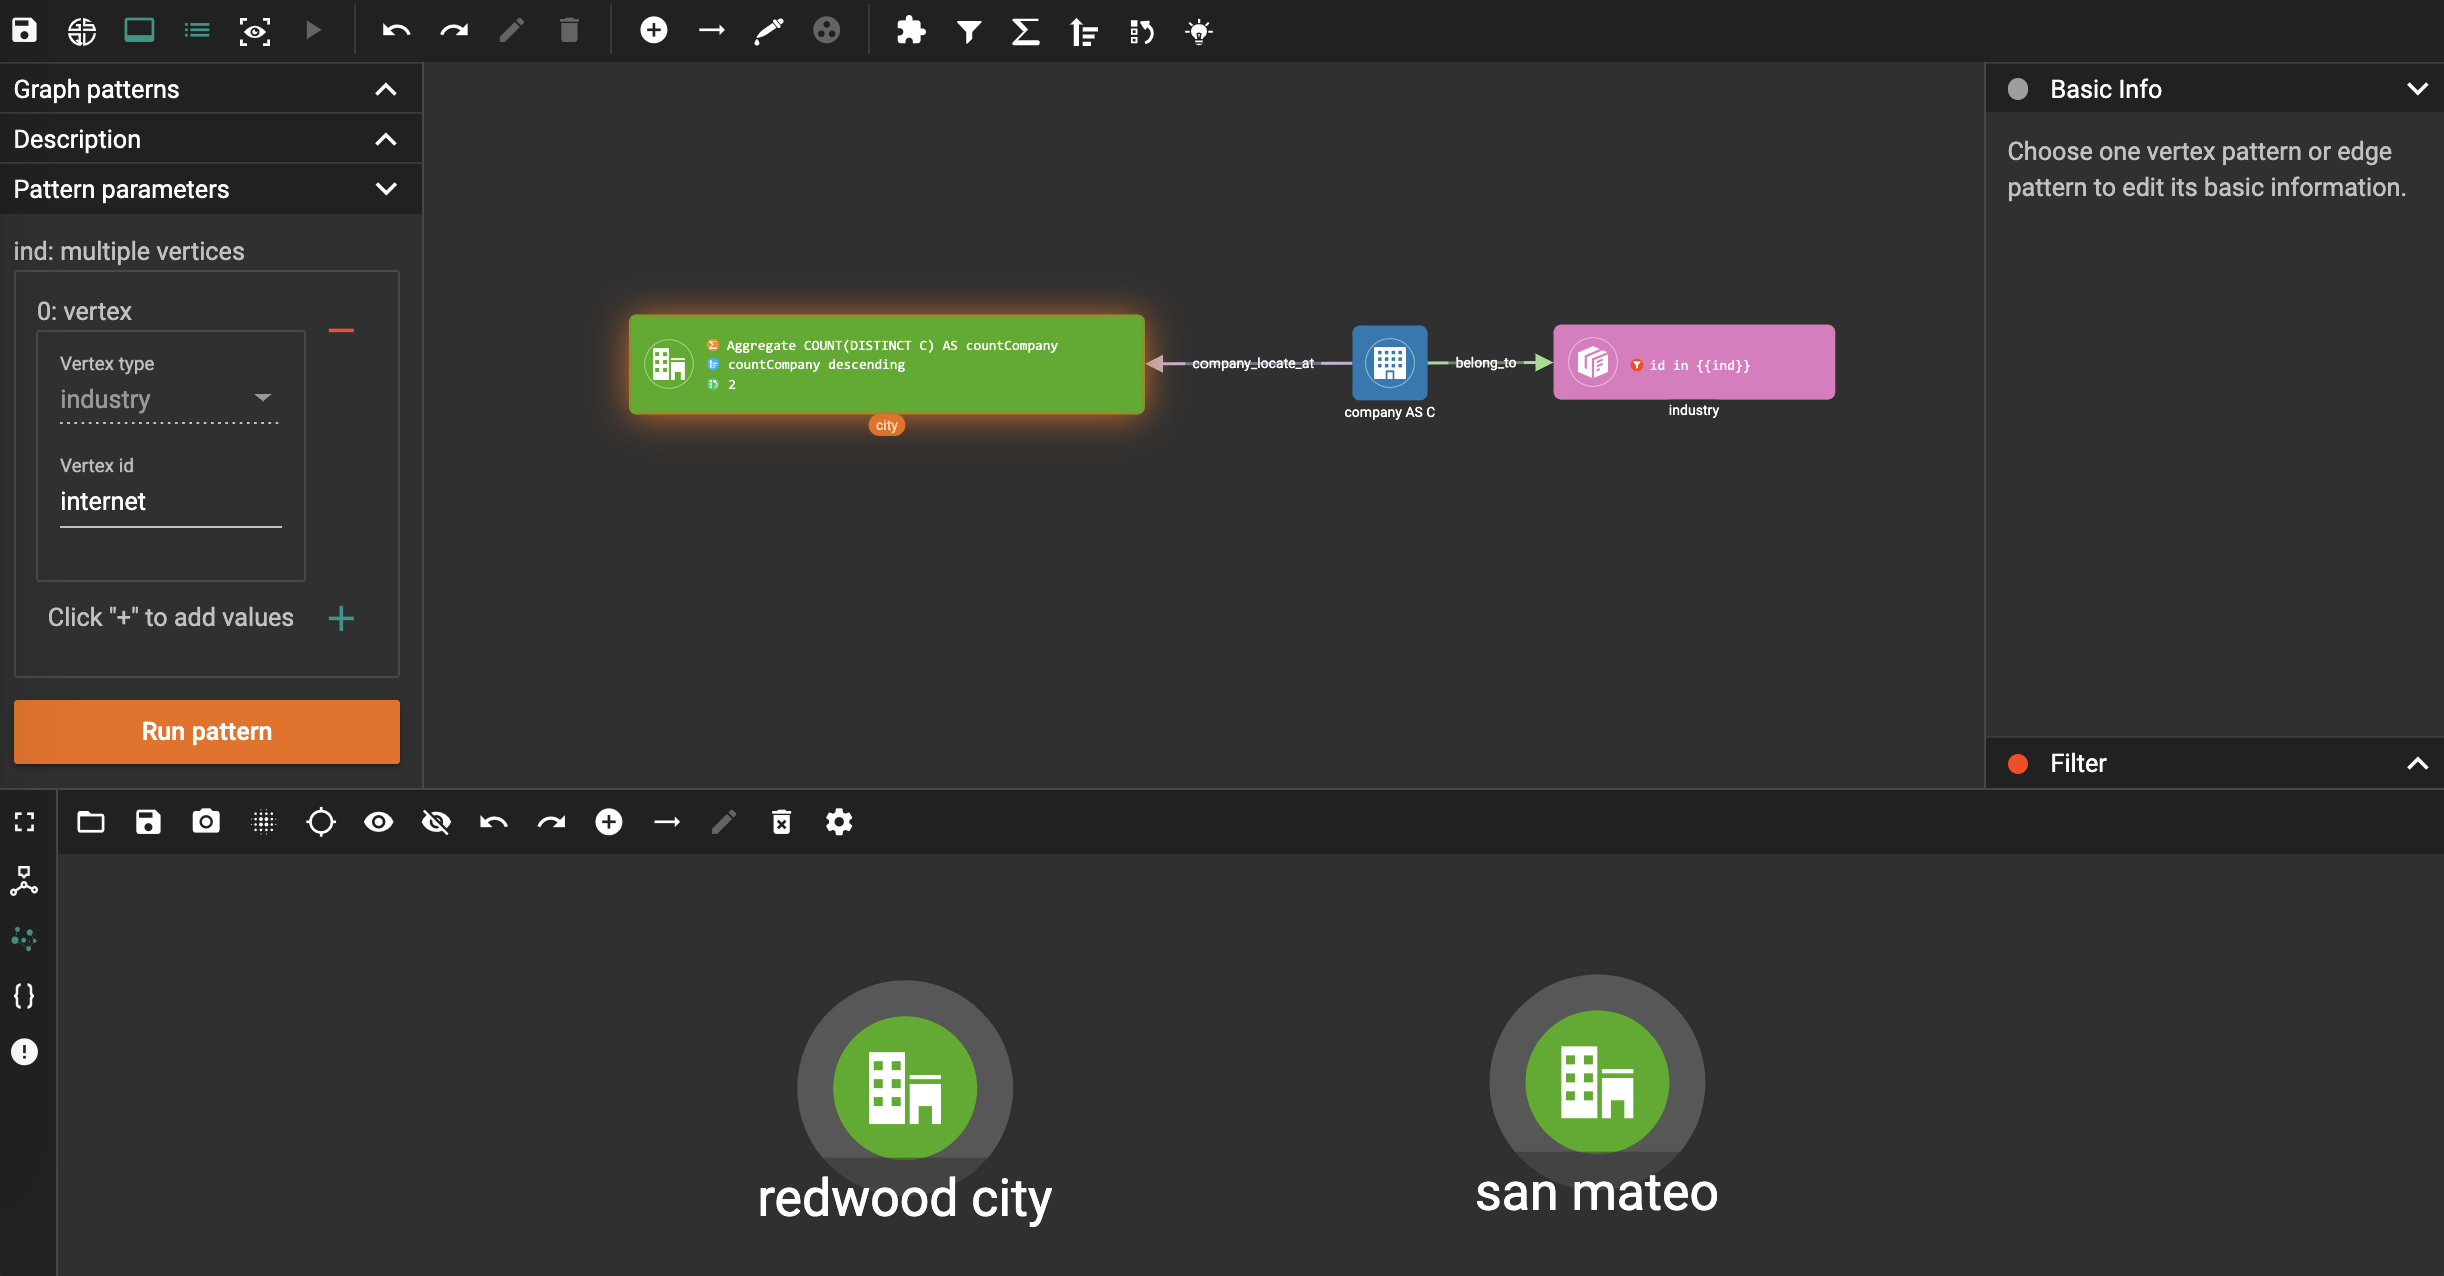
Change the industry vertex id to be "internet", and run the pattern again:
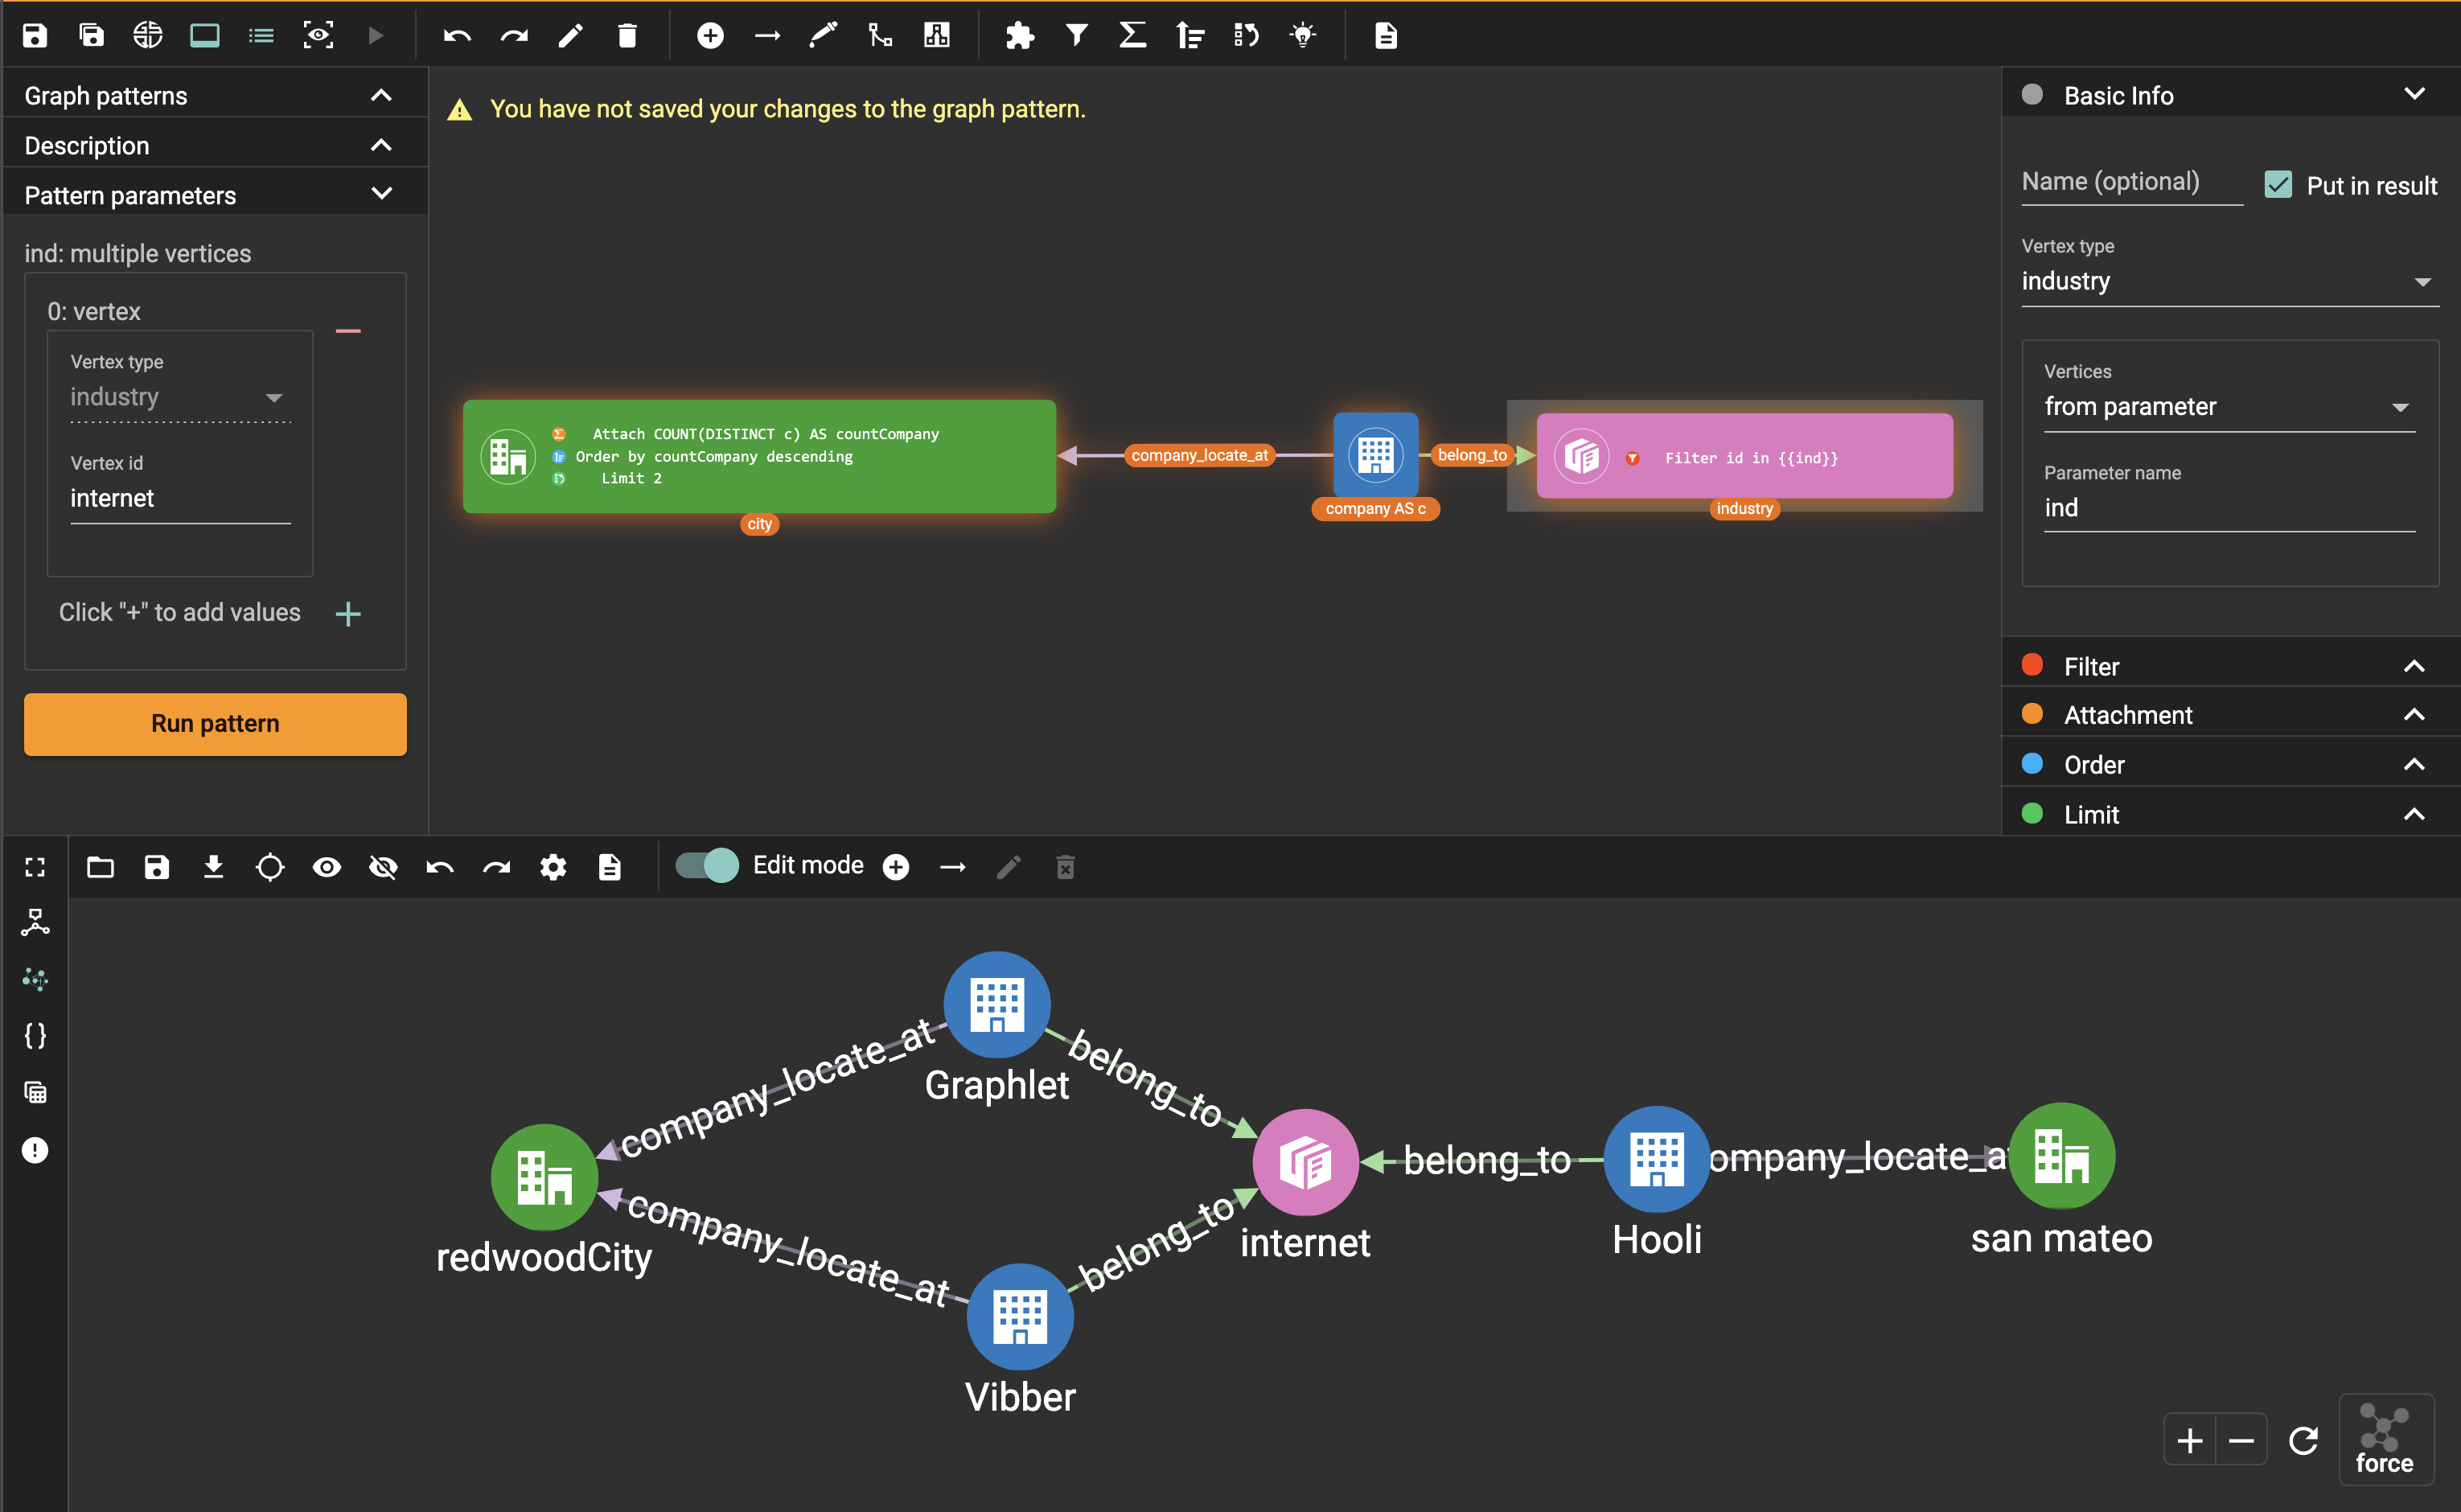
Again, you can choose to output everything in the matched subgraphs:
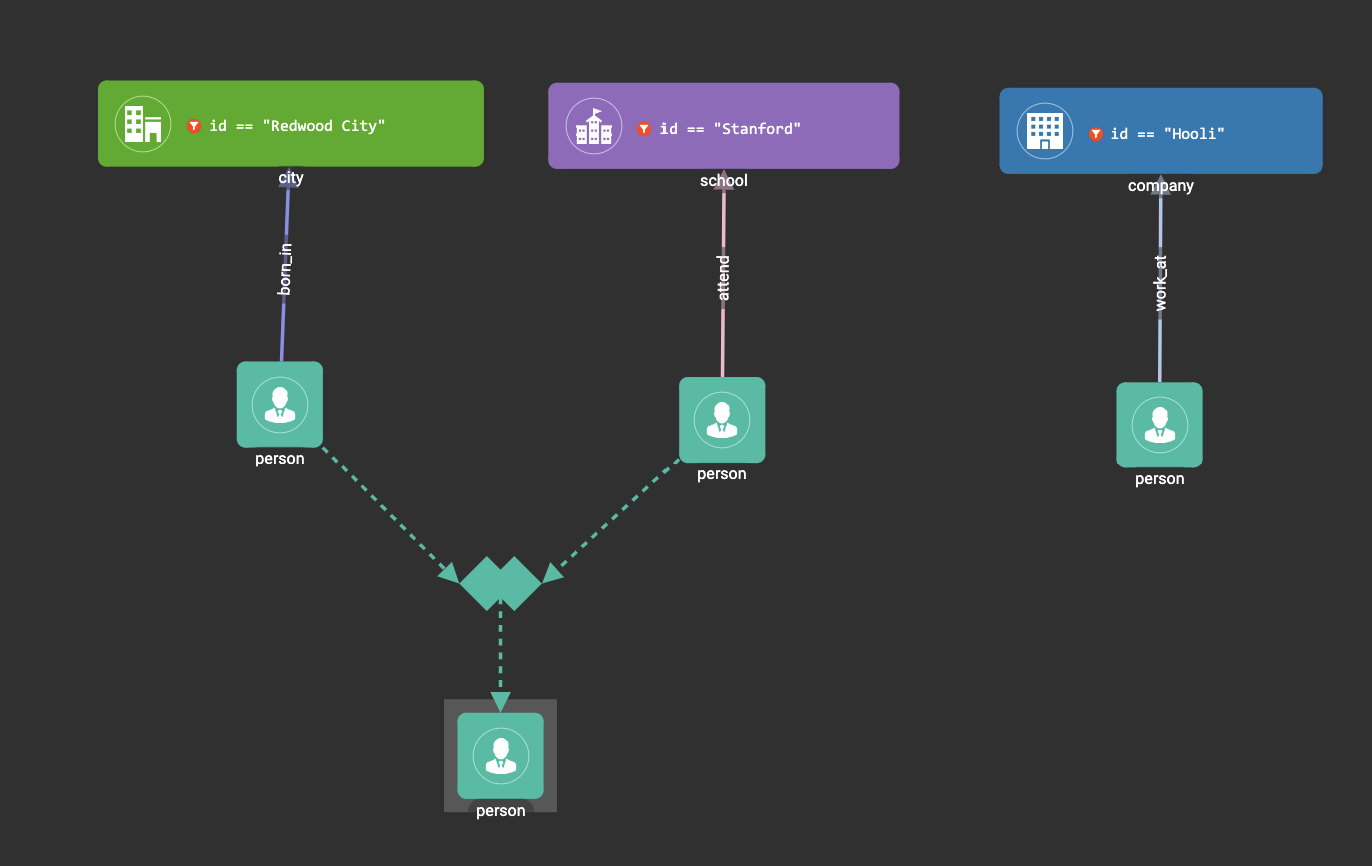
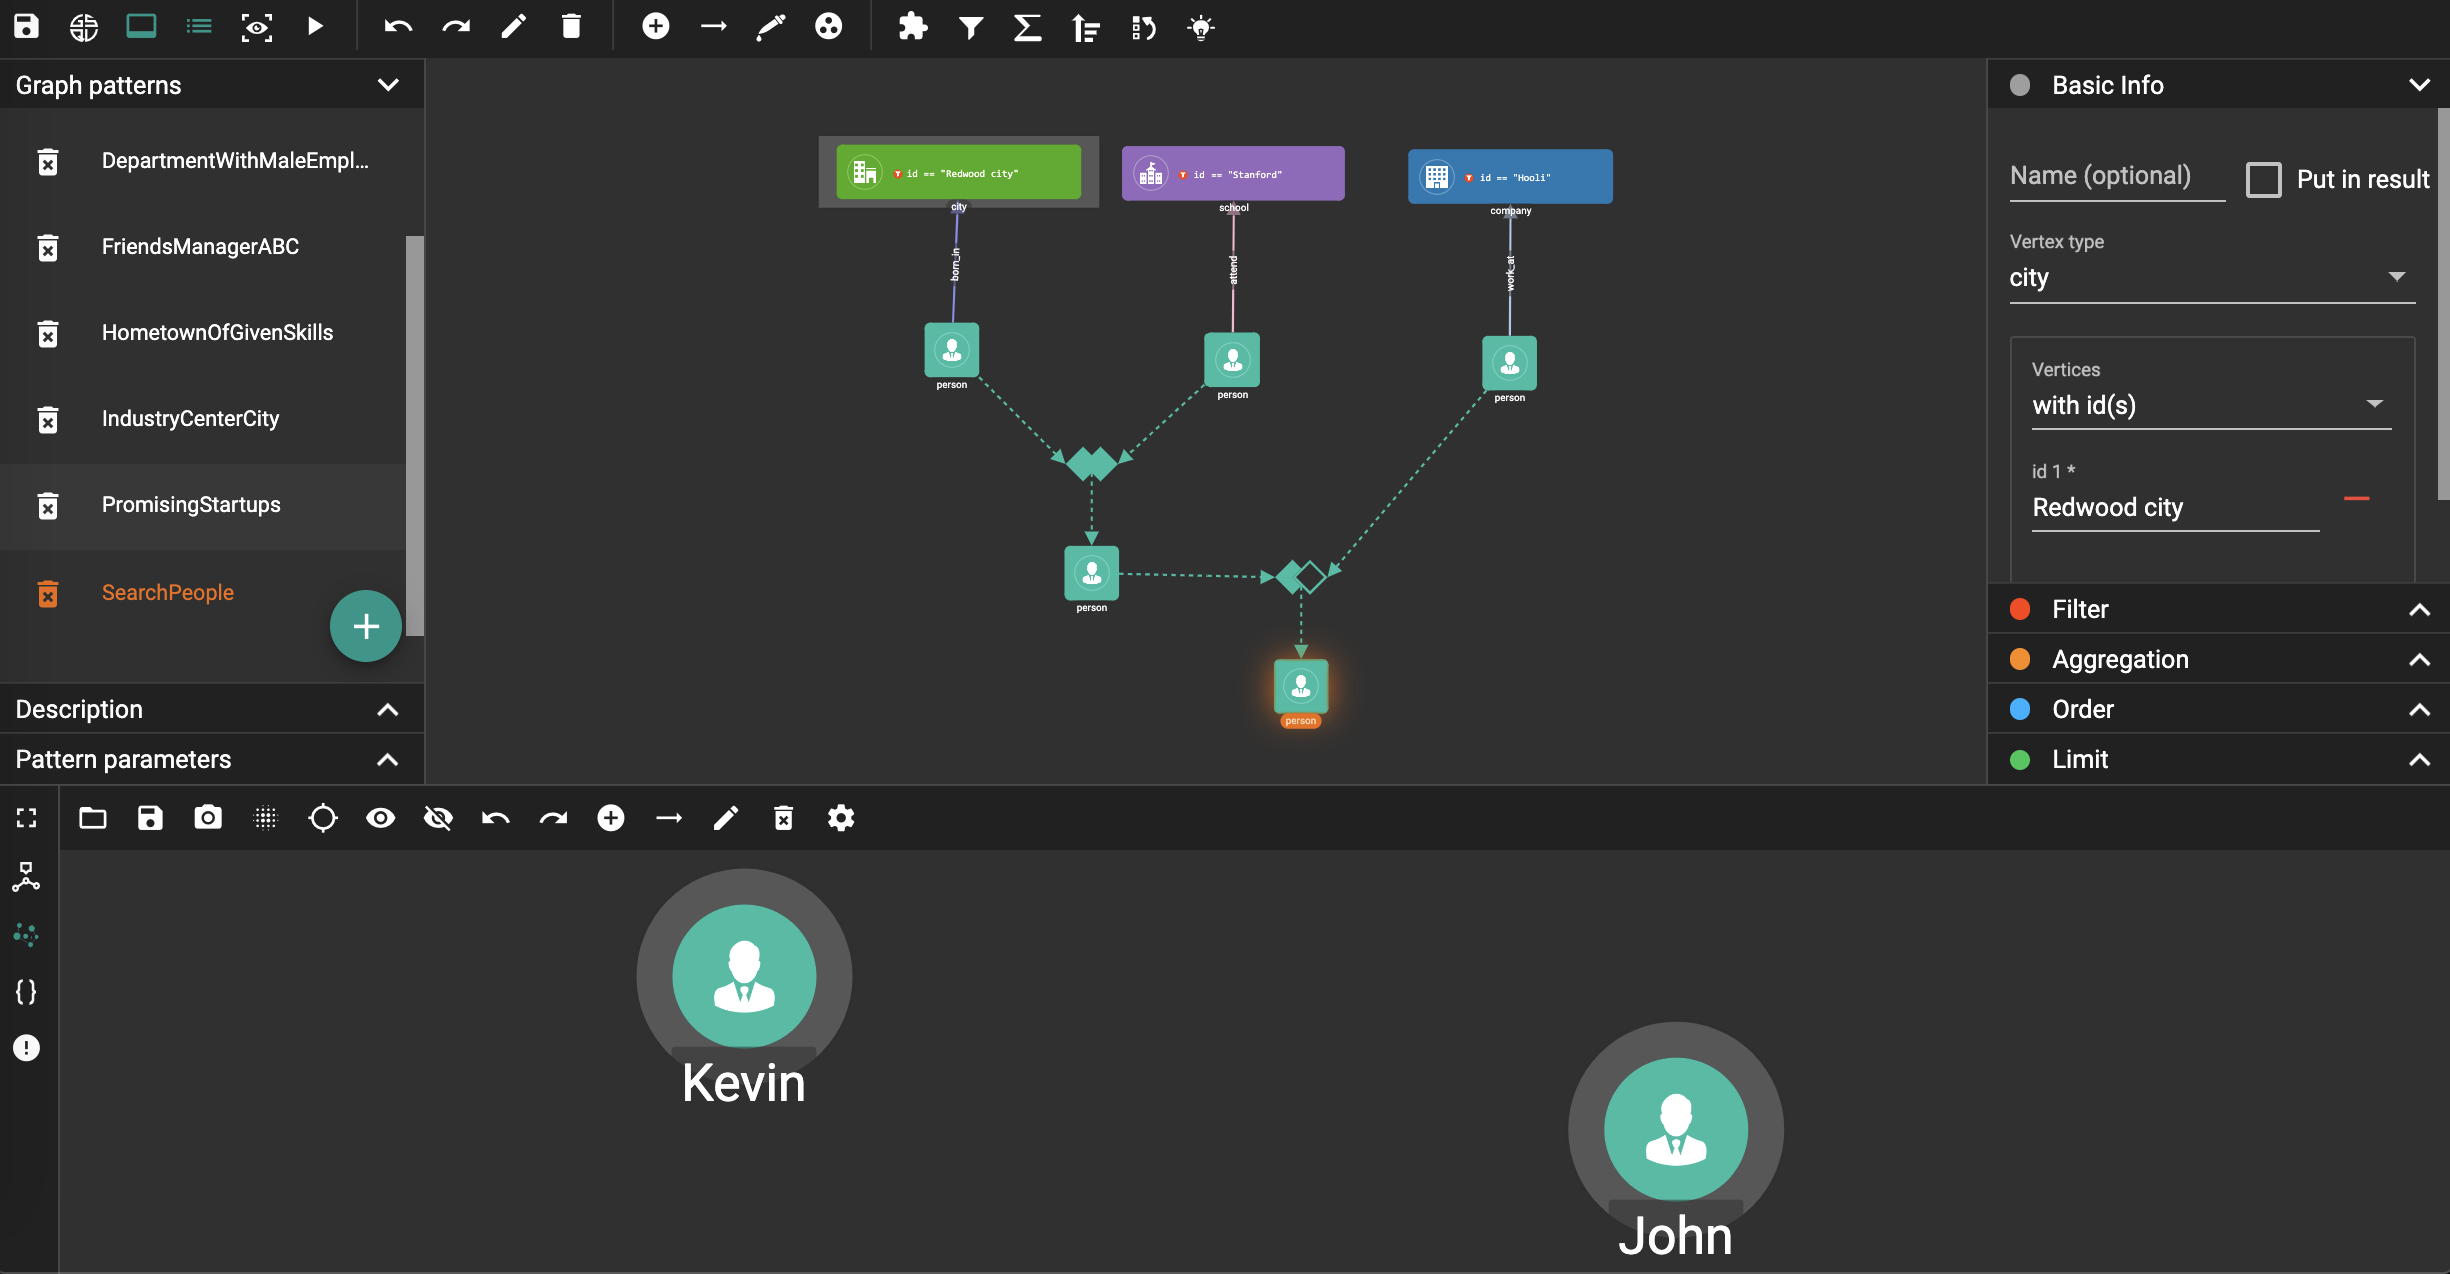
Example 4. Find the people who either were born in Redwood City or attended Stanford university, but didn’t work for Hooli.
Expand Graph patterns section in the pattern list panel, then create a new visual pattern named SearchPeople. Create the following visual pattern following similar steps as above:
.png)
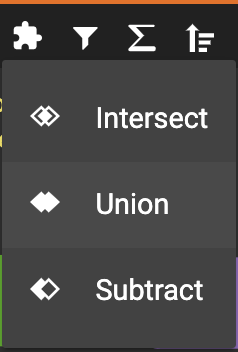
Click  in the toolbar,
and choose Union:
in the toolbar,
and choose Union:
Click the left two person vertex patterns respectively to add the union widget:
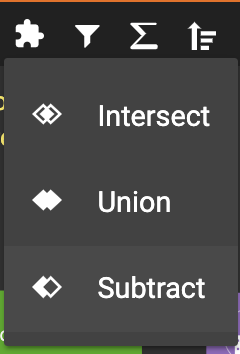
Click in
the toolbar, and choose Subtract:
in
the toolbar, and choose Subtract:
Click the output person vertex pattern of the union widget, then click the right person vertex pattern, a subtract widget is added into the visual pattern:
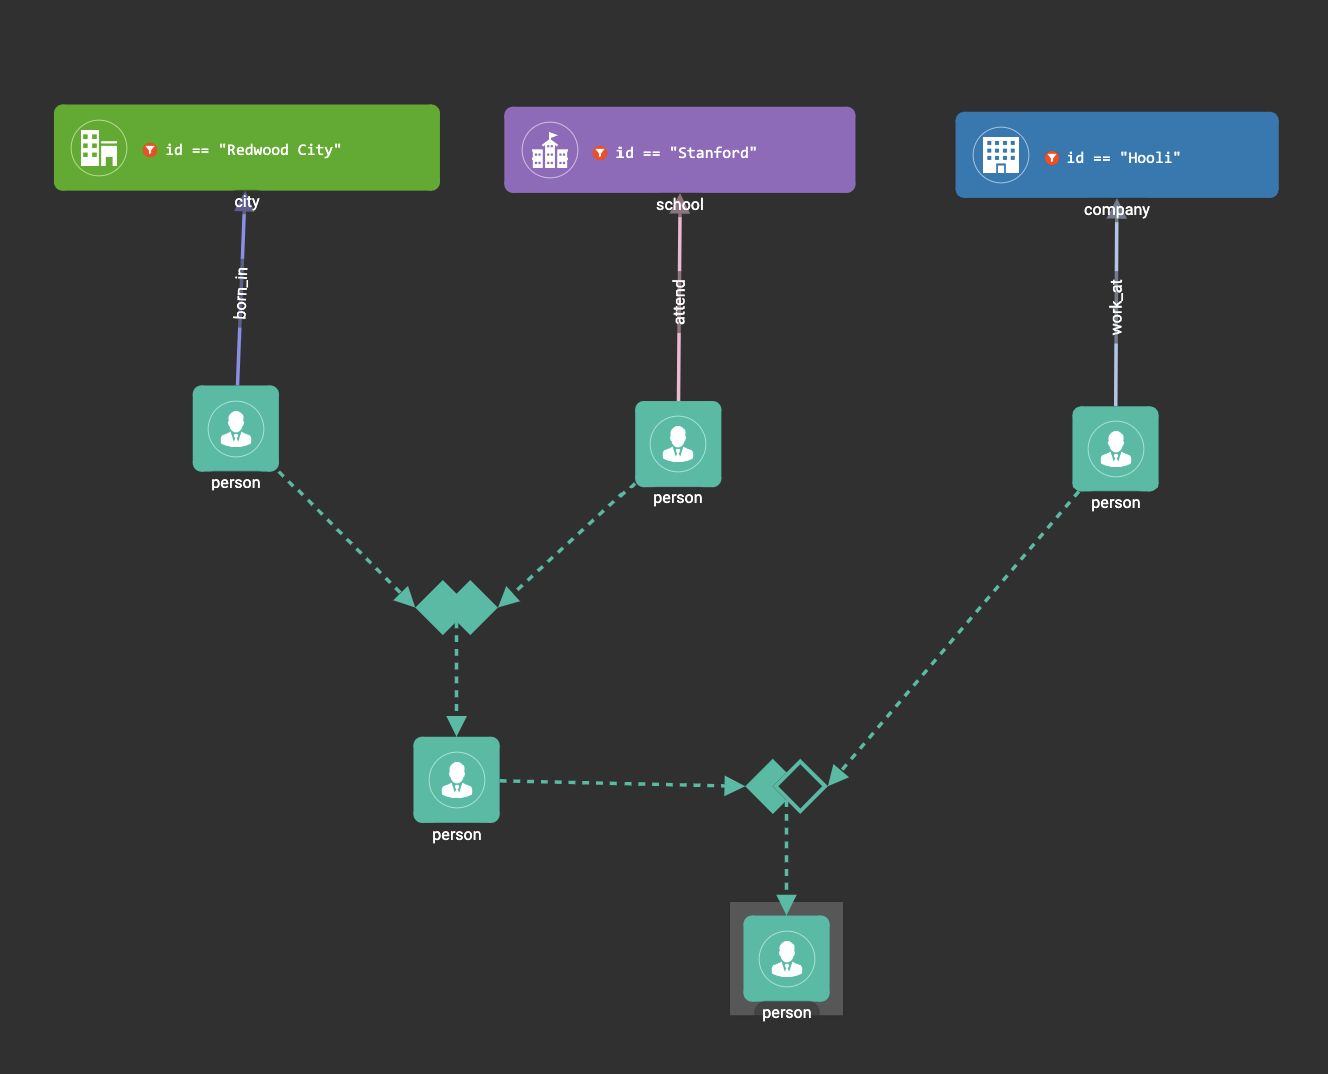
Put the output person vertex pattern of the subtract widget into result:
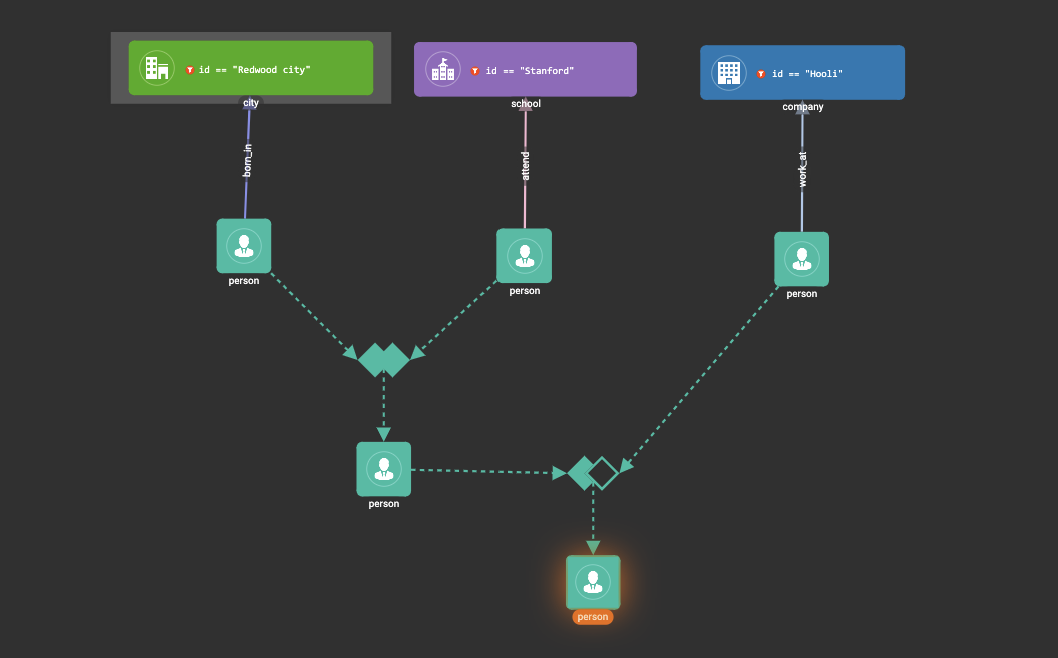
Save and run the pattern:
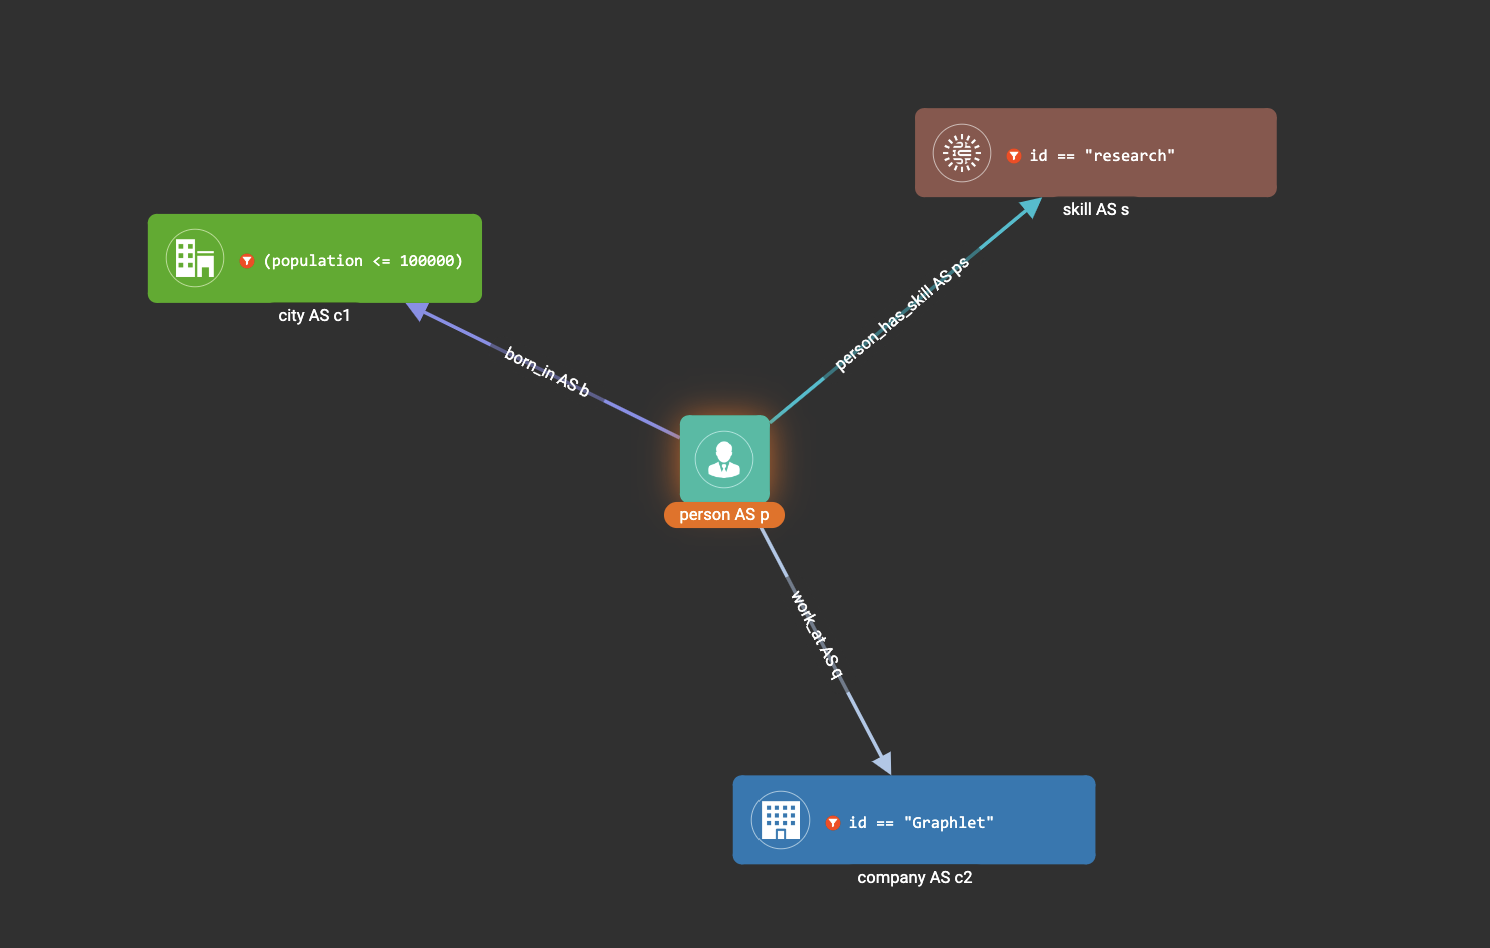
Example 5. Find all the people that were born in a city with population no more than 100,000, worked for Graphlet, and have research skill.
A snowflake-like visual pattern is commonly used in this type of searching problems:
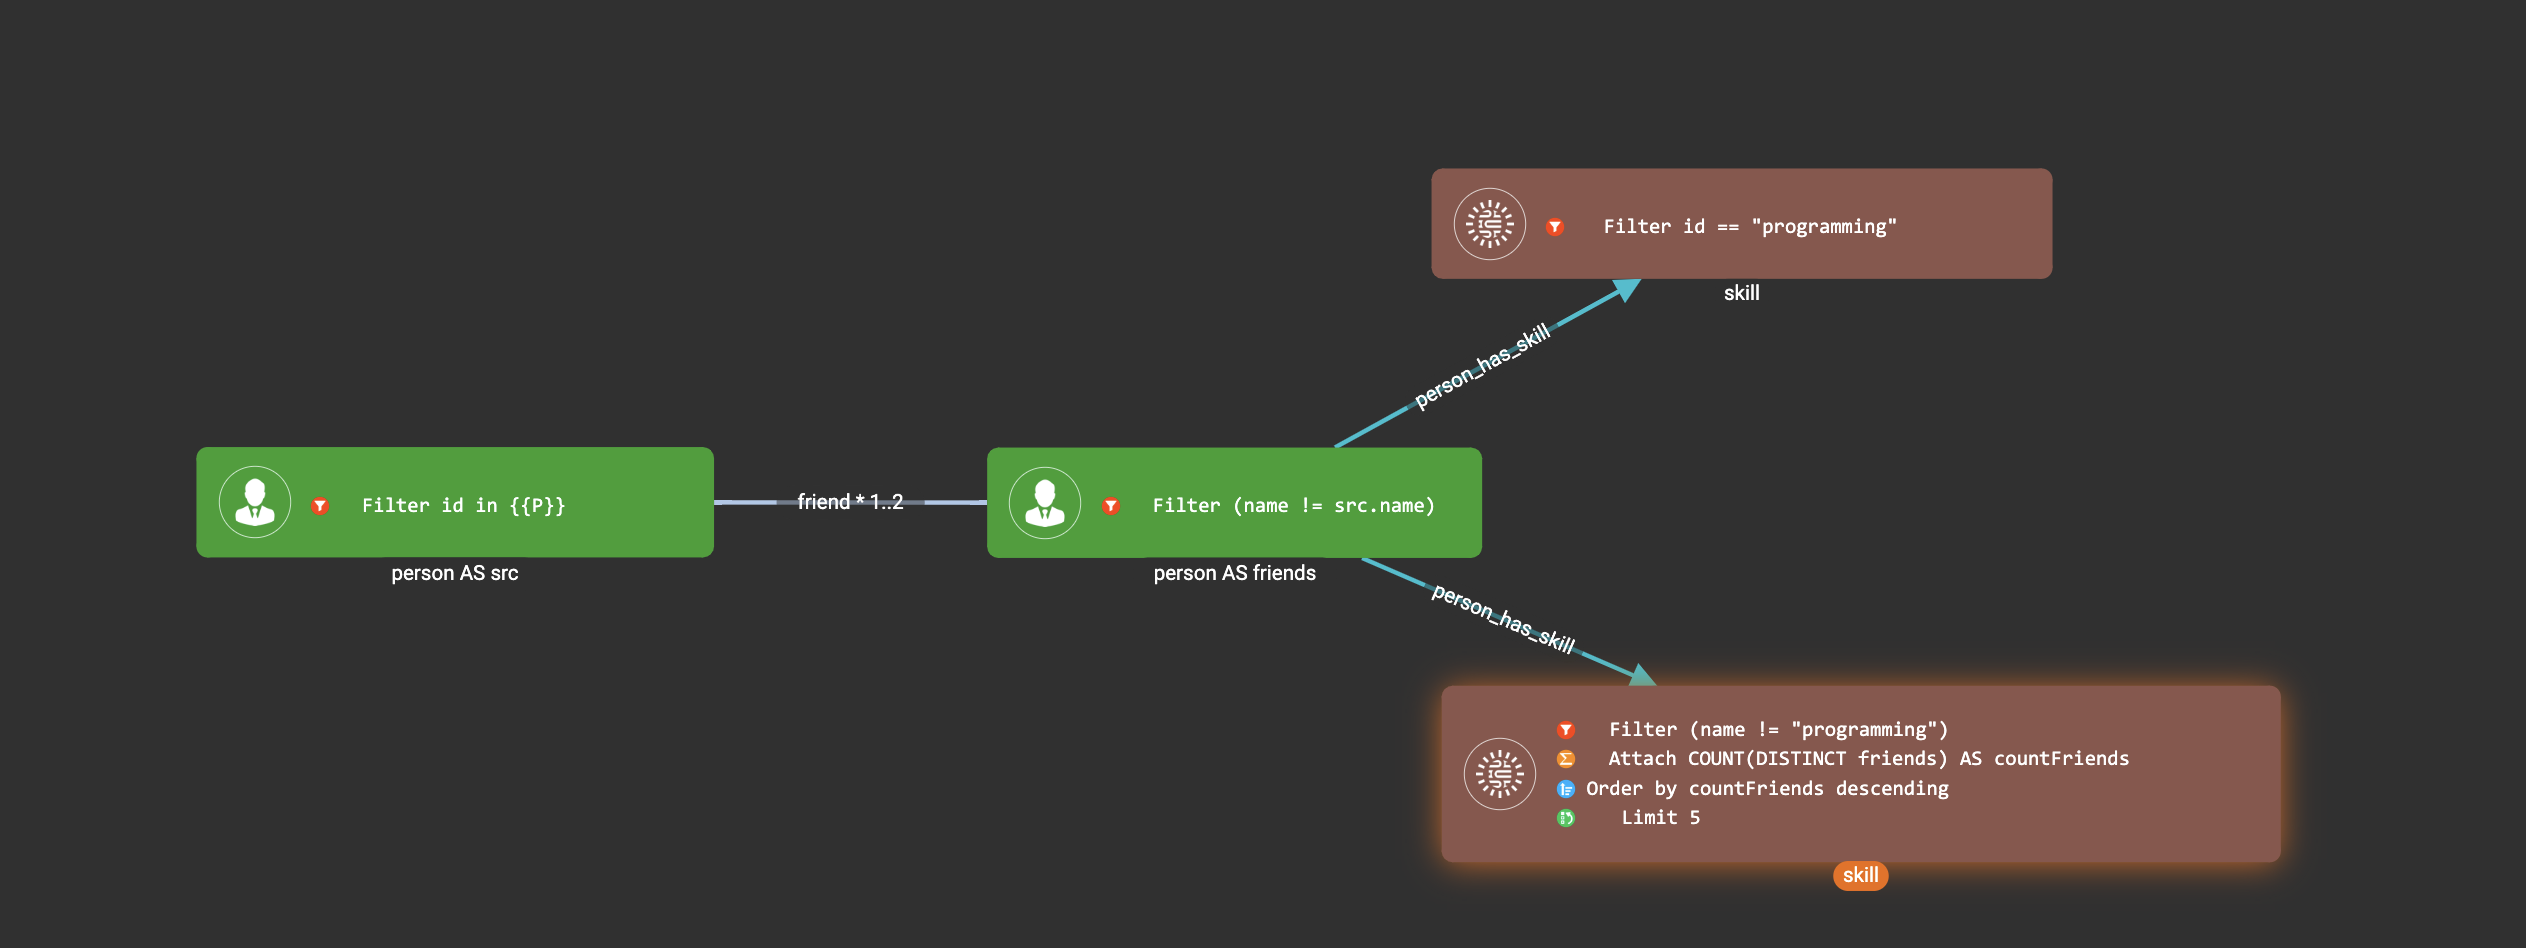
Example 6. Giving a person P, among all his direct friends and friends' friends who have programming skill, what are the top 5 other skills that most of these people have?
First, we get the friends and friends' friends of P. We use the programming skill to filter these friends, then we find the other skills that these people have. Then we count the number of people having these skills, and choose the top 5 skills as the result.