Map Data To Graph
After you have created a graph schema, the next major step is to map your data to the schema. Click "Map Data To Graph" on the left side menu bar.
The working panel is split into a left panel and a right panel.
Adjust the panel sizes with the Expand Panels buttons at the top: 
Before any data is mapped, the left panel will display only the graph schema.
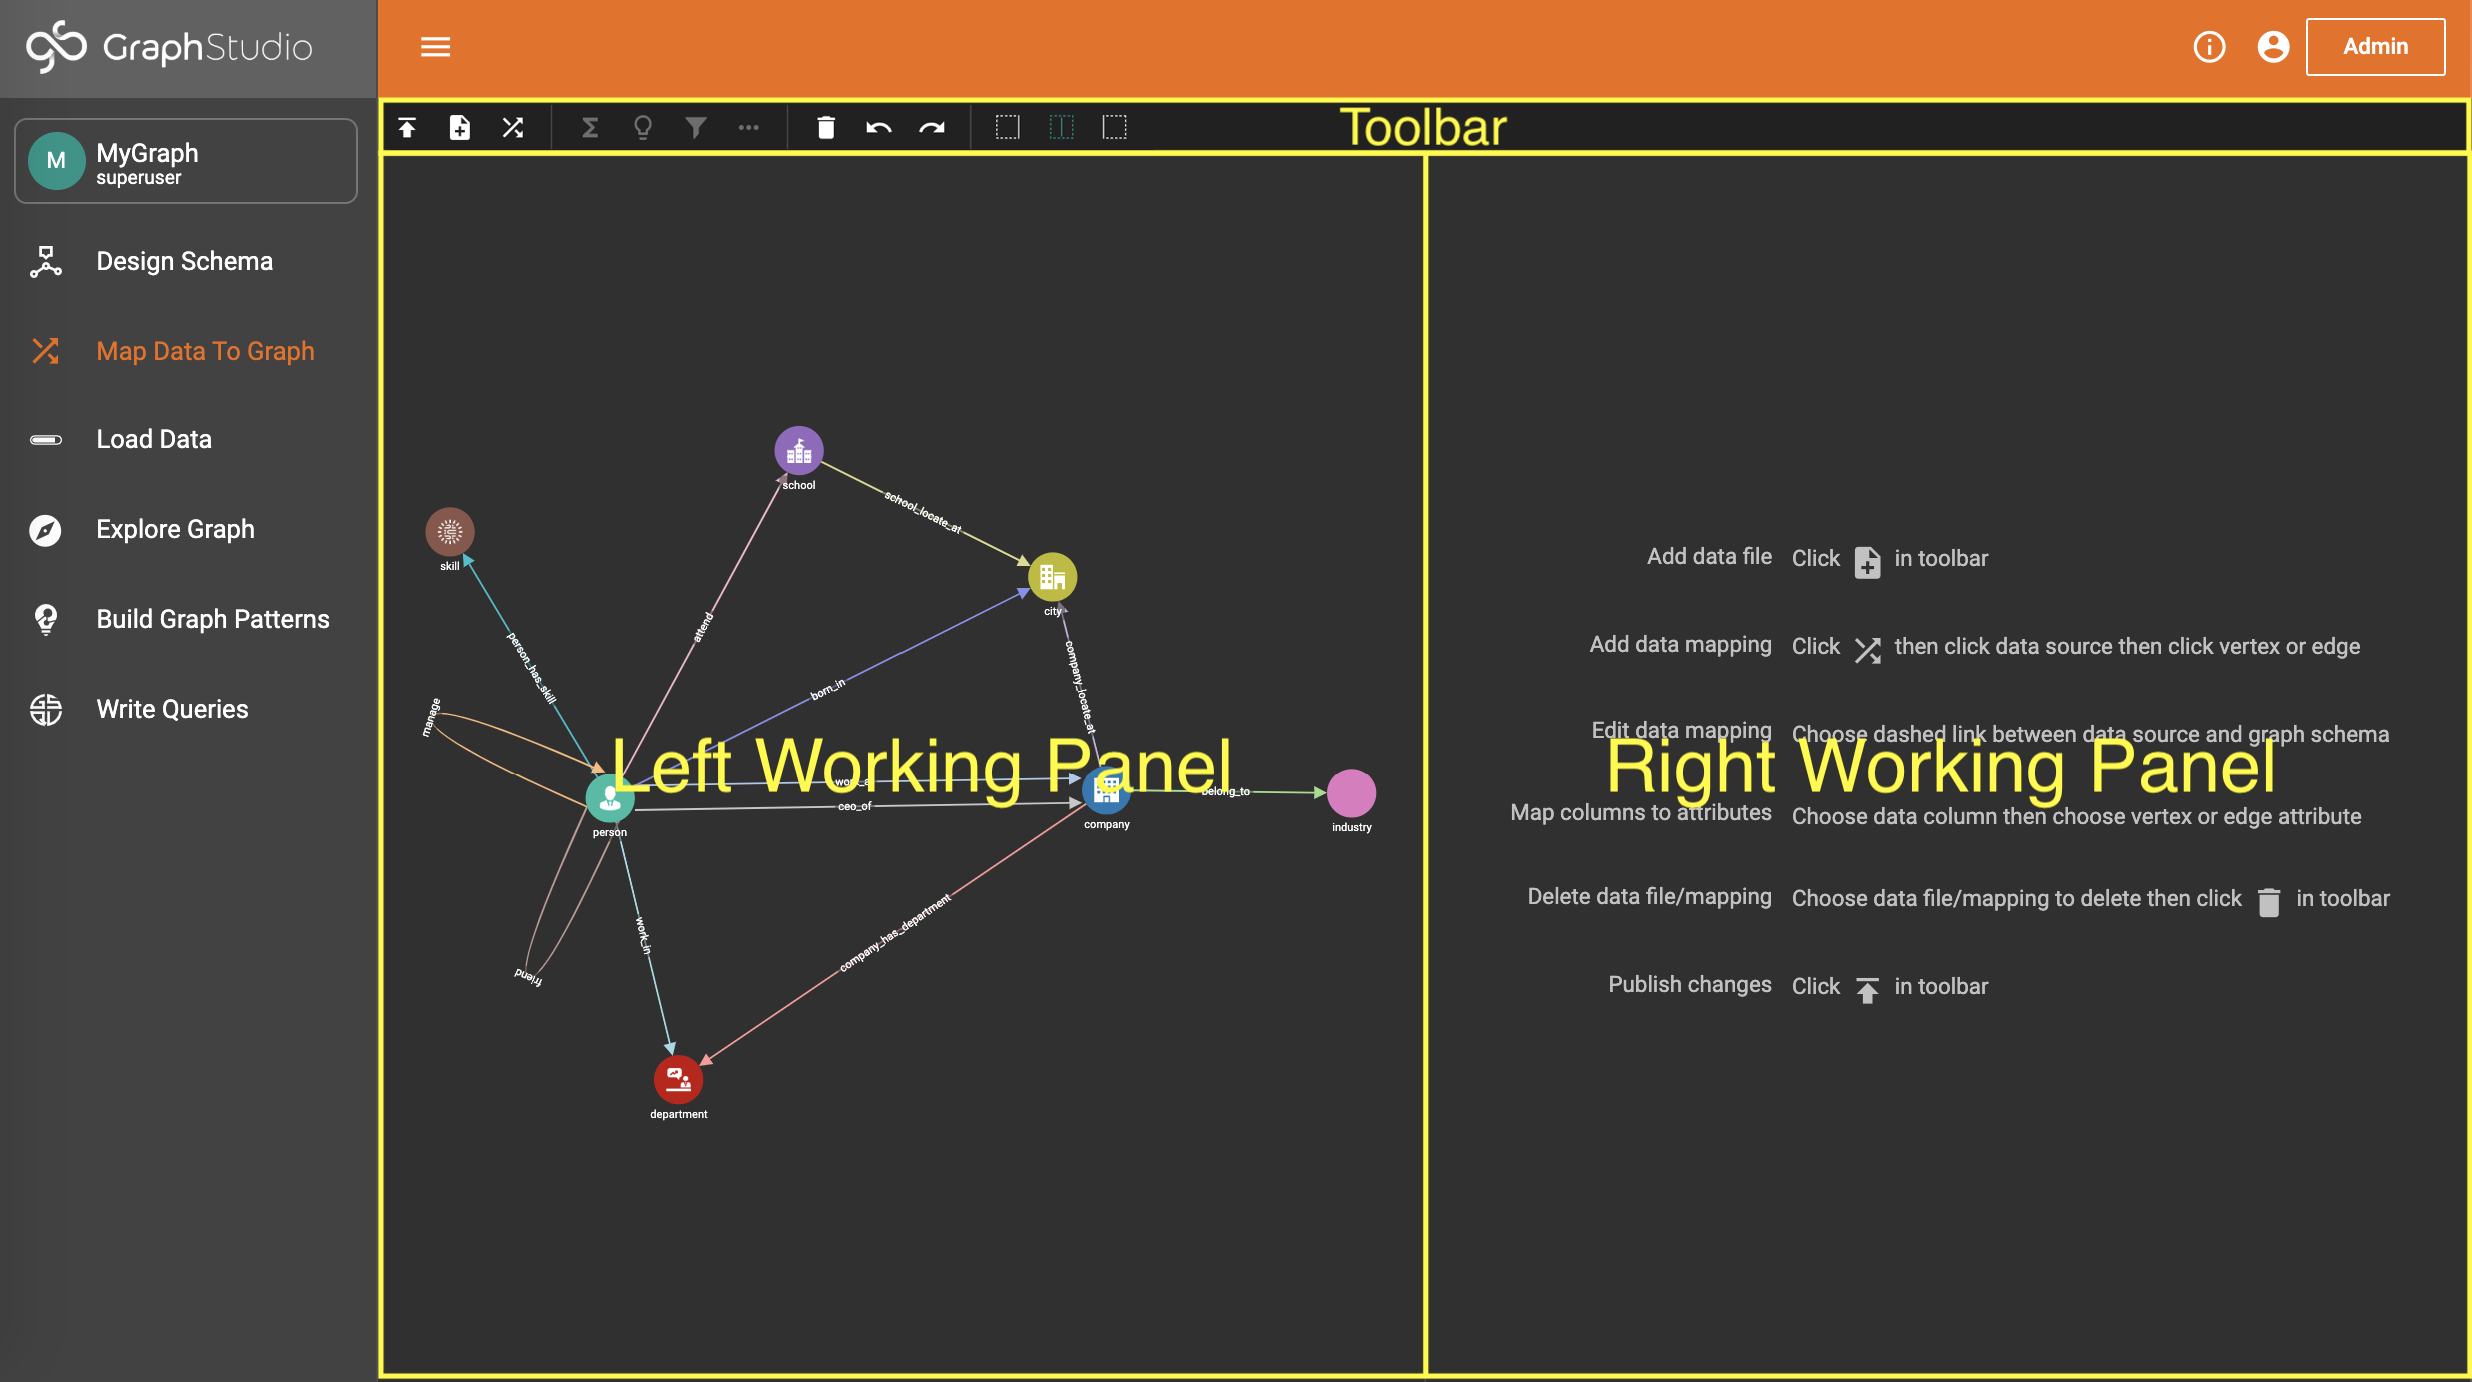
The main steps are:
-
Add a data source
-
Add data file(s)
-
Map data file(s) to vertex/edge types
-
Map data file columns to vertex/edge fields
-
Publish data mapping
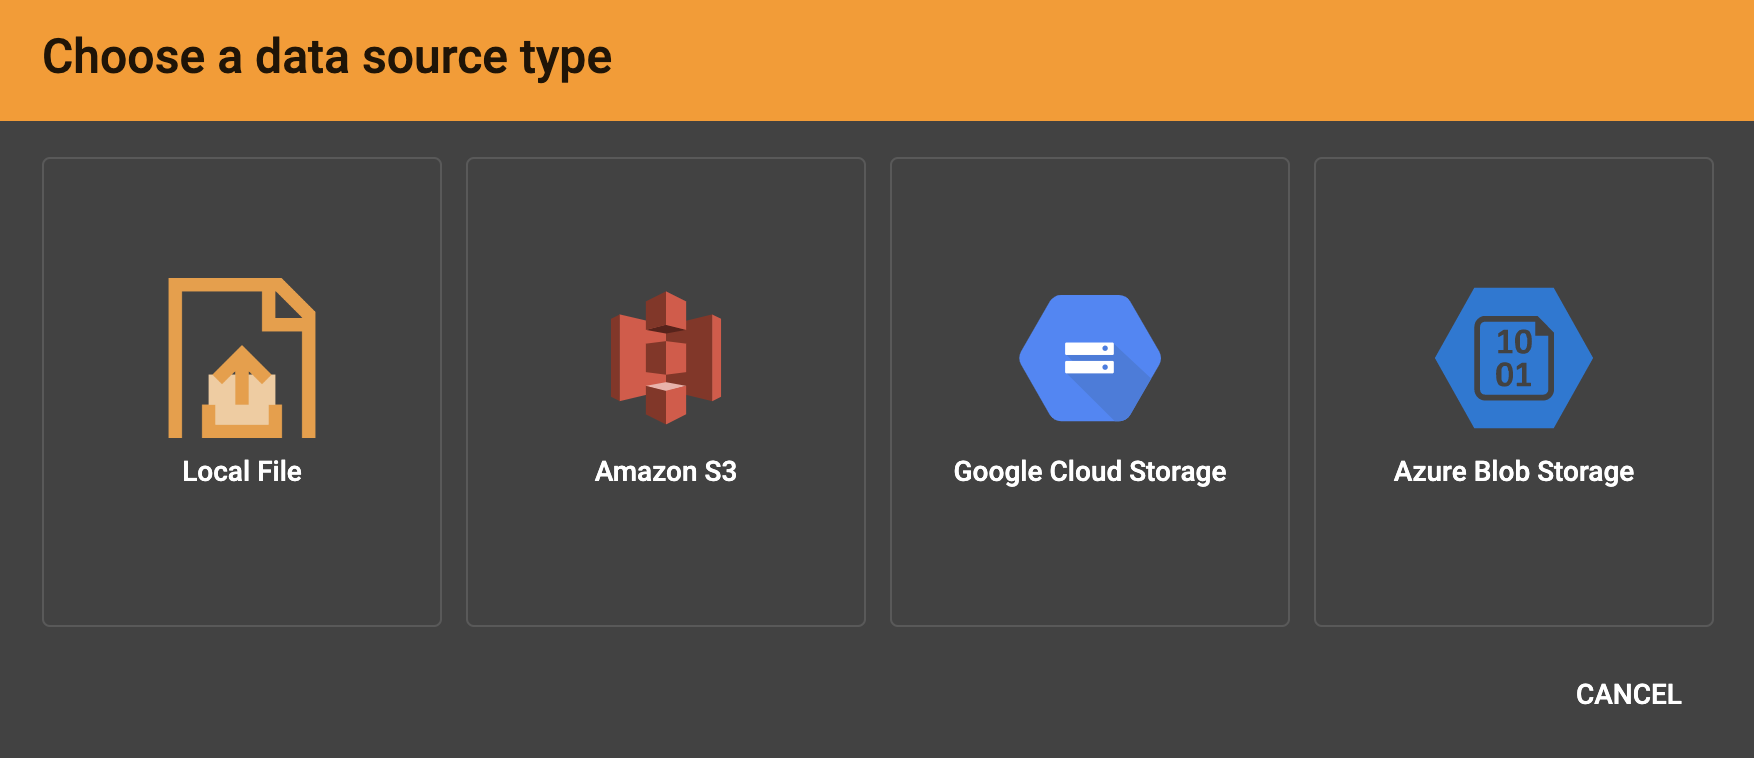
Data Source
The GraphStudio term "data source" is separate from the GSQL DATA SOURCE keyword.
In GraphStudio, a data source is a connection to where one or more data files are stored, either locally on the TigerGraph server or remotely in cloud storage (Amazon S3, Google Cloud Storage (GCS), or Azure Blob Storage (ABS)). A data file is a file containing structured data to be loaded into the graph, creating vertex and/or edge instances.
|
Visibility of Local Files
When the Local File data source option is used, these files will be visible to any user with access to GraphStudio for this database. For sensitive data, we strongly recommend using one of the cloud storage options coupled with their cloud access security features. |
In the data mapping process, you are not loading data from files directly, but rather creating links to set up the process of loading the files in the next step. For example, if you connect to remote storage, you provide the metadata and access credentials necessary to access the files during the loading process. If you upload a local file, you store that file on the TigerGraph server.
Click the Add Data File button  in the toolbar to begin the process of choosing a data source and adding the data files.
Data File
A data file is the actual structured data on the TigerGraph server that is loaded into your graph to create vertices and edges.
Folders
Remote data sources support selecting entire folders at the same time. Local file upload does not currently support uploading a folder from your browser to the server.
If you select a folder, all of its data files must share the same data schema.
Compressed files
TigerGraph supports loading from archived and compressed files only through remote storage connections.
Currently supported file extensions include zip, tar.gz, tgz and tar.
GraphStudio detects the file extension and automatically chooses the corresponding file format.
If the file is encoded with one of these formats but has a non-standard file extension, you can manually specify the file format.
Data Loading
The following tabs contain instructions for each data source type.
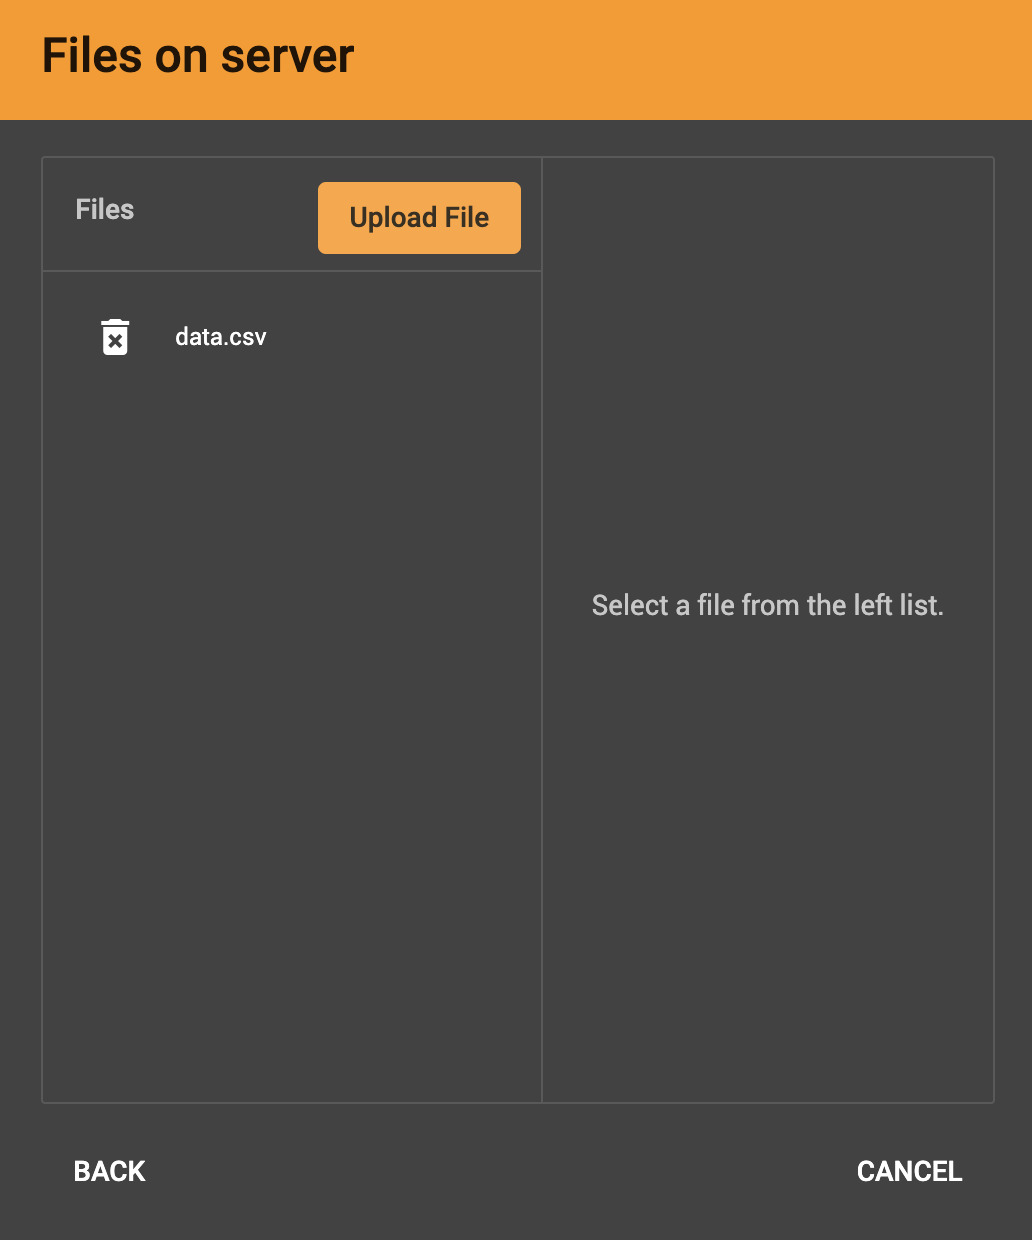
After clicking Local File, you will be prompted to choose one or more local files to upload through your browser to the TigerGraph server. If you have uploaded local files to the server previously, they appear in the file list in the left panel.
Supported files:
-
CSV
-
TSV
-
JSON Lines
Unsupported files:
-
Zip archives
-
Tar archives
Compressed files are only supported through remote storage connections.
A success message for each file appears after each file is successfully uploaded to the TigerGraph server. Once the files have finished, choose the file or files you want to work with from the left panel and click Next.
Confirm that the data has parsed correctly in the next step.
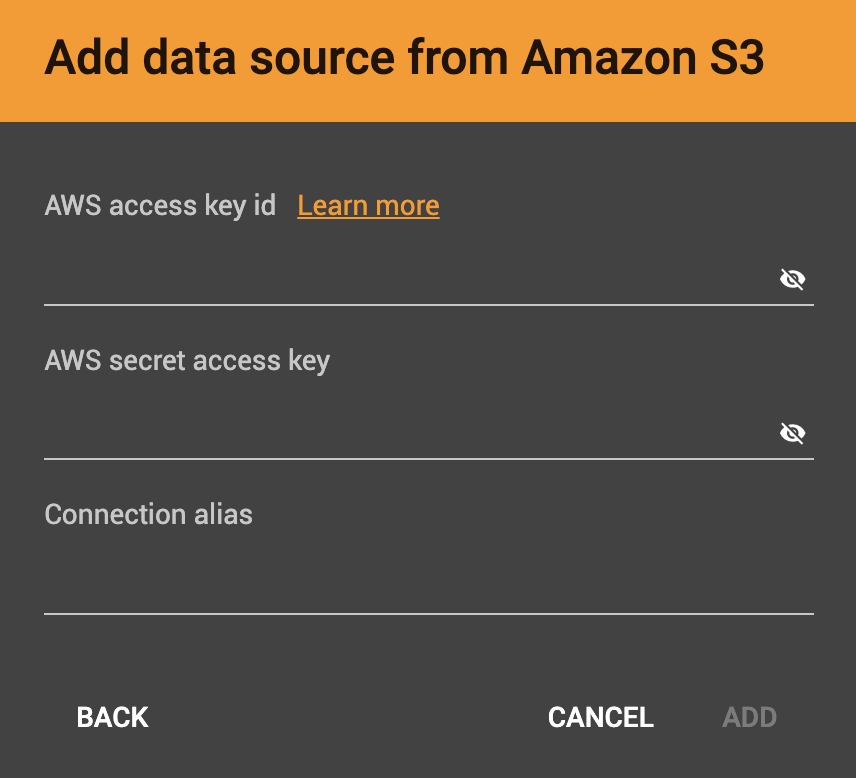
After you click the S3 data source icon, you will be prompted for your:
-
AWS access key ID
-
AWS secret access key
-
Connection alias (a name for you to give to the connection)
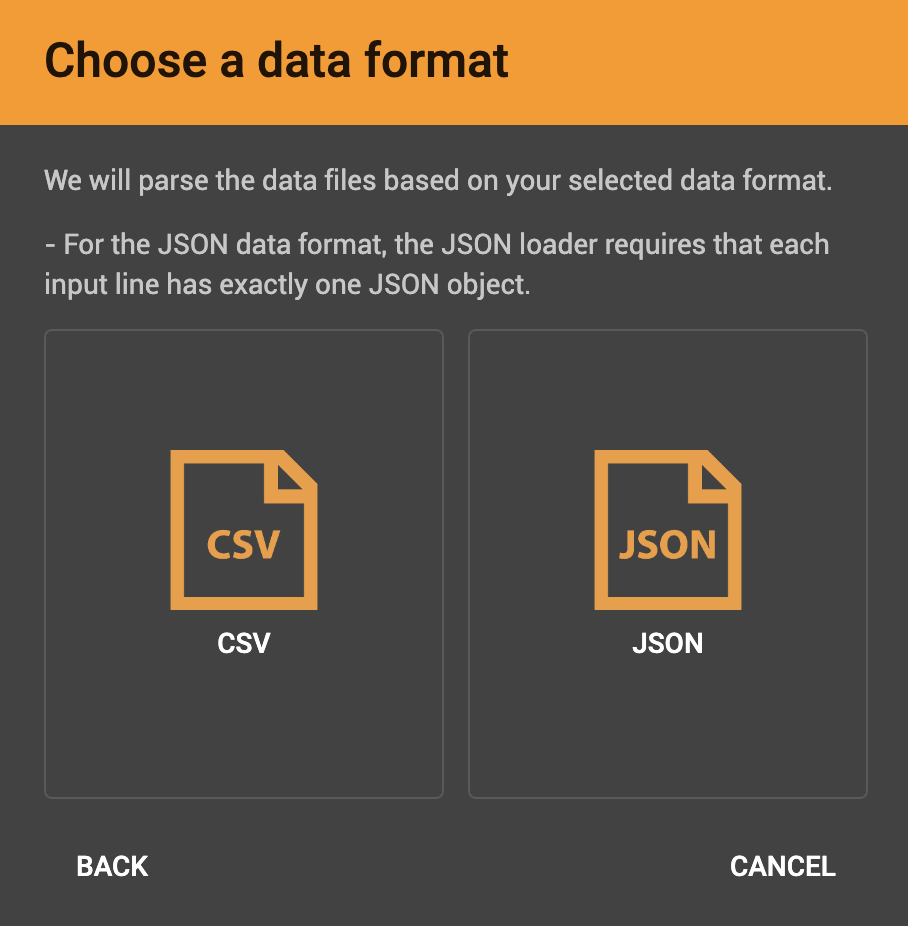
Identify your file as CSV or JSON format.
Enter the S3 URI. Follow the instructions here to retrieve it: Accessing a bucket using S3 URI
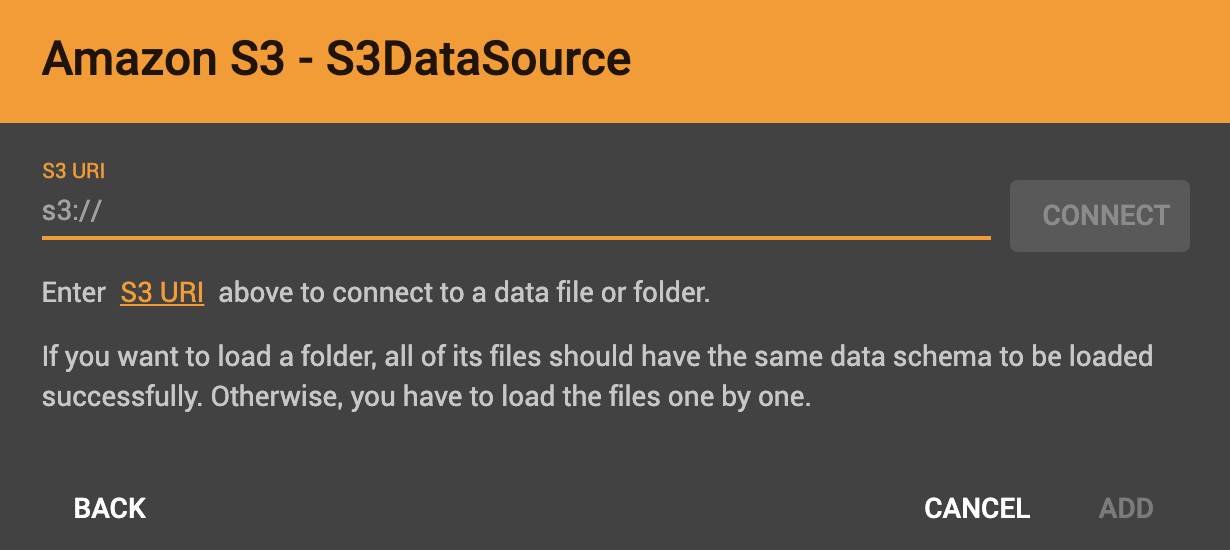
Confirm that the data has parsed correctly in the next step.
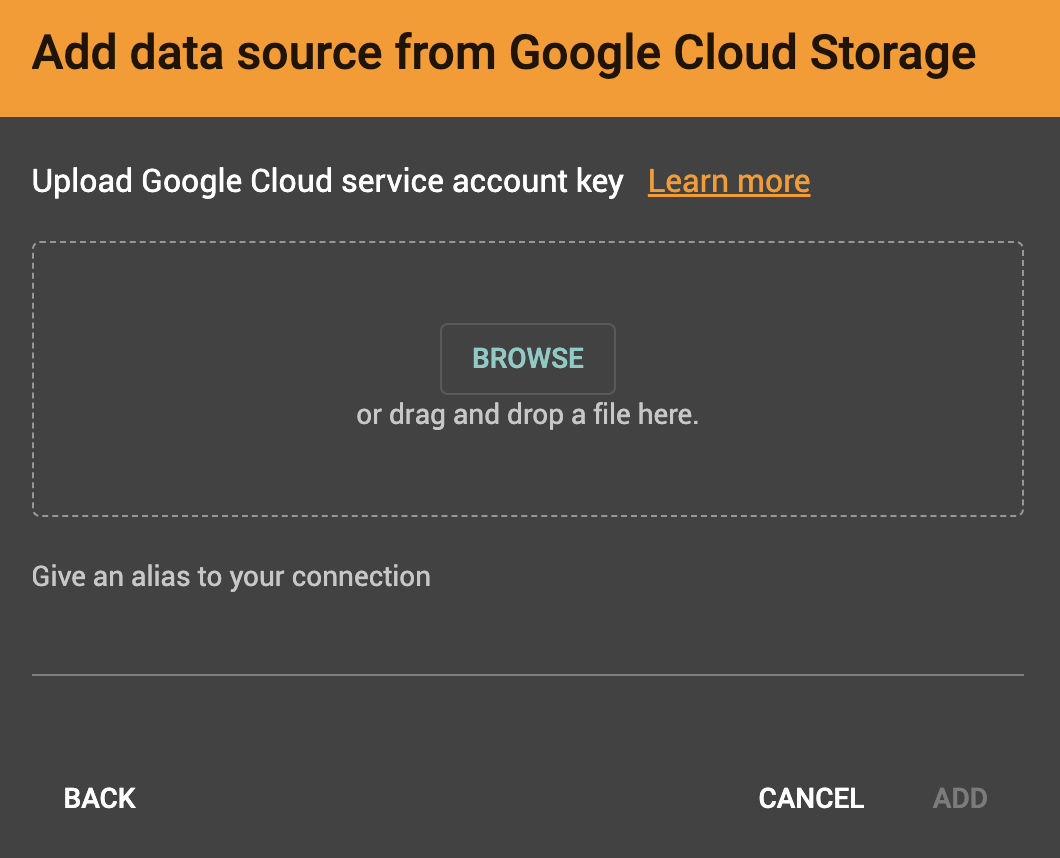
Browse your computer or drag and drop to upload your GCS account key file. Google provides a guide to generating and downloading key files at this link: Getting a service account key.
After you enter your key, identify your file as CSV or JSON format.
Enter the gsutil URI for your data file in your Google Cloud Storage bucket.
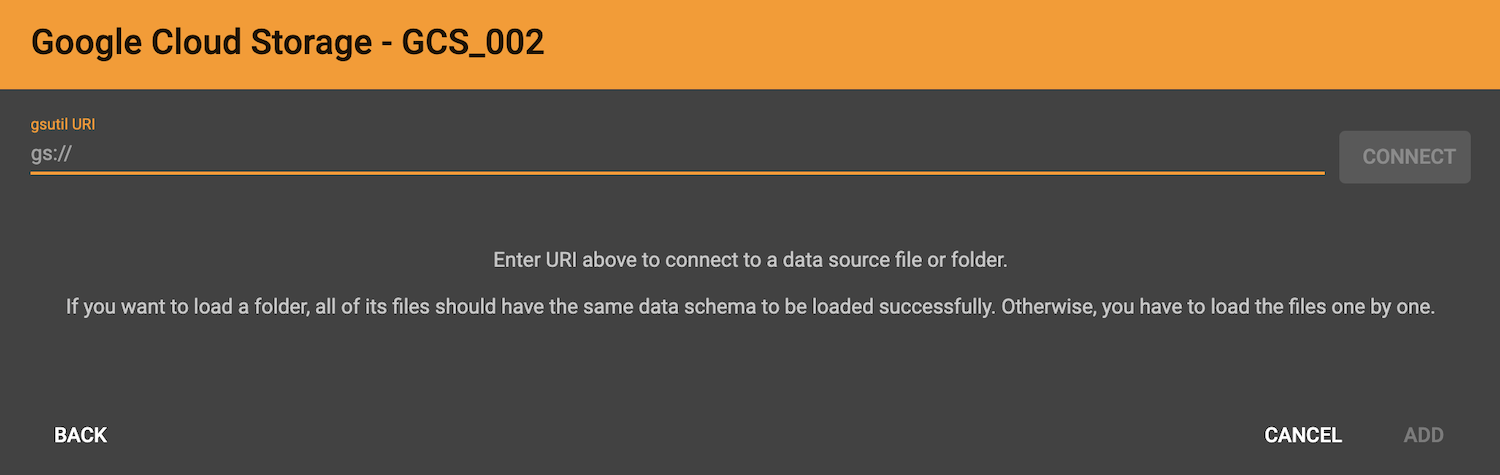
Confirm that the data has parsed correctly in the next step.
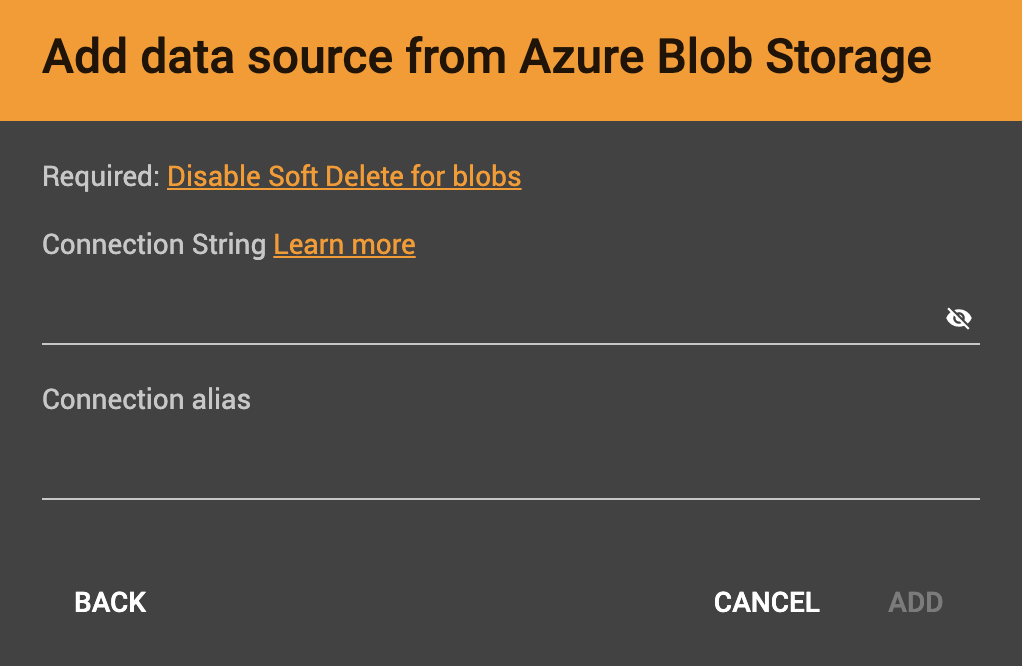
After you click the ABS data source icon, you will be prompted for your Connection String and a custom alias for the connection (required). See View Account Access Keys for instructions.
After you enter your key, identify your file as CSV or JSON format.
Enter the Blob URL.
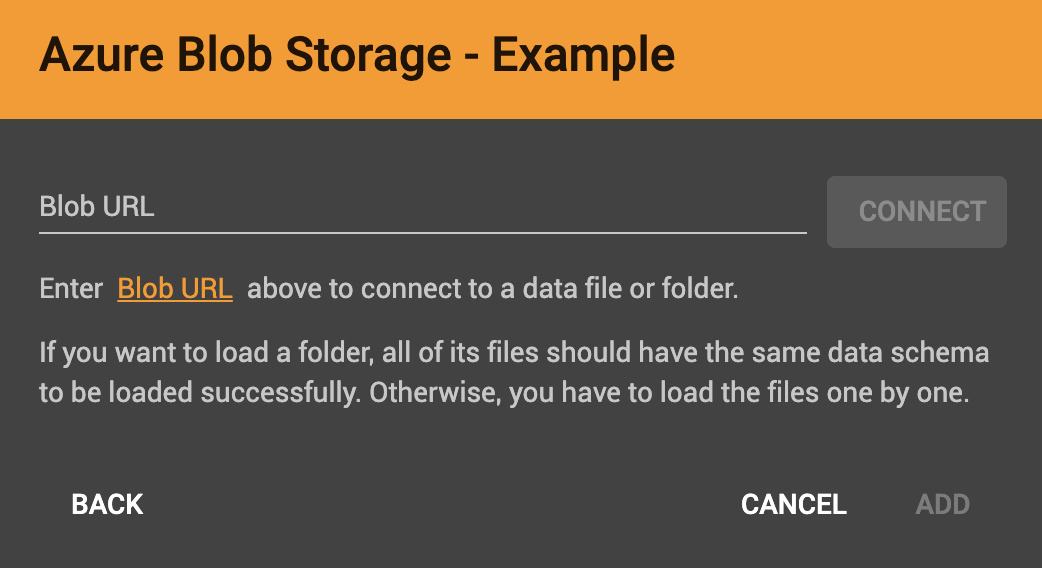
Confirm that the data has parsed correctly in the next step.
Confirm data parsing
Whether loading from a local file on the server or from a file connected from remote storage, the last step is to check over a preview of the parsed data. In this example, the parser is working with a local file, but the process is identical for remote files as well.
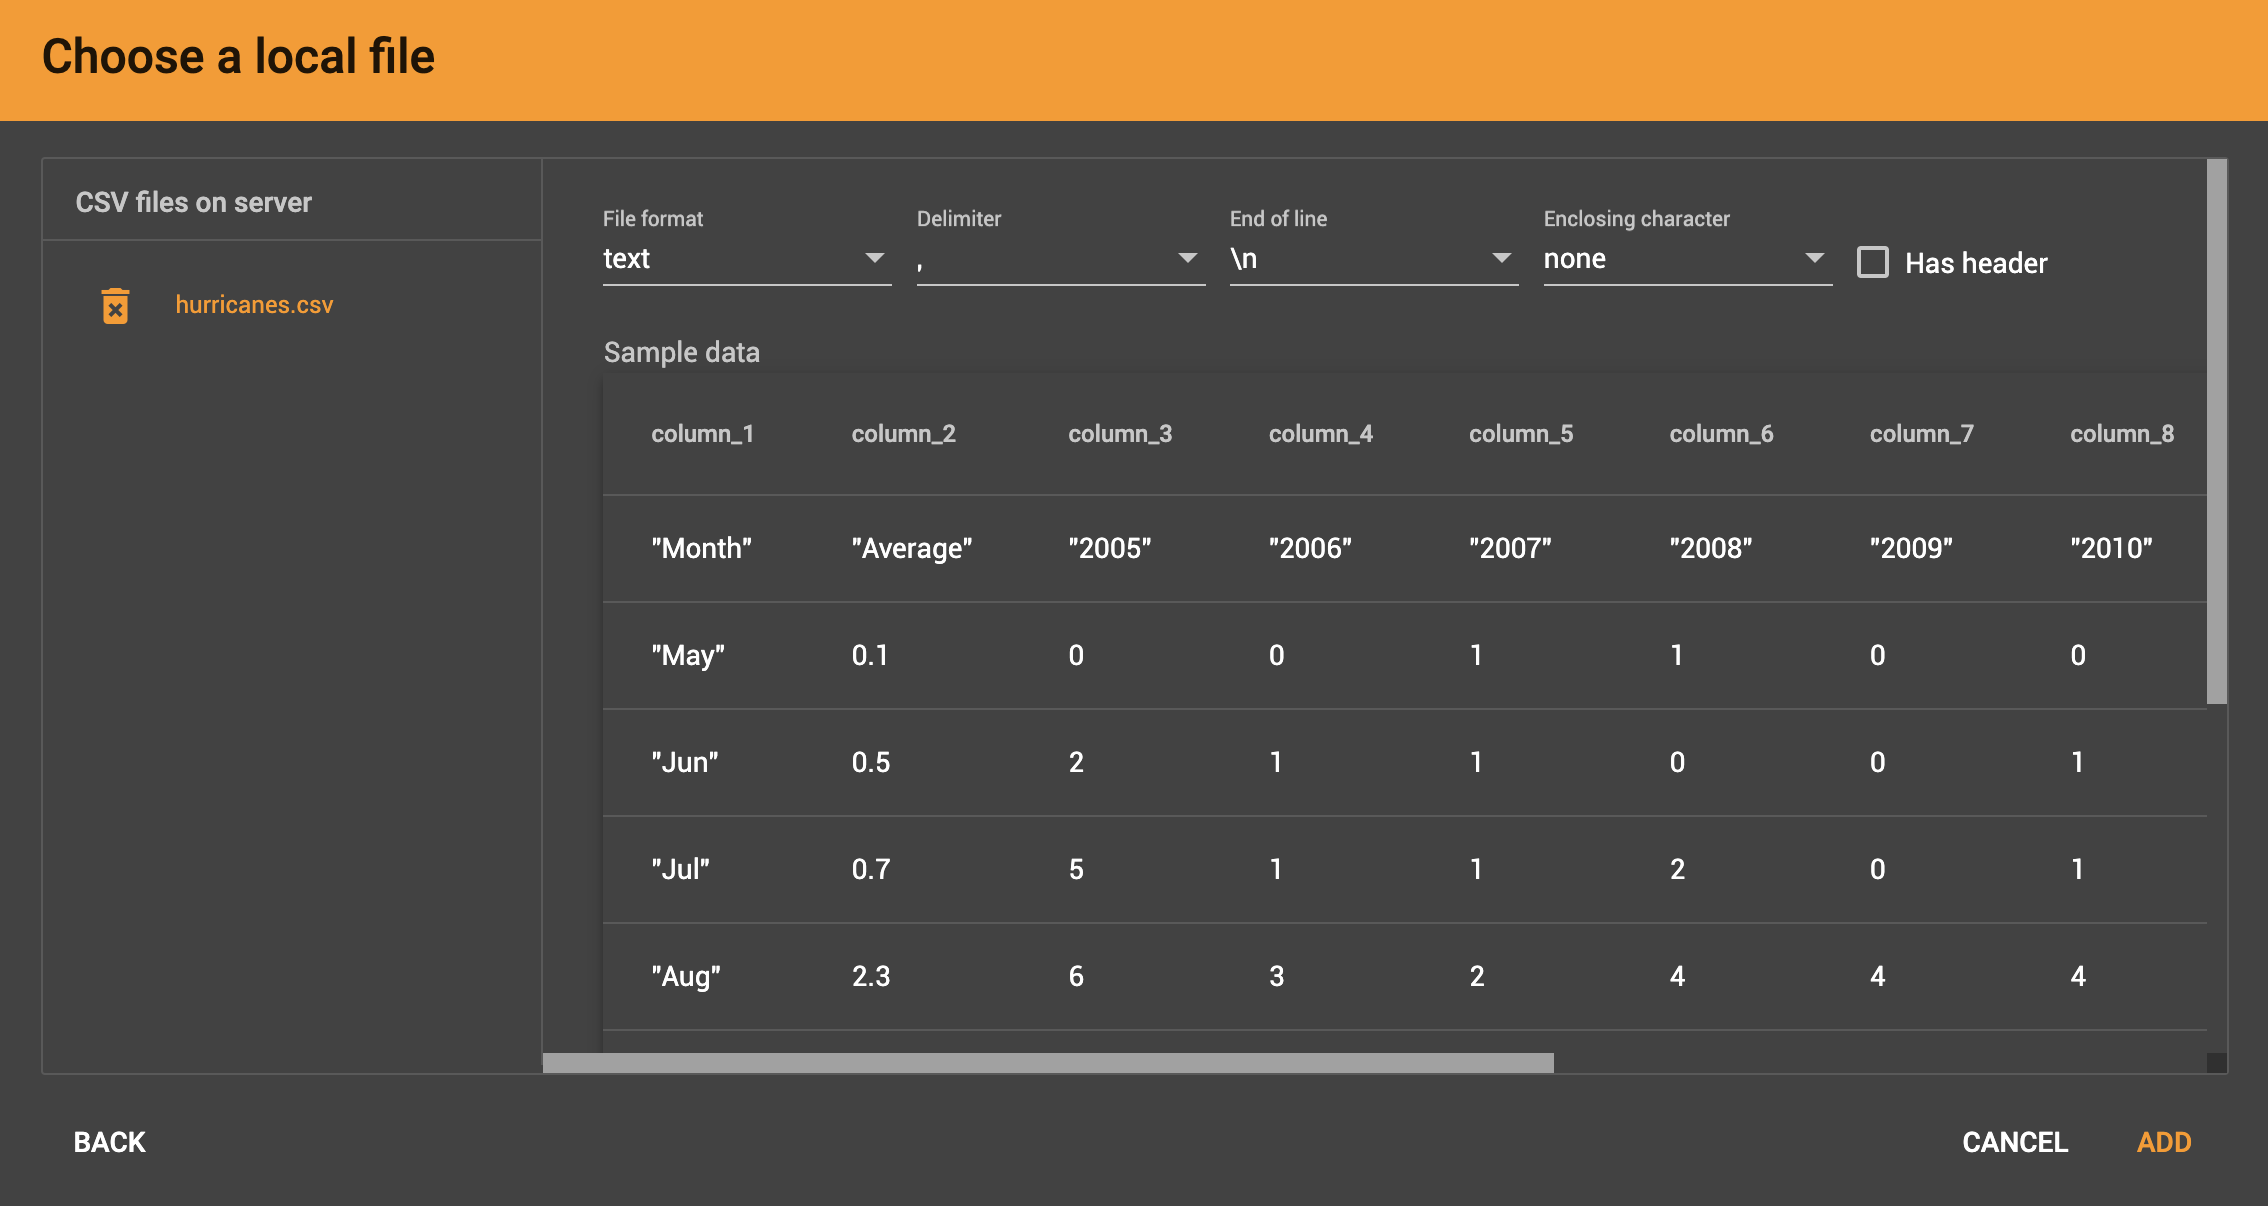
CSV file parsing
If your data file is in tabular format, the parser splits each line into a series of tokens. If the parsing is not correct, choose a different option for the file format, delimiter, or end of line character.
The enclosing character is used to mark the boundaries of a token, overriding the delimiter character. For example, if your delimiter is a comma, but you have commas in some strings, then you can define single or double quotes as the enclosing character to mark the endpoints of your string tokens.
It is not necessary for every token to have enclosing characters. The parser uses enclosing characters when it encounters them.
You can edit the header line of the parsing result to give each column a more intuitive name, since you will be referring to these names when loading data to the graph. The header name is ignored during data loading.
JSON file parsing
GraphStudio supports loading files in JSON format as well as in CSV or TSV format. Each line in the uploaded file must contain exactly one JSON object.
Similar to loading a CSV or TSV, you will first see a preview of the JSON file so that you can check the parsing.
After looking at the preview, you may edit the data key and data type for each of the JSON fields.
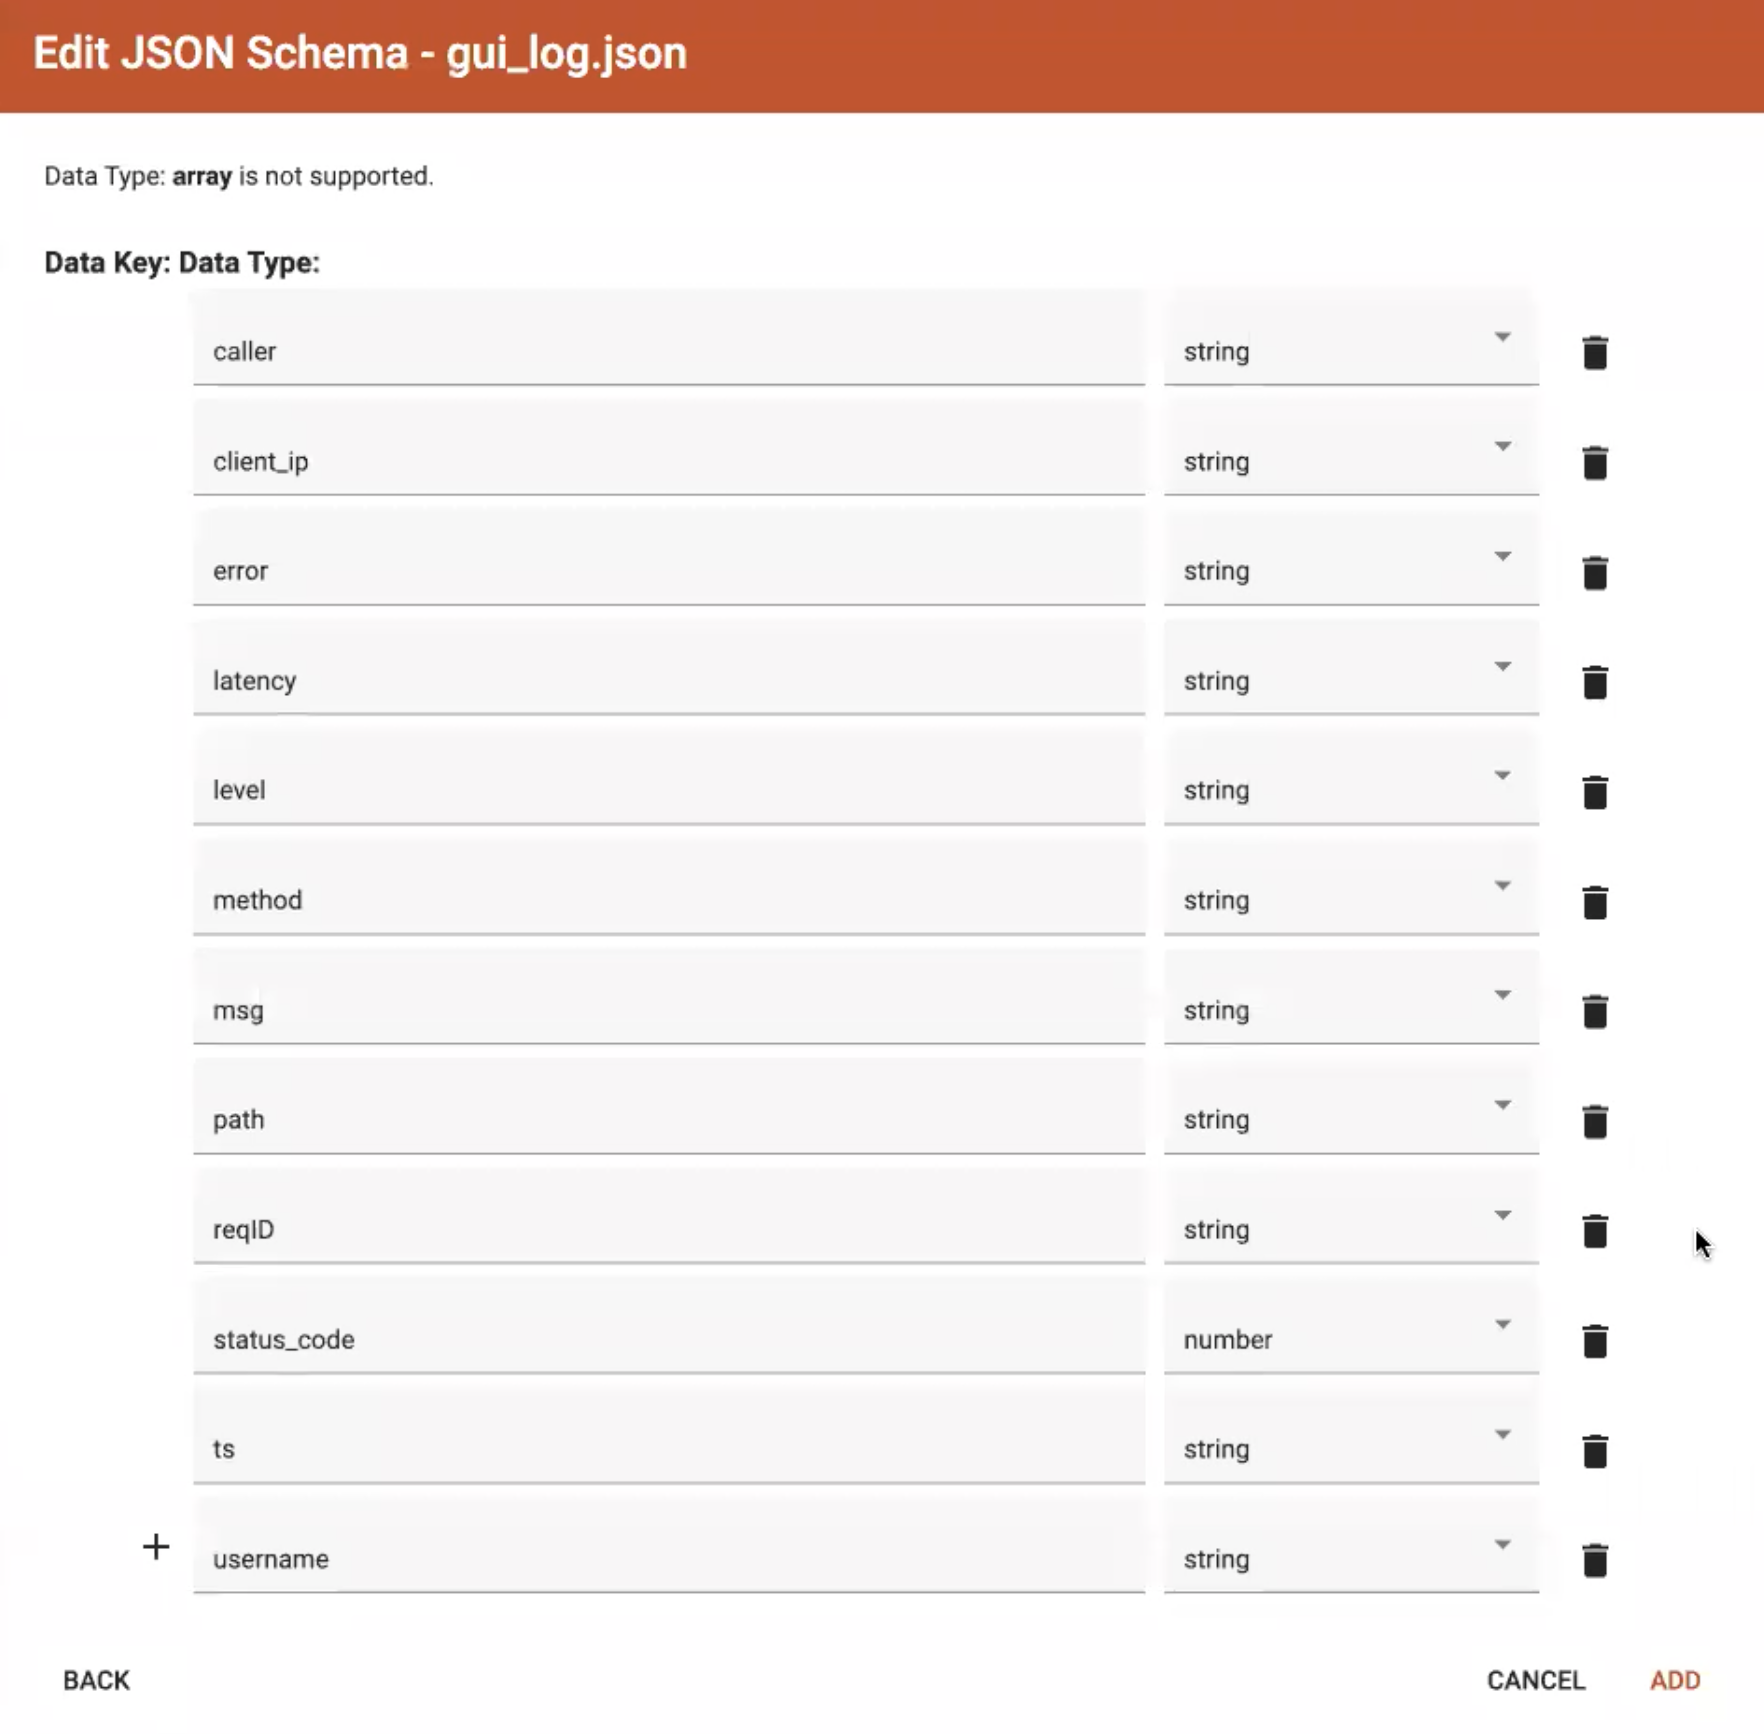
In this stage, you specify the data types for interpreting each JSON key as a potential object to load to a vertex or edge attribute. Here, you can also delete any keys that you do not want to load.
Once you are satisfied with the file parsing configuration, click the ADD button to add the data file into the left working panel.
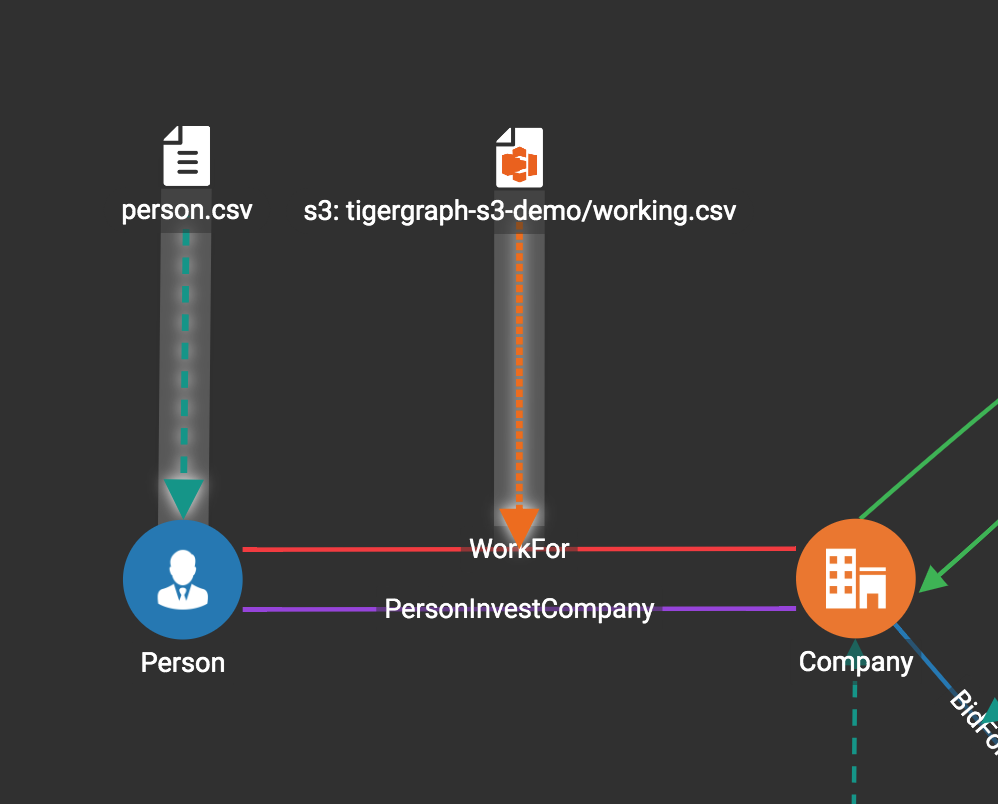
Map data files to vertex type or edge type
In this step, you link (map) a data file to a target vertex type or edge type.
The mapping can be many-to-many, which means one data file can map to multiple vertex and/or edge types, and multiple data files can map to the same vertex or edge type.
Click the map data file to vertex or edge button  to enter map data file to vertex or edge mode.
First, click the data file icon.
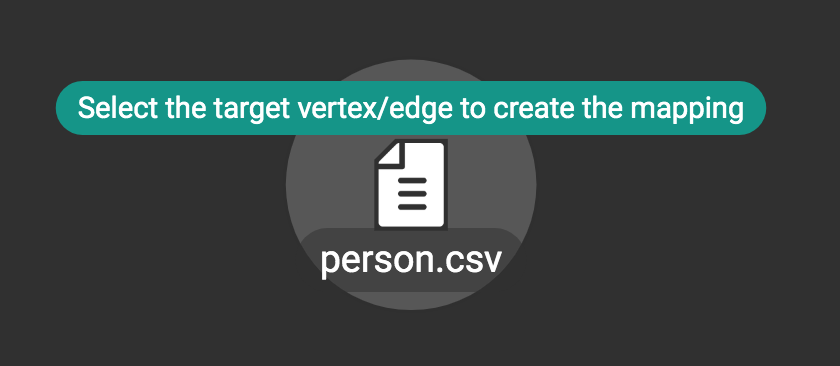
Next, click the target vertex type circle or edge type link to create a dashed link representing the mapping:
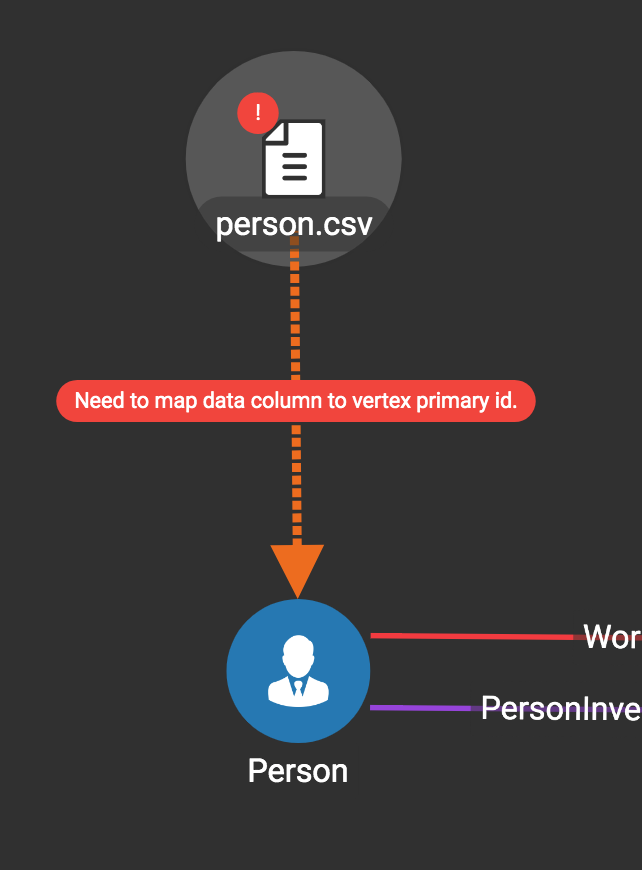
A red hint appears if the target type has not yet received a mapping for its primary id(s).
Map data columns to vertex or edge attributes
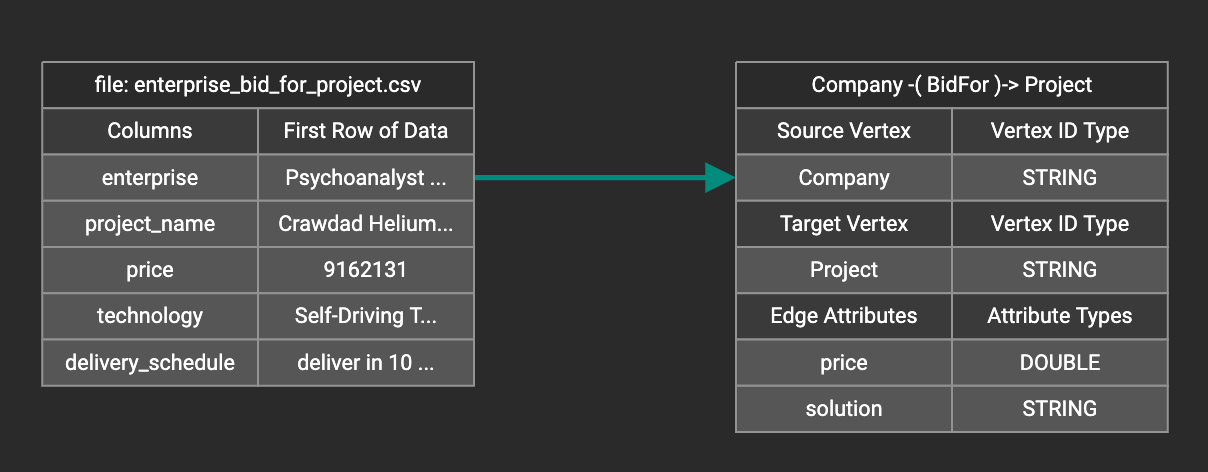
In this step, you link particular columns of a data file to particular ids or attributes of a vertex type or edge type.
First, choose one data mapping from one data file to one vertex or edge type (represented as a dashed green link on the left working panel).
When selected, the dashed line becomes orange (active), and the right working panel will show two tables with the data file and target vertex or edge fields.
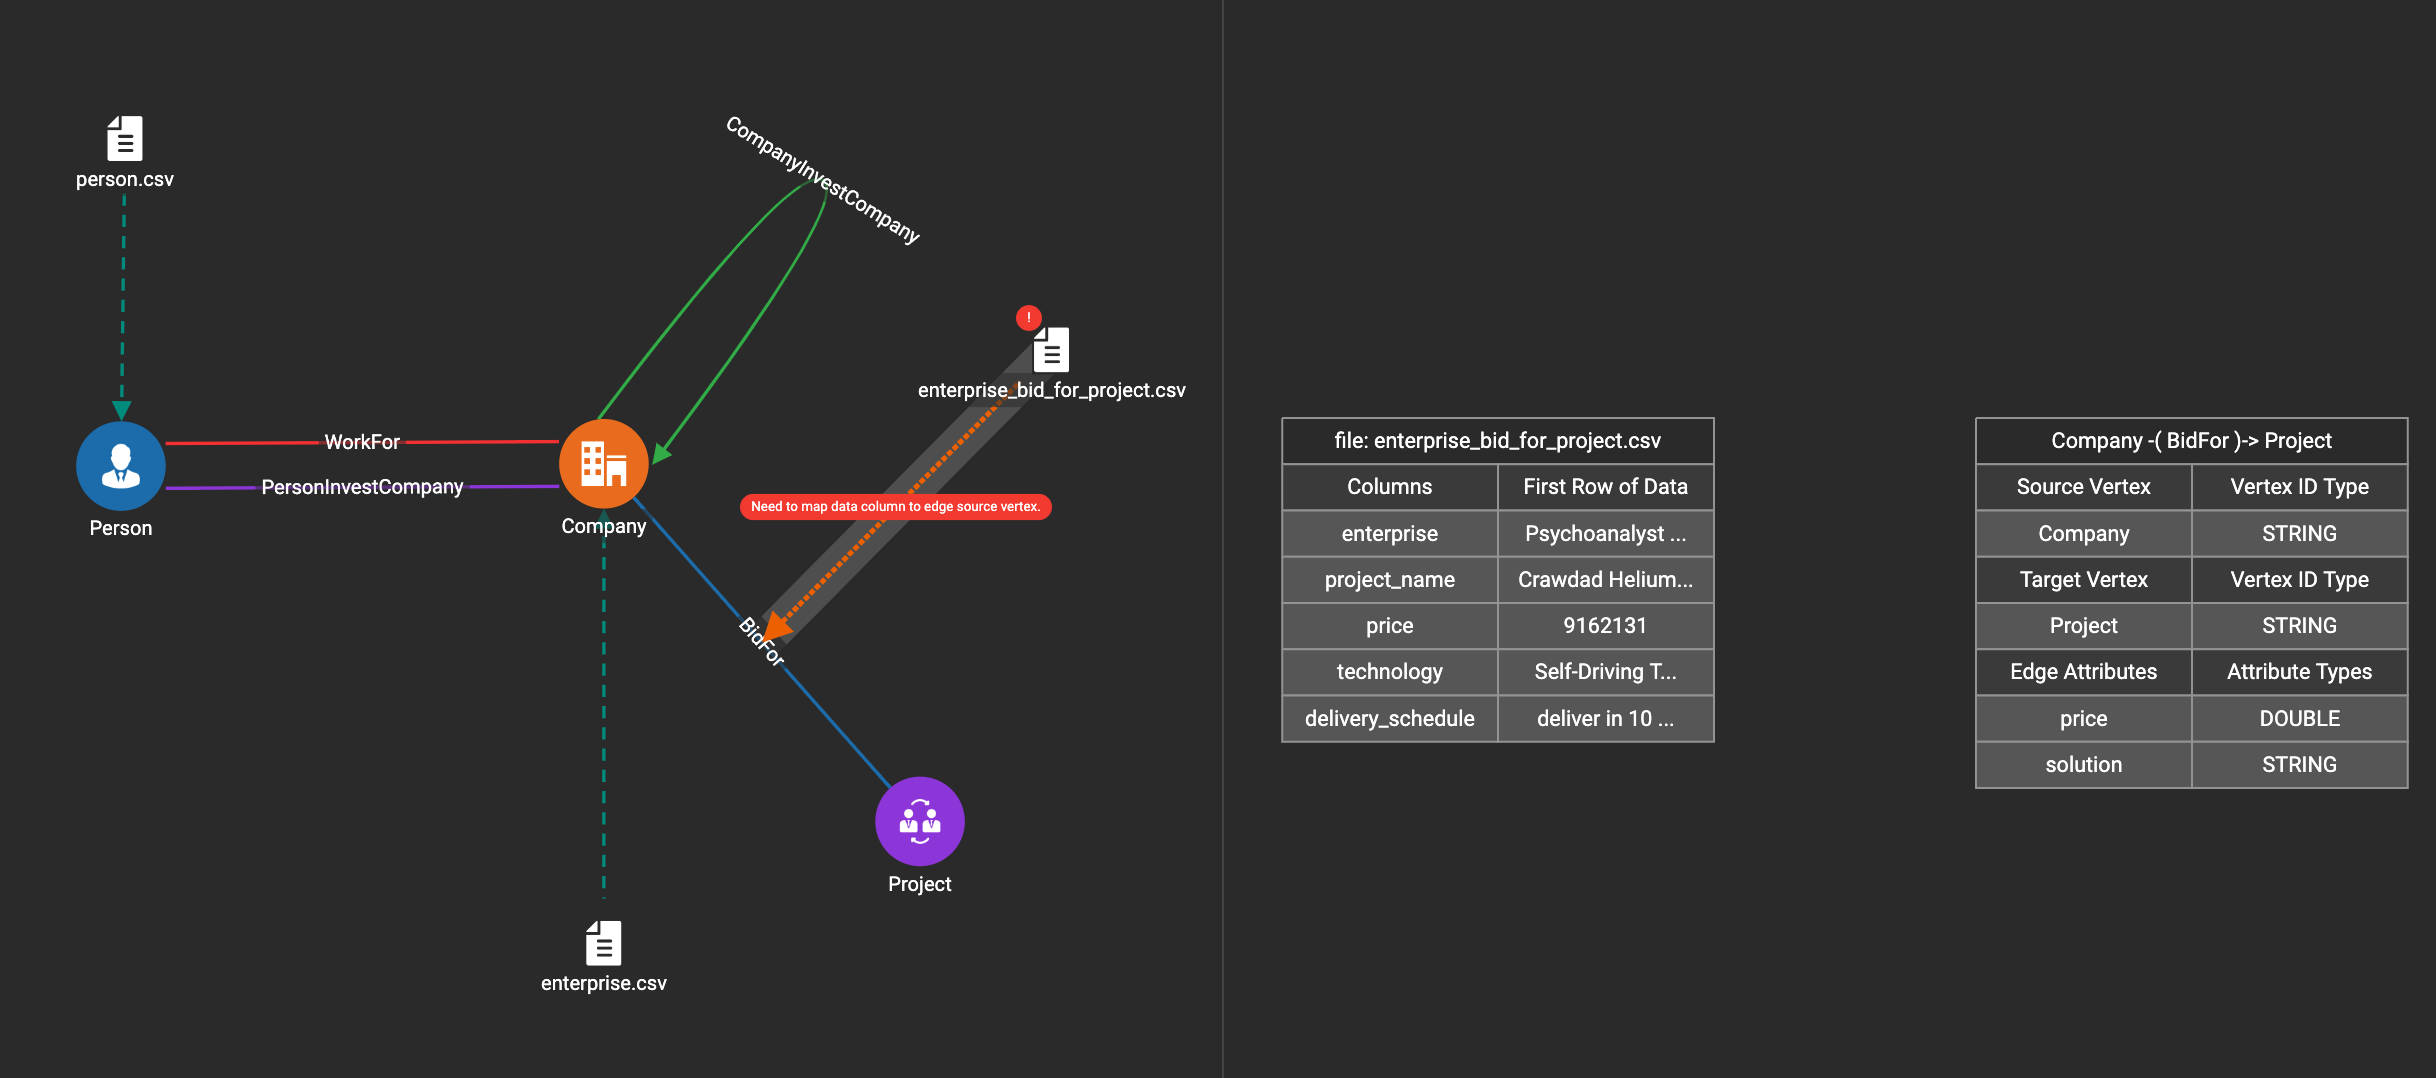
Drag and drop from the left table to the right table to map the attributes to a target field. The left table contains the CSV columns or JSON keys. The target field is either an attribute of the vertex/edge, a primary id for a vertex, or a source and target id for an edge.
A green arrow appears to show the mapping.
Repeat as needed to create all the mappings for this table-to-vertex/edge pair. Since many-to-one mapping is allowed, it is not necessary for one table to provide a mapping for every field in the target vertex/edge.
| Data must be loaded for all Discriminator attributes on an edge. Edges cannot have Discriminator attributes with no data loaded to them. |
Advanced data transformation
See the page on Data Transformation for information about making changes to the data during the loading process.
Data transformation includes token functions, data filtering (equivalent to a WHERE clause during data loading), and mapping data to Map type attributes.
Auto mapping
If the data file columns and the vertex/edge attributes have very similar names (only capitalization and hyphen differences), click the auto mapping button  .
All matching or similar columns will be mapped automatically.
.
All matching or similar columns will be mapped automatically.
Undo and redo
You can undo or redo changes by clicking the Back or Forward buttons in the toolbar:  .
The whole history since the time you entered the Map Data To Graph page is recorded.
.
The whole history since the time you entered the Map Data To Graph page is recorded.
Delete options
In the Map Data To Graph page, you can delete anything that you added, including data files, mapping between files and vertices/edges, mapping between data columns and vertex/edge attributes, and token functions.
Choose what you want to delete, then click the delete
button  . Press the
"Shift" key to select multiple icons you want to delete. Note that you
cannot delete vertex or edge types in this page.
. Press the
"Shift" key to select multiple icons you want to delete. Note that you
cannot delete vertex or edge types in this page.
For example, to delete a data file mapping, select the dashed green link(s) between the data file and the vertex/edge type, then click the delete button.
If you remove a file from the server, you also need to manually remove data mapping using that file. Otherwise, a "file not on server" error will be triggered when loading data.
