Queries
The Query monitoring page gives detailed information about the queries running on a cluster and their performance.
Overview
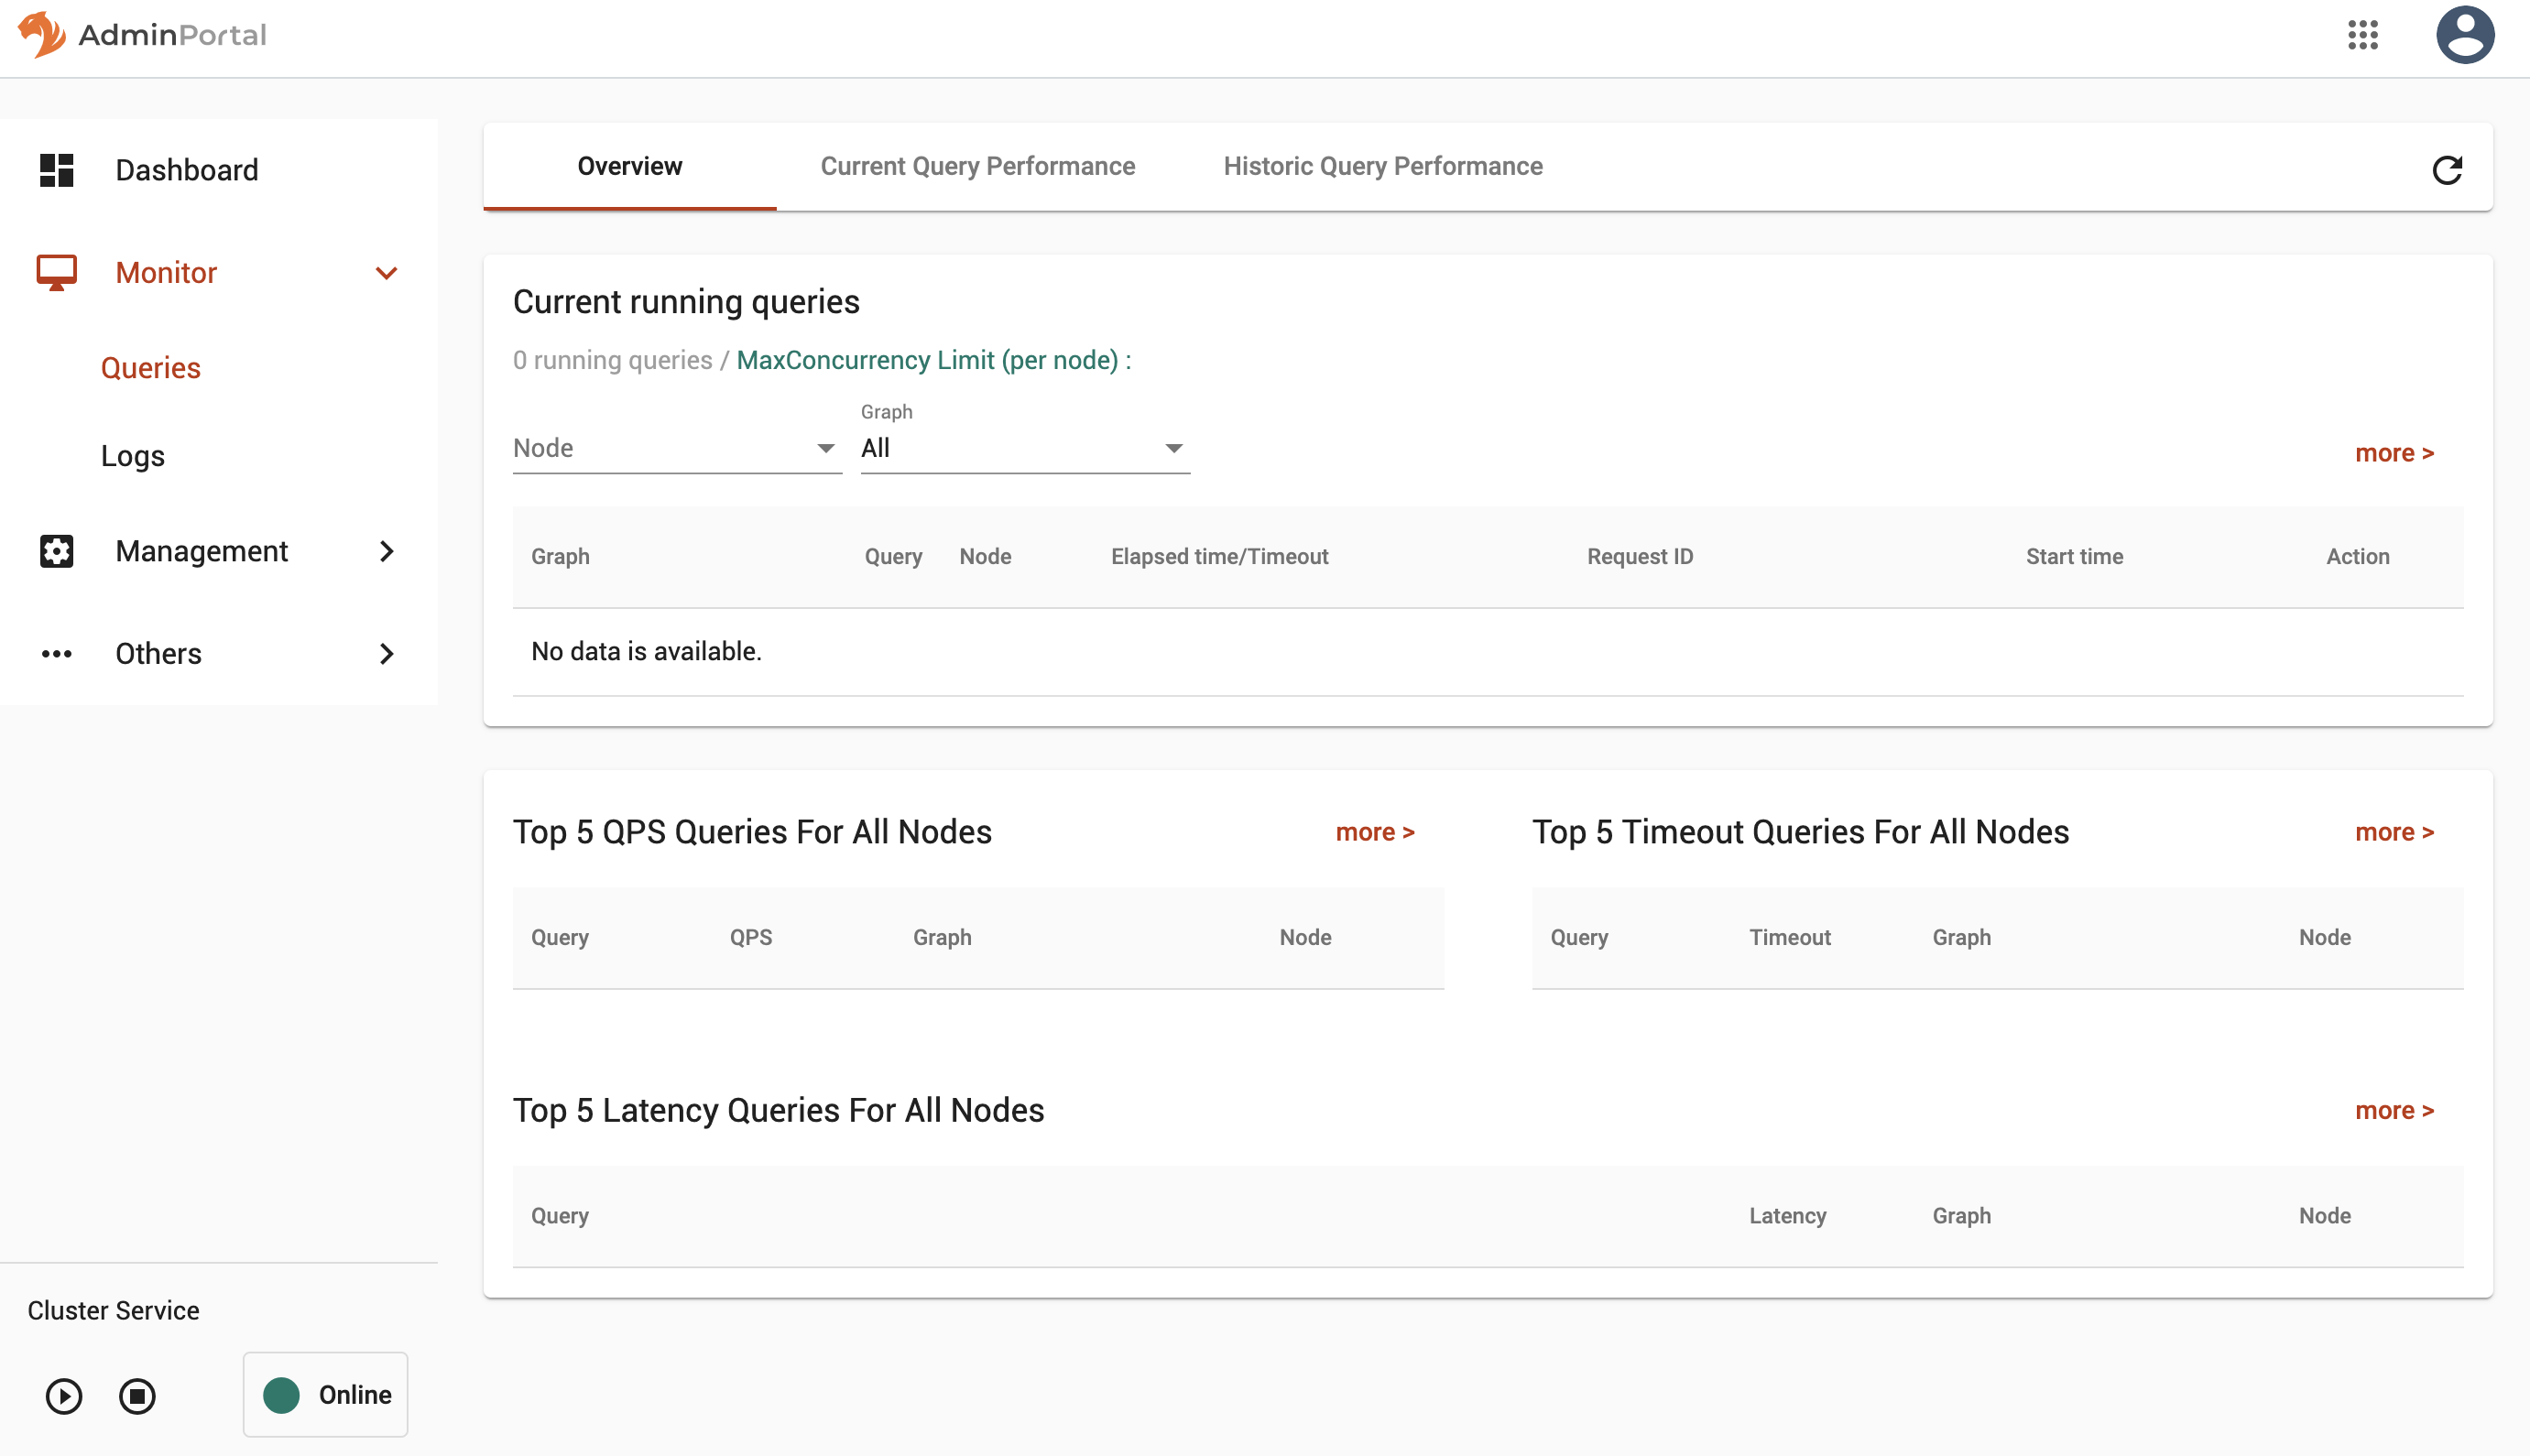
In the Overview tab, you can view currently running queries broken down by node and graph. In the Action column for each query, there are buttons to view the individual query history and to stop the query entirely.
You can also the top queries ranked by QPS (queries per second), timeout (fraction of the query calls which timed out and therefore did not finish), and latency (minimum, maximum, and average time to complete a query).
The sections in the Overview tab show the queries in each section over the last fifteen minutes.
At any point, click the Refresh icon in the upper right corner of the page to refresh the view with the latest statistics.