Monitor Workspaces
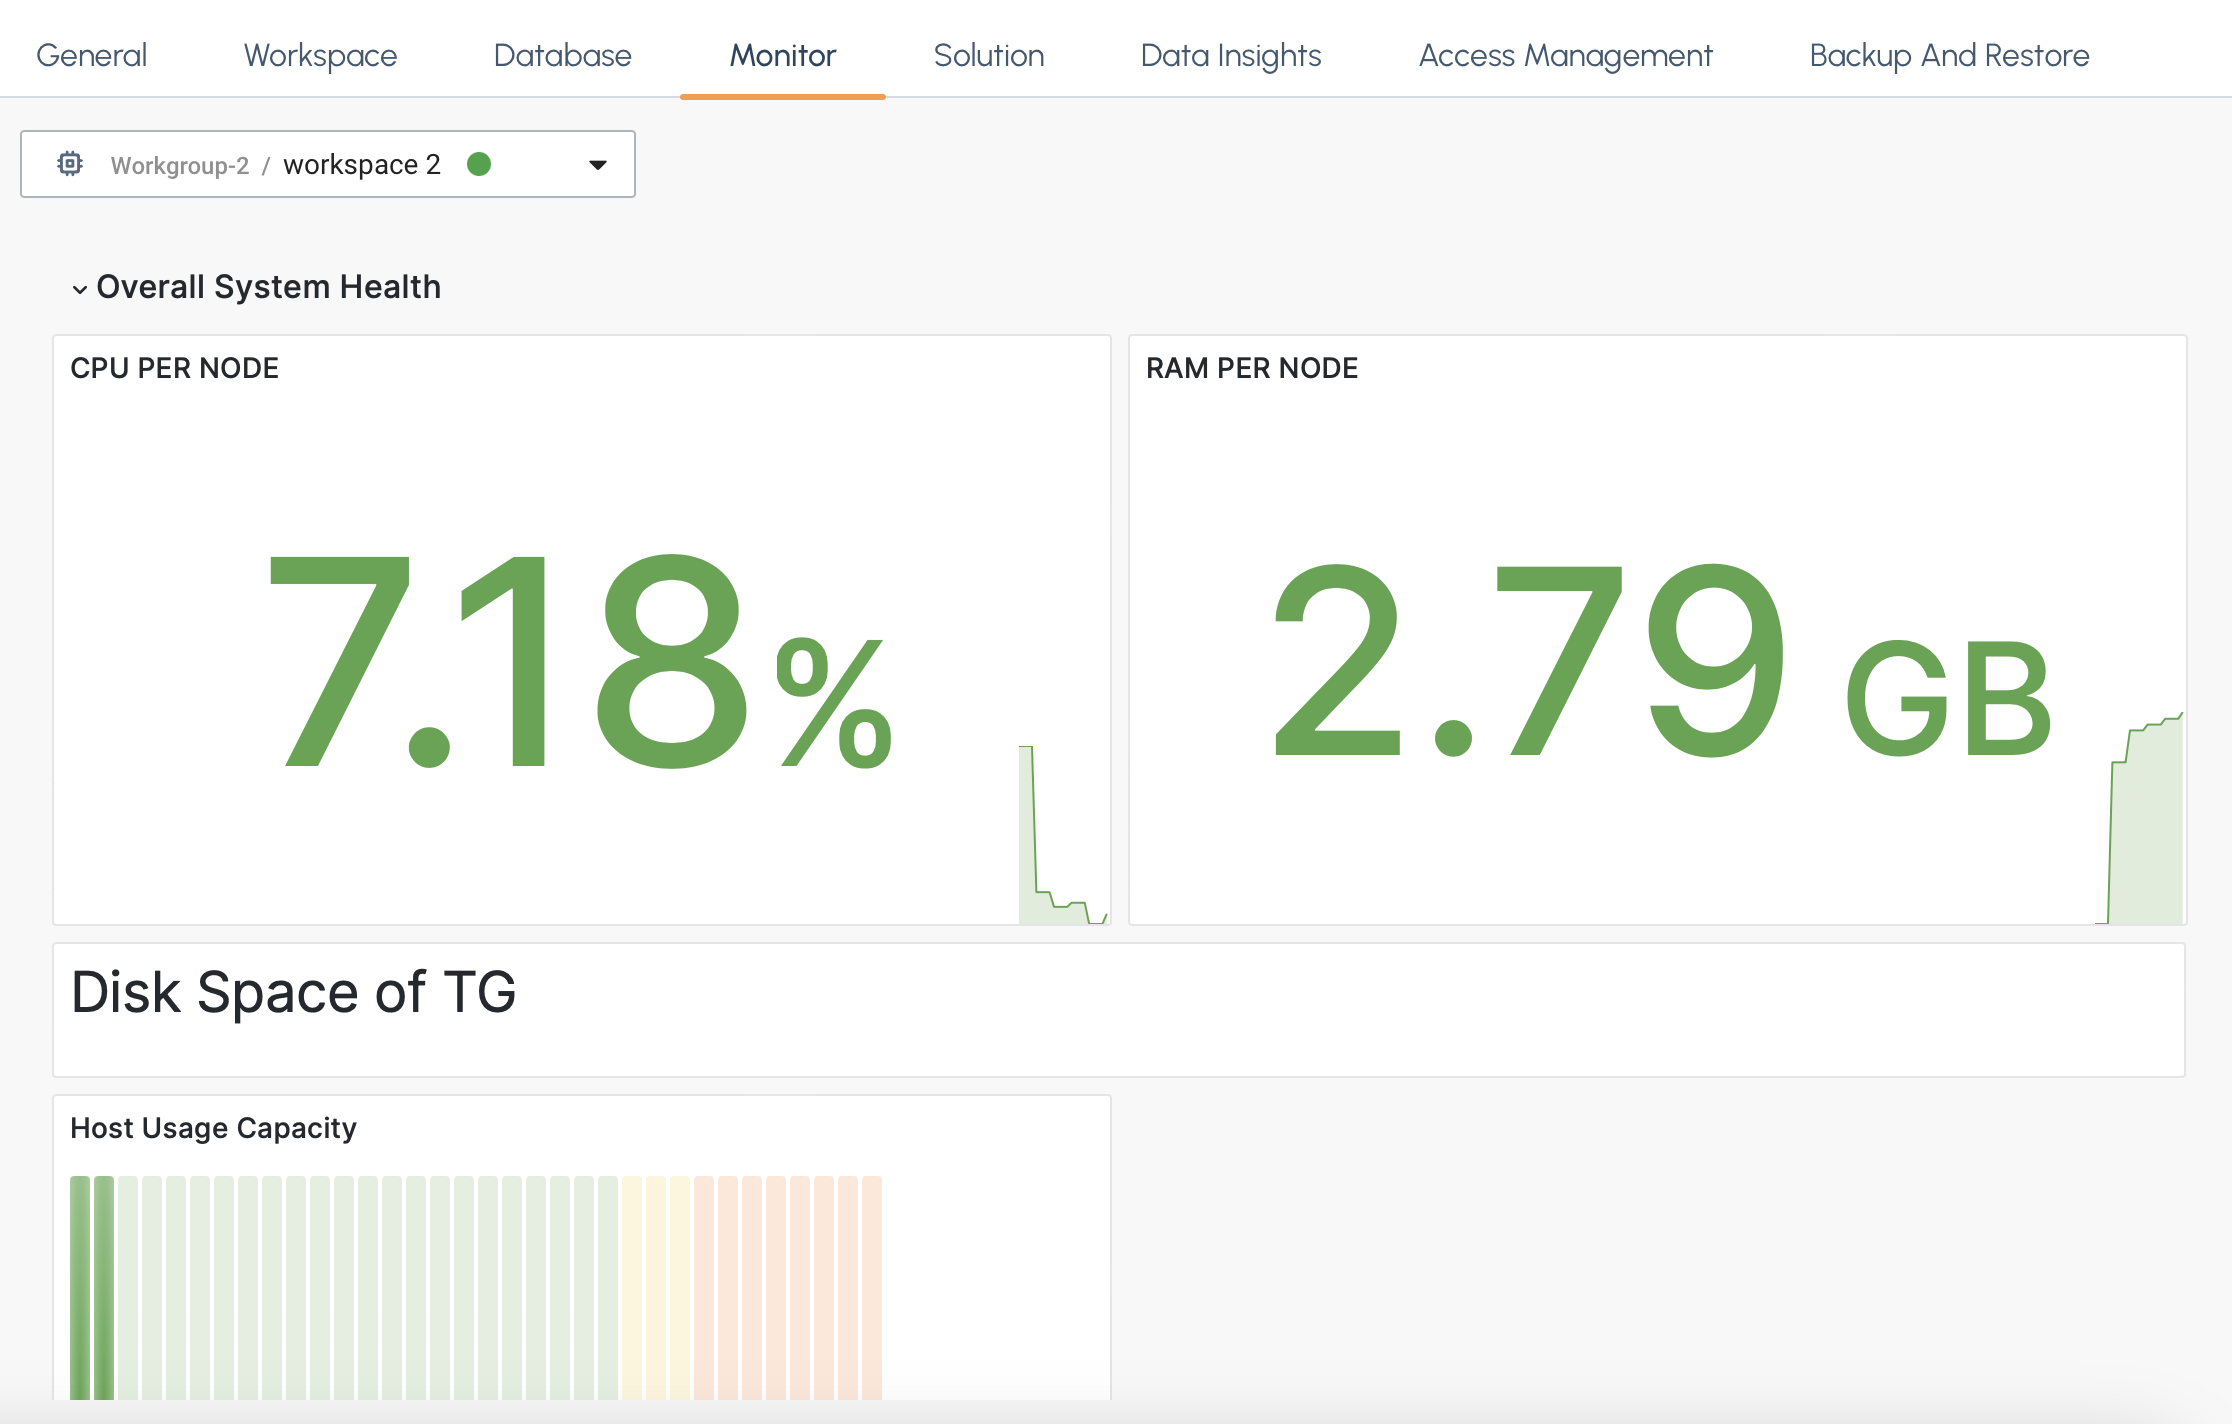
Monitoring the performance and health of your workspaces is essential for efficient operations. TigerGraph Savanna offers comprehensive monitoring capabilities that allow you to track the status and resource usage of your workspaces. You can monitor metrics such as CPU utilization, memory usage, and storage consumption, enabling you to optimize performance, identify bottlenecks, and ensure the smooth operation of TigerGraph databases using a Grafana dashboard.
How to Start Monitoring
-
Go to the
Monitortab on your workgroup dashboard.
-
Alternatively, go to the workspace … menu.

-
Click the
 button from the workspace menu to go to the Monitor tab and display the Grafana dashboard of your workspace.
Next Steps
Next, Learn how to Load Data into TigerGraph Savanna.
Return to the Workgroups and Workspaces page or Overview page for a different topic.