Graph Widget
The Graph widget is very similar to the graph visualizer tool in GraphStudio. It allows you to display the relationships between vertices in a single widget based on a specified query.
You can also run GSQL queries in this graph window. Please note that the queries are all run in interpreted mode, in which not all GSQL query features are available.
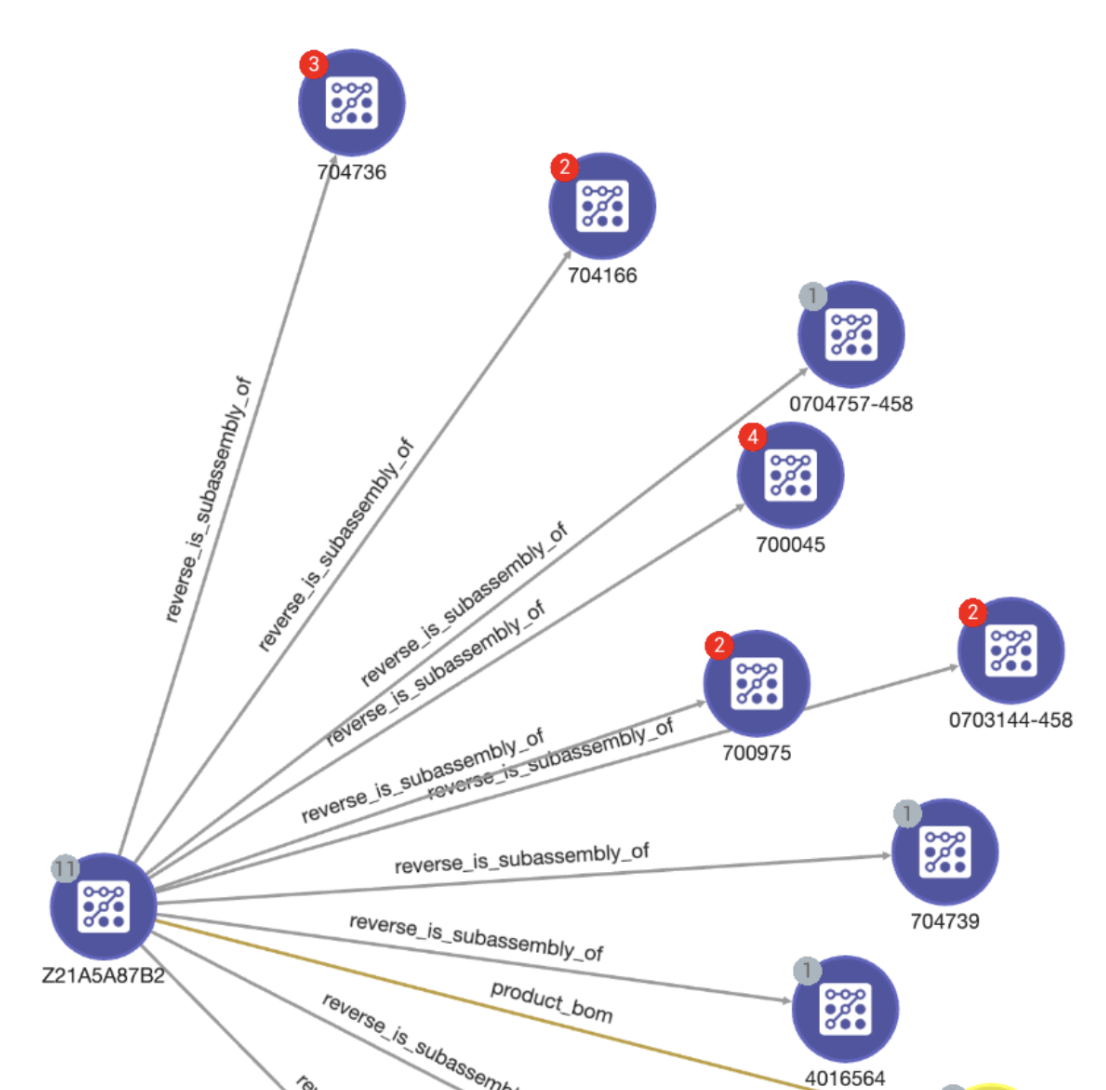
Widget window
View details
The tools on the left menu allow you to examine a single vertex or edge in detail. With the vertex or edge selected, these buttons have the following functions, from top to bottom:
-
Show graph nodes/edges information in tabular format. Click on any node or edge and the viewport will center on it.
-
Run a graph algorithm (see the [graph-algorithms] section).
-
Save the current graph view to your computer as an image.
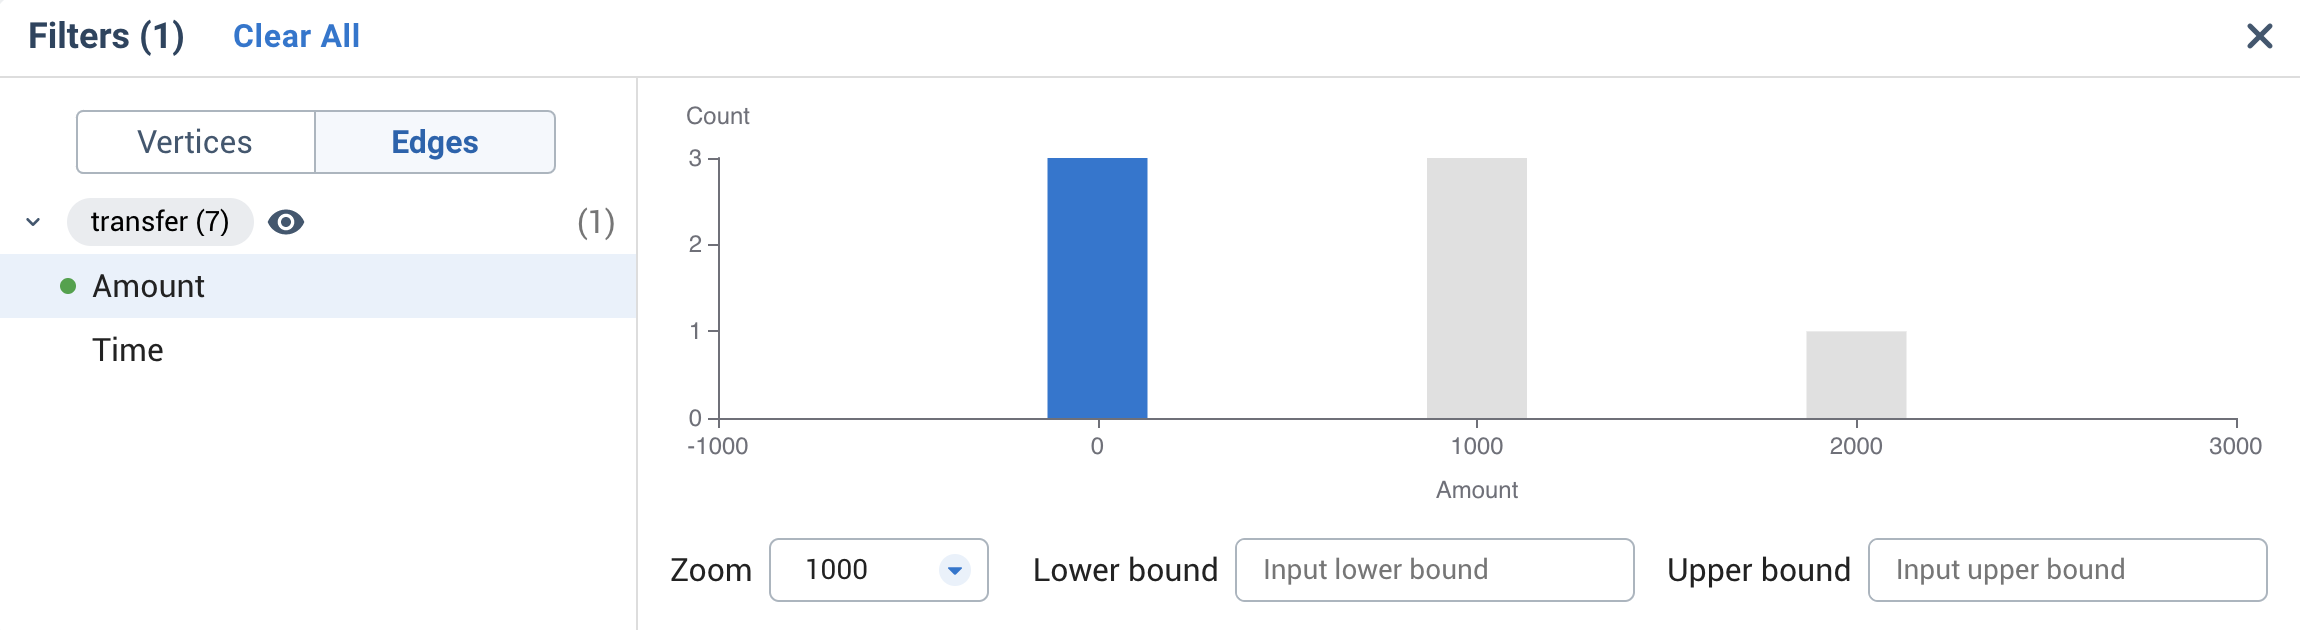
Filter
The bottom left icon brings up a filter menu that allows you to filter the displayed results by different qualities of the vertex or edge.
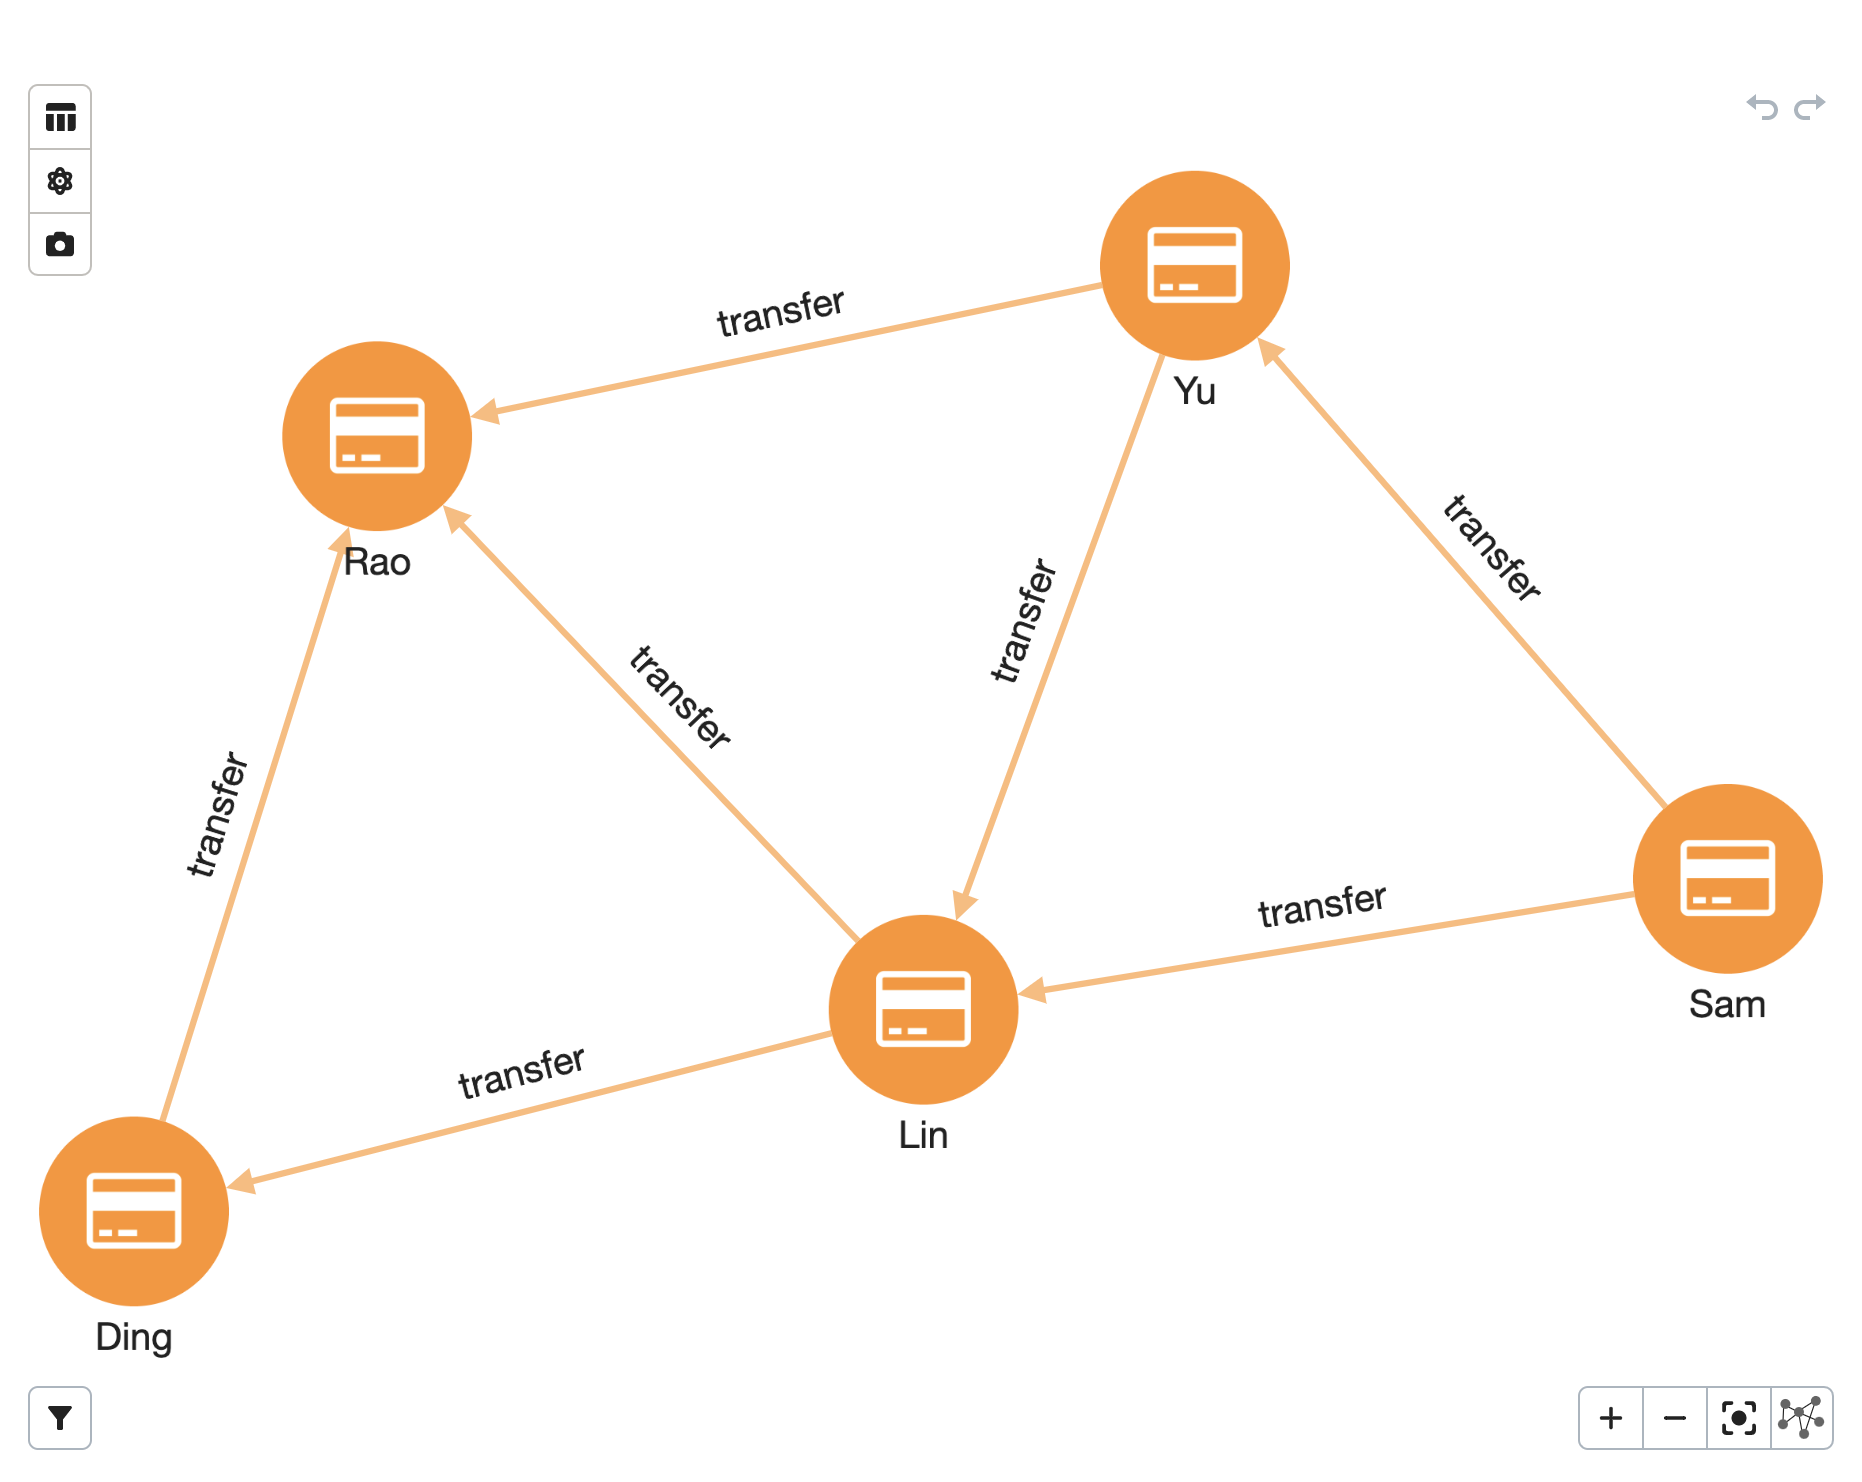
In this example, we create a filter to only show edges with amounts between -500 and 500.
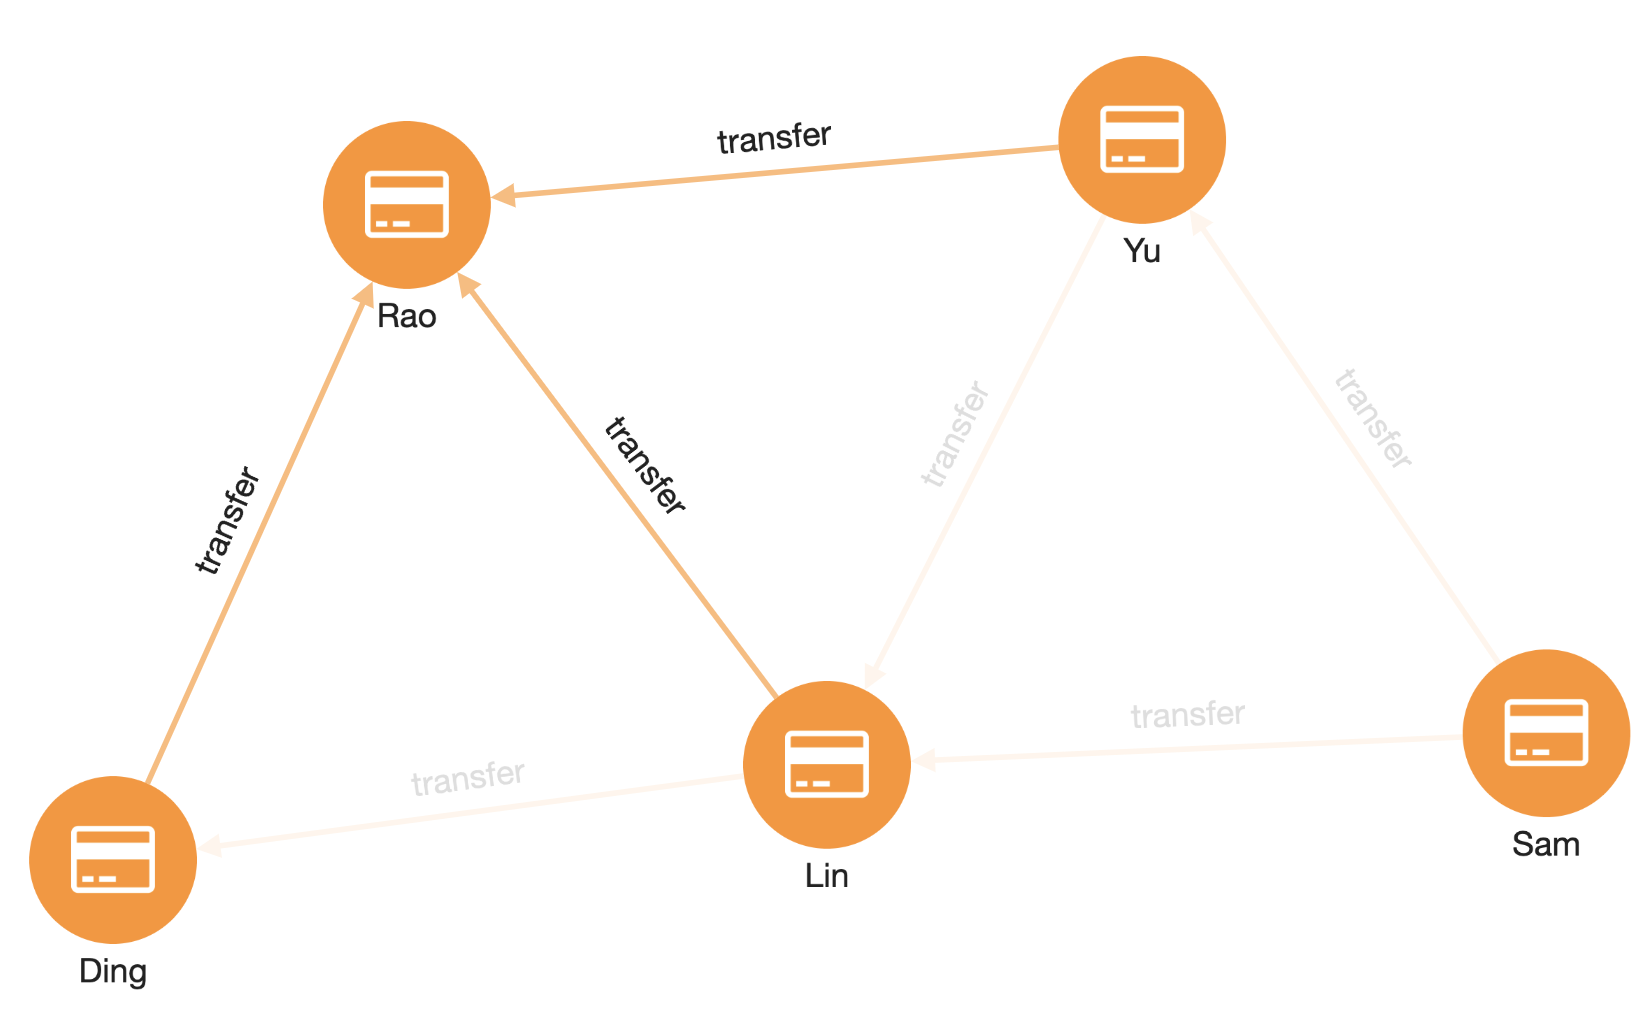
After the filter is applied, edges that have transfer amounts over 500 are reduced in visibility. No data is removed from the graph.
Patterns and queries
The search bar at the top allows you to show graph results from no-code pattern searches or from interpreted GSQL queries.
Pattern search
In this example, we use a sample graph called social from the GSQL 101 TigerGraph Cloud Starter Kit.
Click on the search bar and select different types of vertices or edges to see patterns.
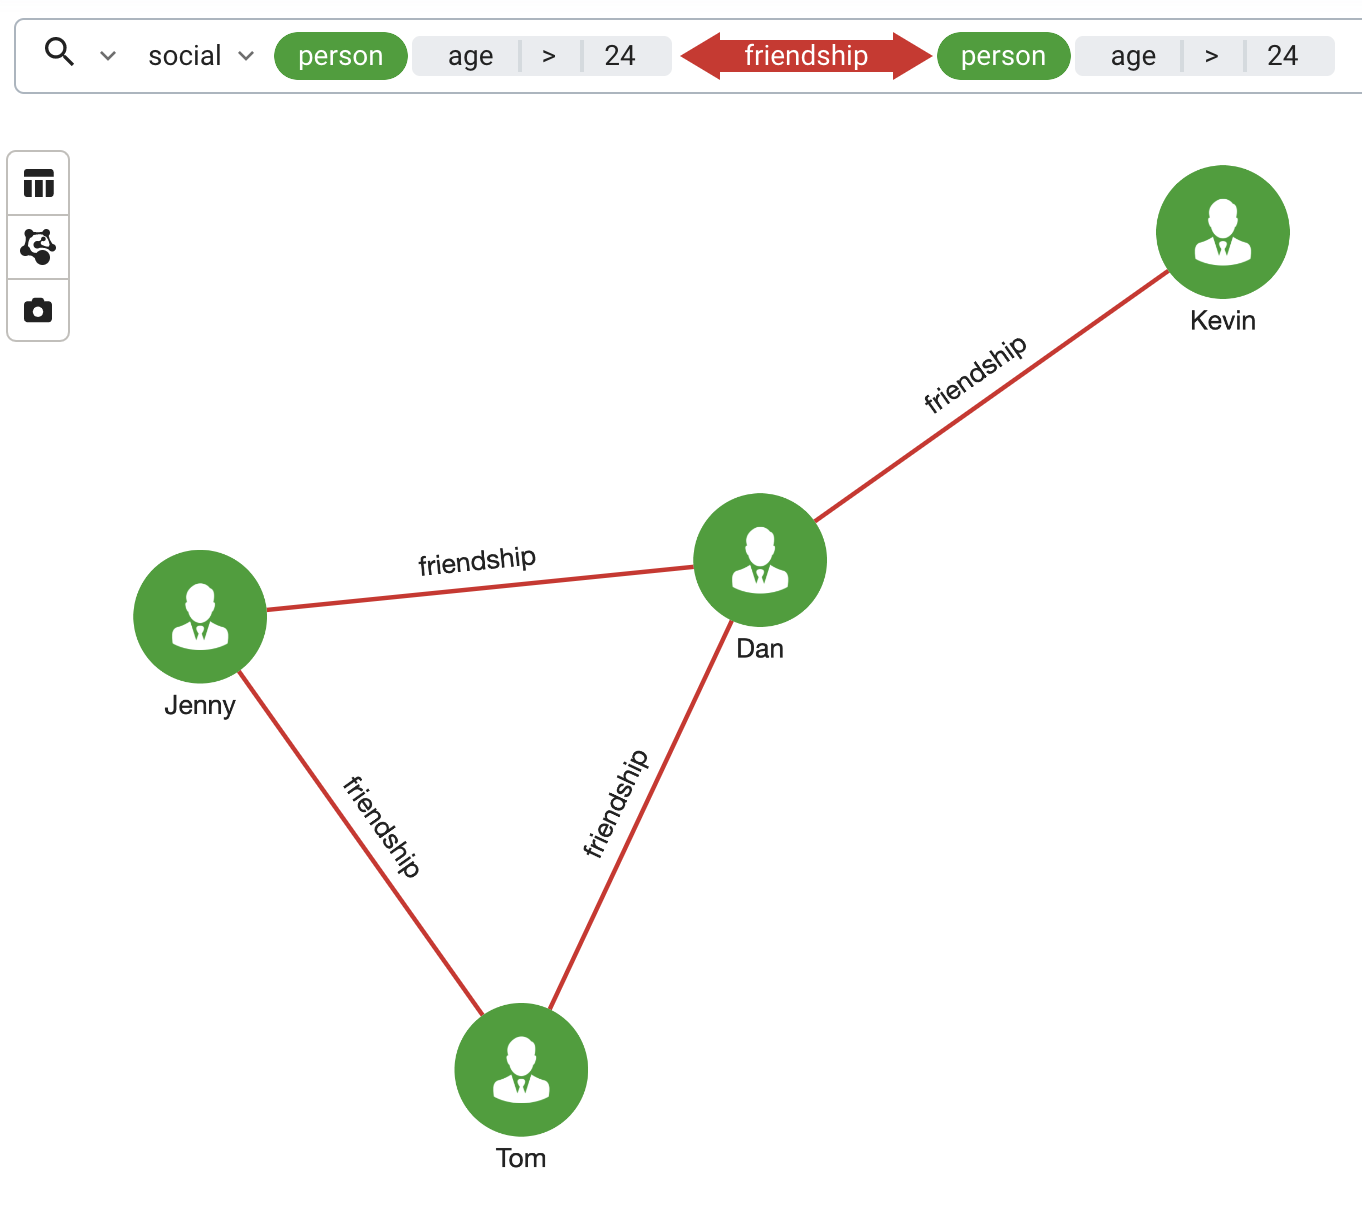
If your vertices and edges have several attributes, you can add a filter to limit the results.
This is equivalent to adding a WHERE clause in GSQL.
In this example, we added filters after both person vertex options in the pattern.
This allows us to show only friendships between people who are both over 24 years old.
Creating a zero-code graph pattern search like this actually creates a GSQL query behind the scenes. Click the gear icon the right of the search bar and choose Copy generated query to clipboard, then paste it elsewhere to see how it was done.
GSQL query
If you would rather write your own GSQL query rather than searching for a pattern, click the magnifying glass icon to the left of the search bar to switch to the GSQL Query input option.
From there, you can write a GSQL query and view the results visualized in the Graph View. Try pasting in the generated GSQL query from your pattern view. You should see exactly the same results.
Try following along with the queries in GSQL 101 using the same small friendship graph. Remember that Insights only works with GSQL queries in Interpreted mode.
Pathfinding
TigerGraph Insights includes a simple way to run pathfinding detection algorithms without writing a single query.
Click on a vertex to select it, then hold Shift and select another one.
Right-click on either selected vertex and choose Pathfinding. You can choose to show one shortest path or all shortest paths.
Graph algorithms
The Graph widget integrates some of the Graph Data Science Library algorithms.
The following algorithms are supported:
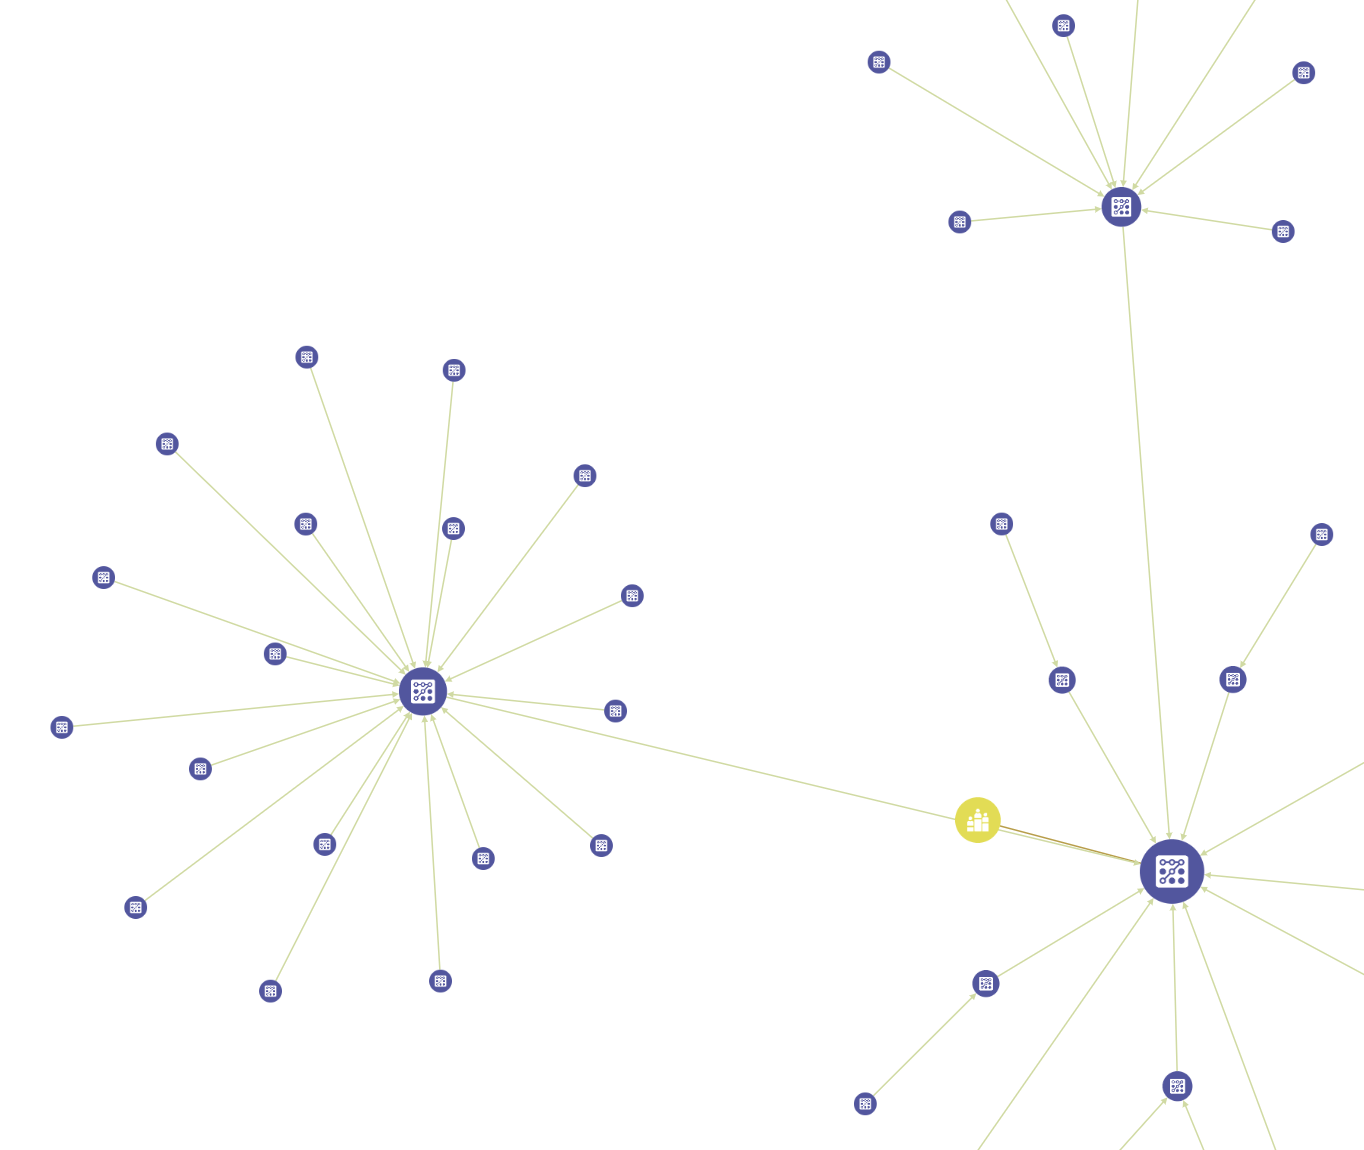
PageRank
Use PageRank to determine which vertices have the most influence in the graph. When the algorithm finishes, more influential vertices appear larger.
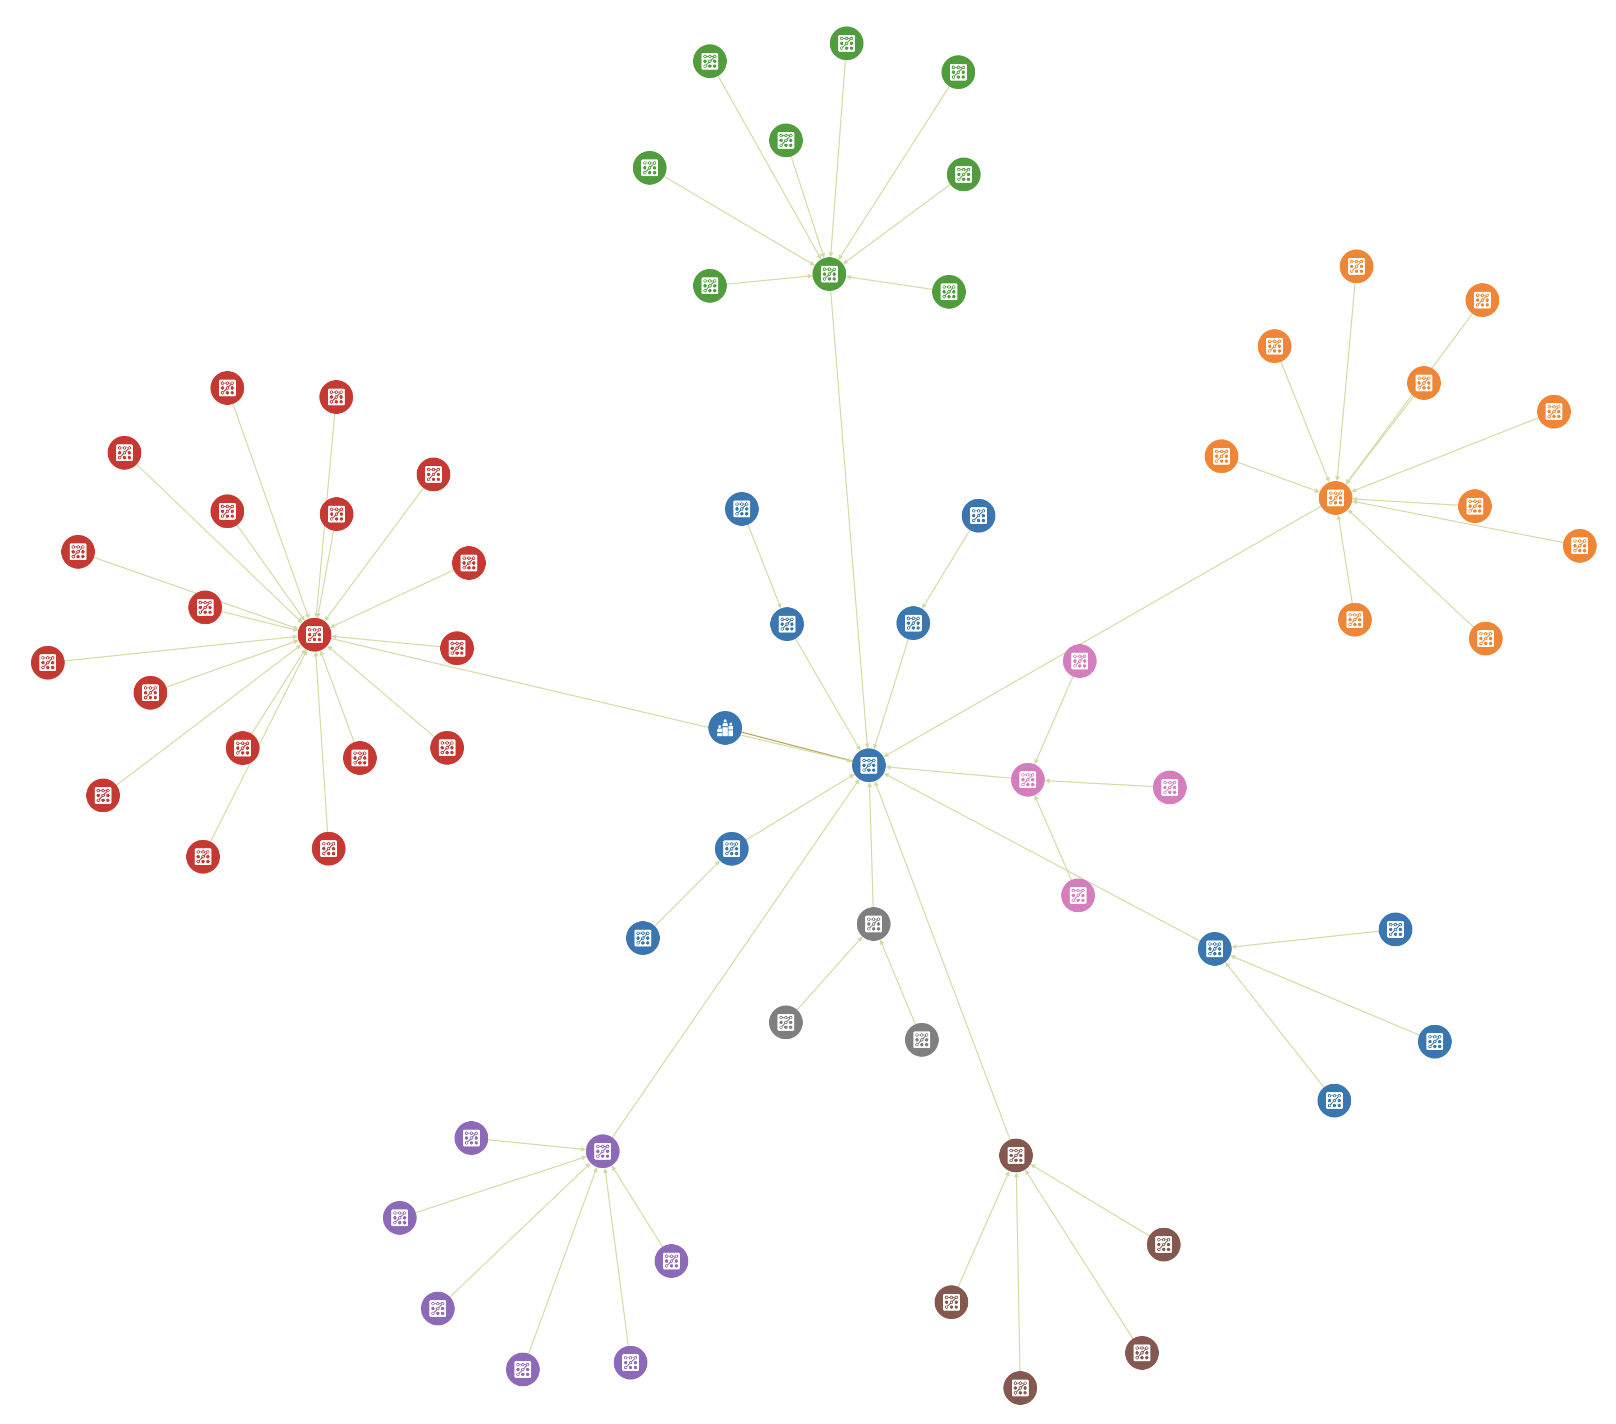
Louvain
Use Louvain to determine which vertices belong to different communities. When the algorithm finishes, the vertices are color-coded by community.