Graph Widget
The Graph widget is very similar to the graph visualizer tool in GraphStudio. It allows you to display the relationships between vertices in a single widget based on a specified query.
You can also run GSQL queries in this graph window. Please note that the queries are all run in interpreted mode, in which not all GSQL query features are available.
Widget window
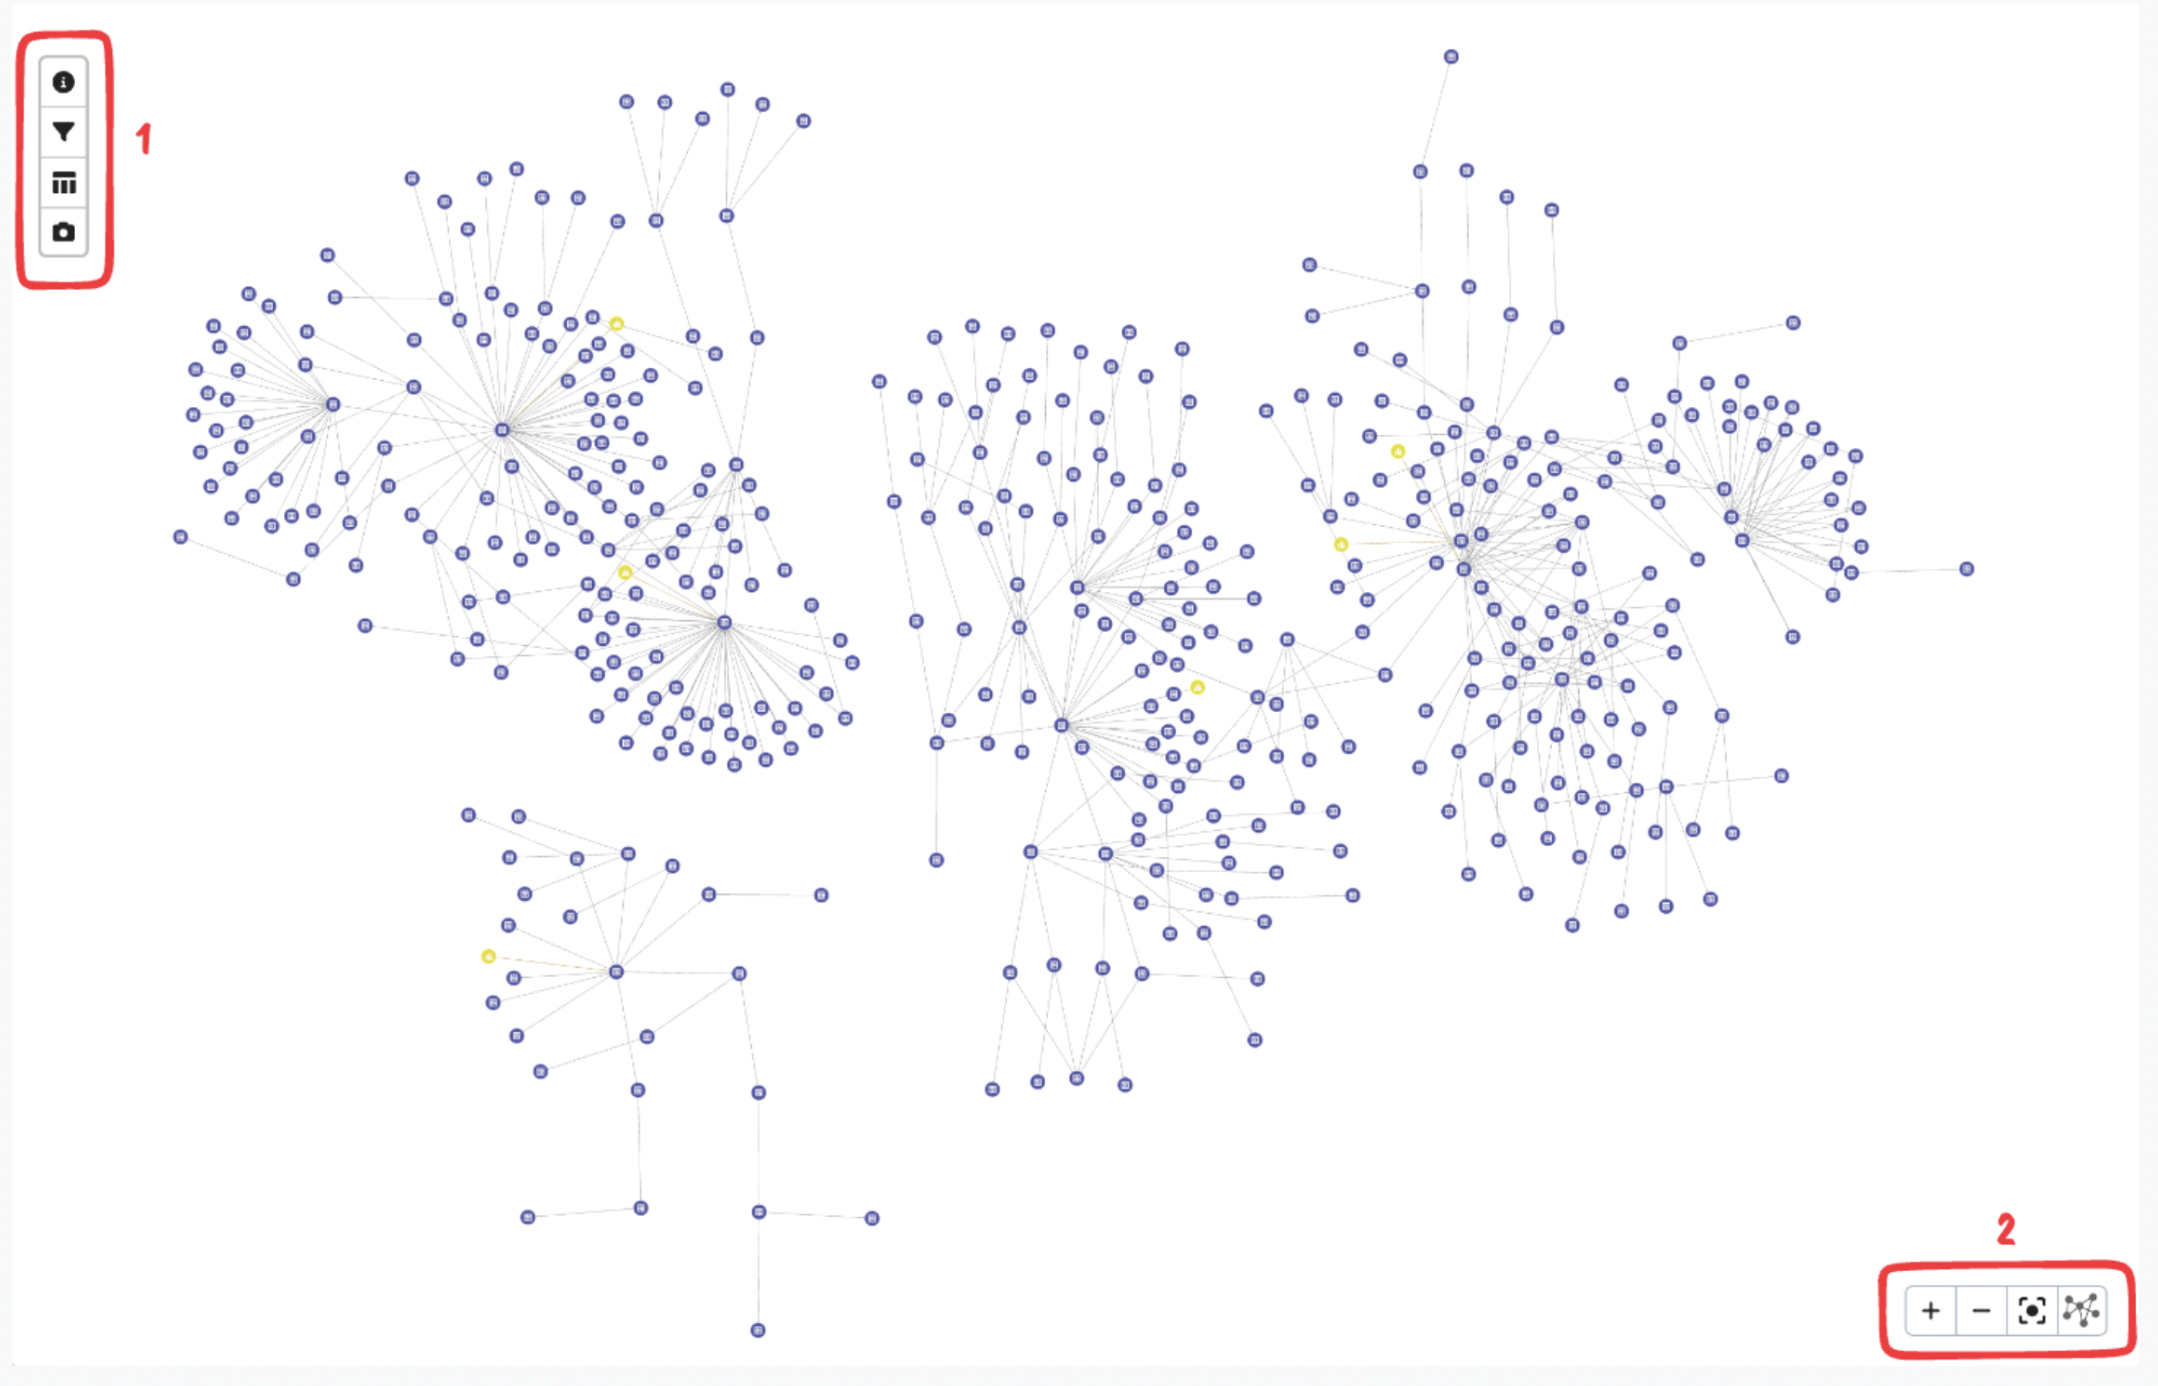
The tools on the left menu (labeled "1" in the diagram) allow you to examine a single vertex or edge in detail. With the vertex or edge selected, these buttons have the following functions, from top to bottom:
-
Show detailed information about the attributes of the currently selected node/edge.
-
Filter graph by nodes/vertices.
-
Show graph nodes/edges information in tabular format. Click on any node or edge and the viewport will center on it.
-
Save the current graph view as an image. It is saved in the default Downloads directory as per your browser settings.
The tools on the bottom right (labeled "2" in the diagram) have the following functions from left to right:
-
Zoom in
-
Zoom out
-
Fit graph to view
-
Change graph layout
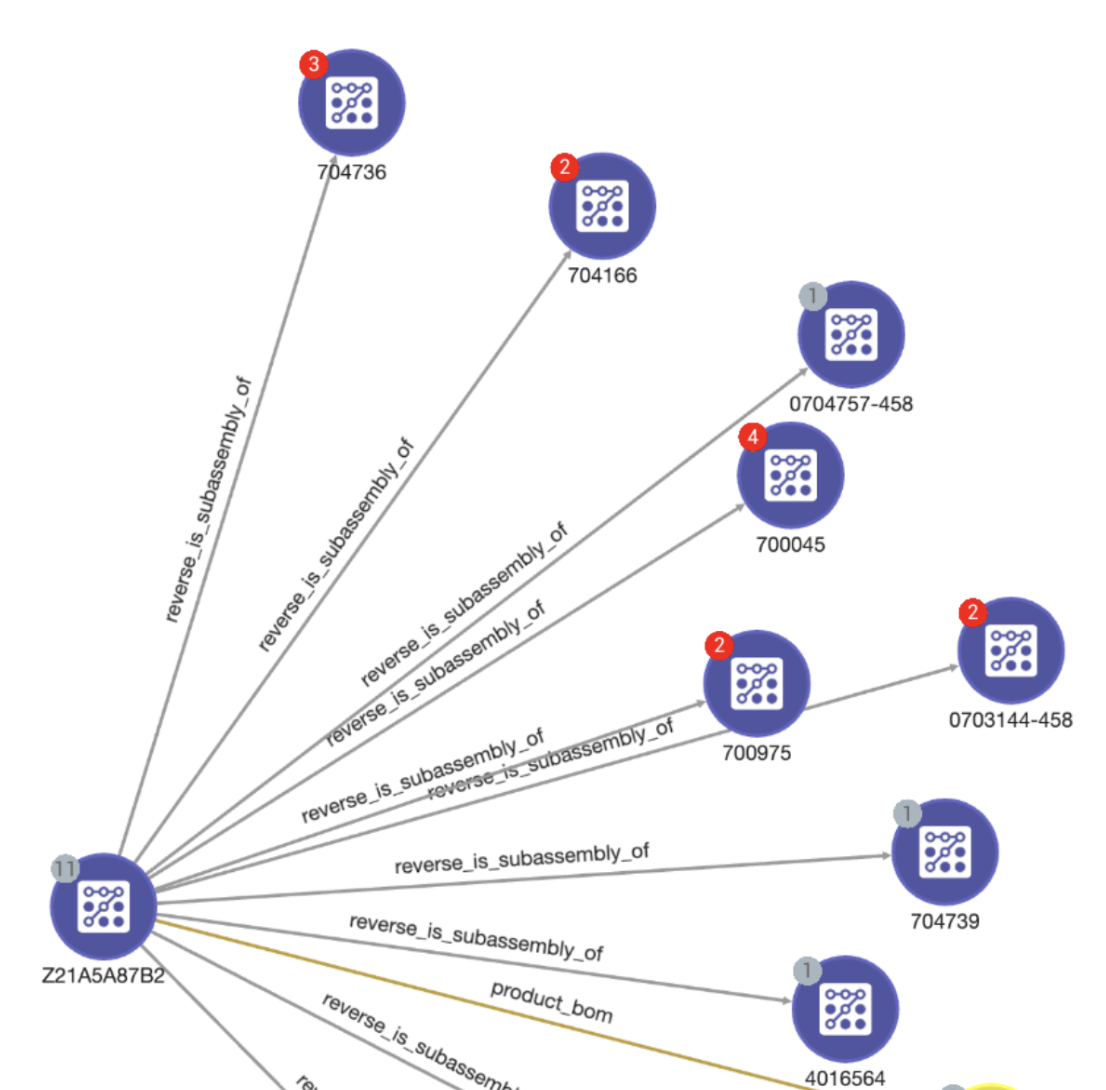
To save display space, some vertices have a small red number next to them. Double-click to expand them and reveal the full set of vertices.