Line Chart Widget
The Line Chart Widget displays a standard line chart that shows a trend in data over time.
Inputs
Accepts data as vertices and edges for a pattern search result.
For a GSQL query result, accepts a list of objects that contain at least one numeric attribute to be used as the height of the point.
Widget window
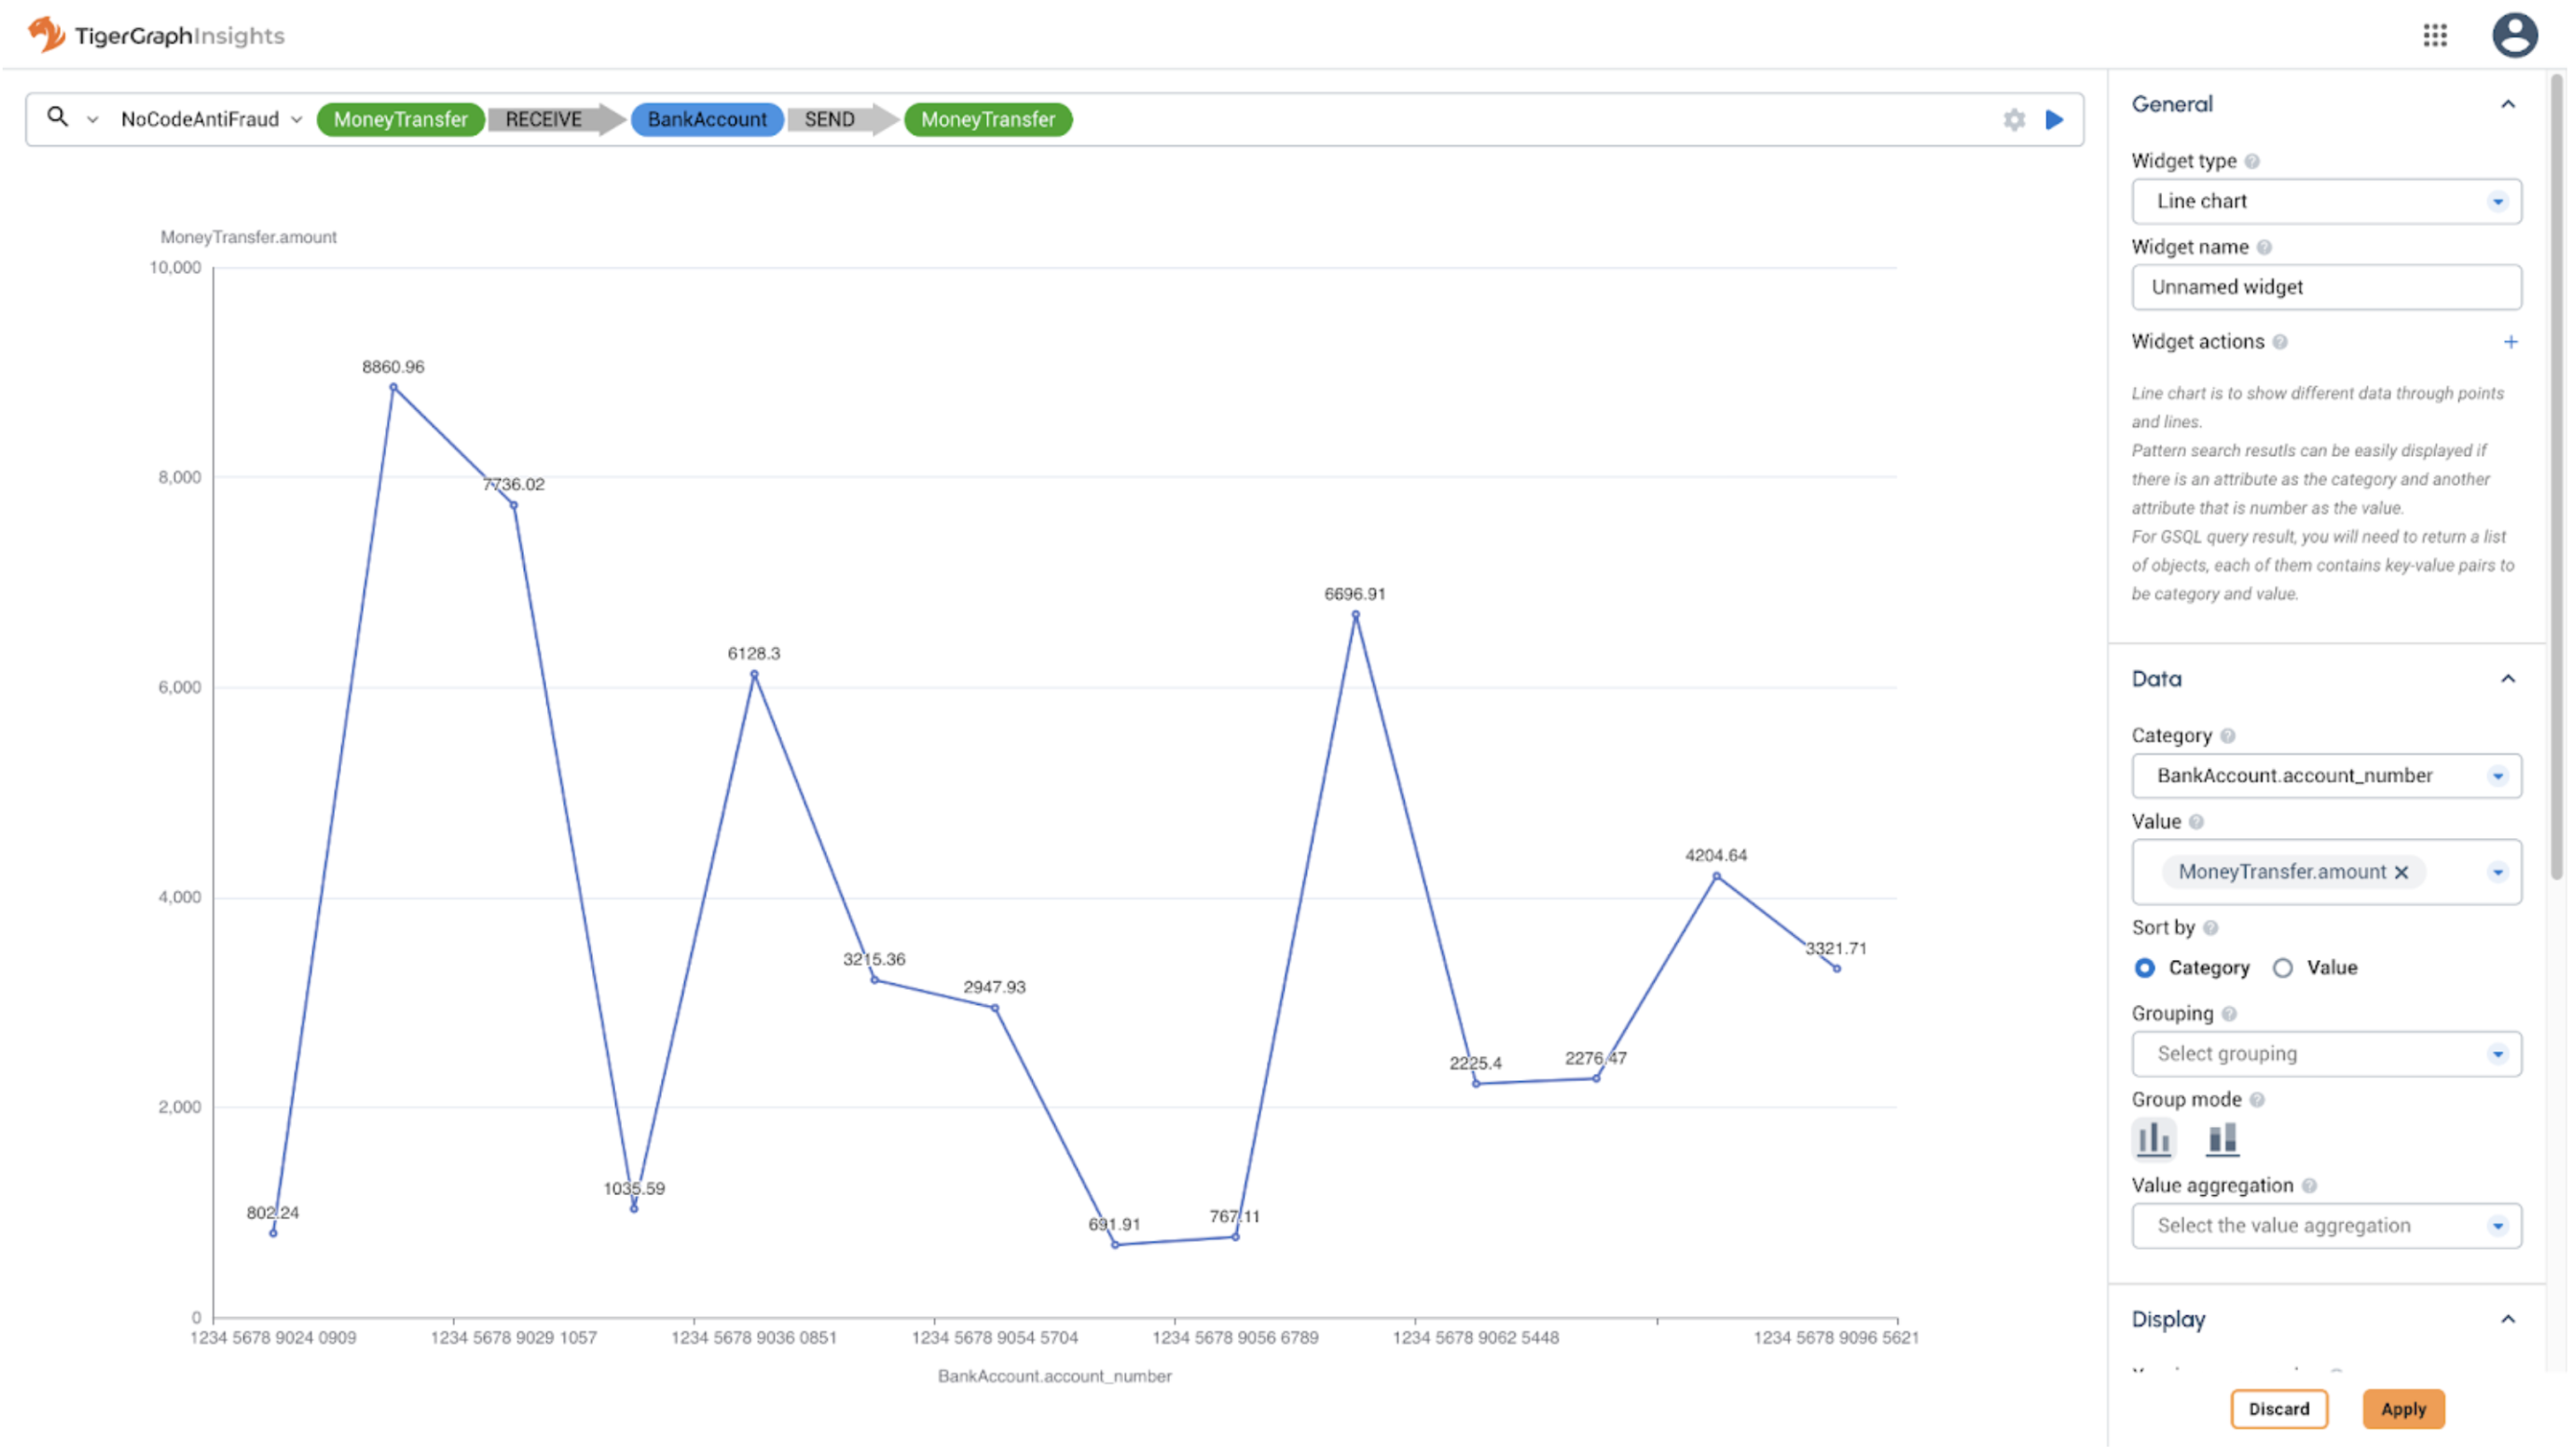
Sorting and grouping
Customize the category (the name of each bar) and one or more numeric values to display in each category.
Sort the data by the category name (alphabetical left to right) or value (increasing left to right).
Group data to combine vertices with the same category name.
Aggregate data with COUNT, AVG, SUM, MAX, and MIN functions.