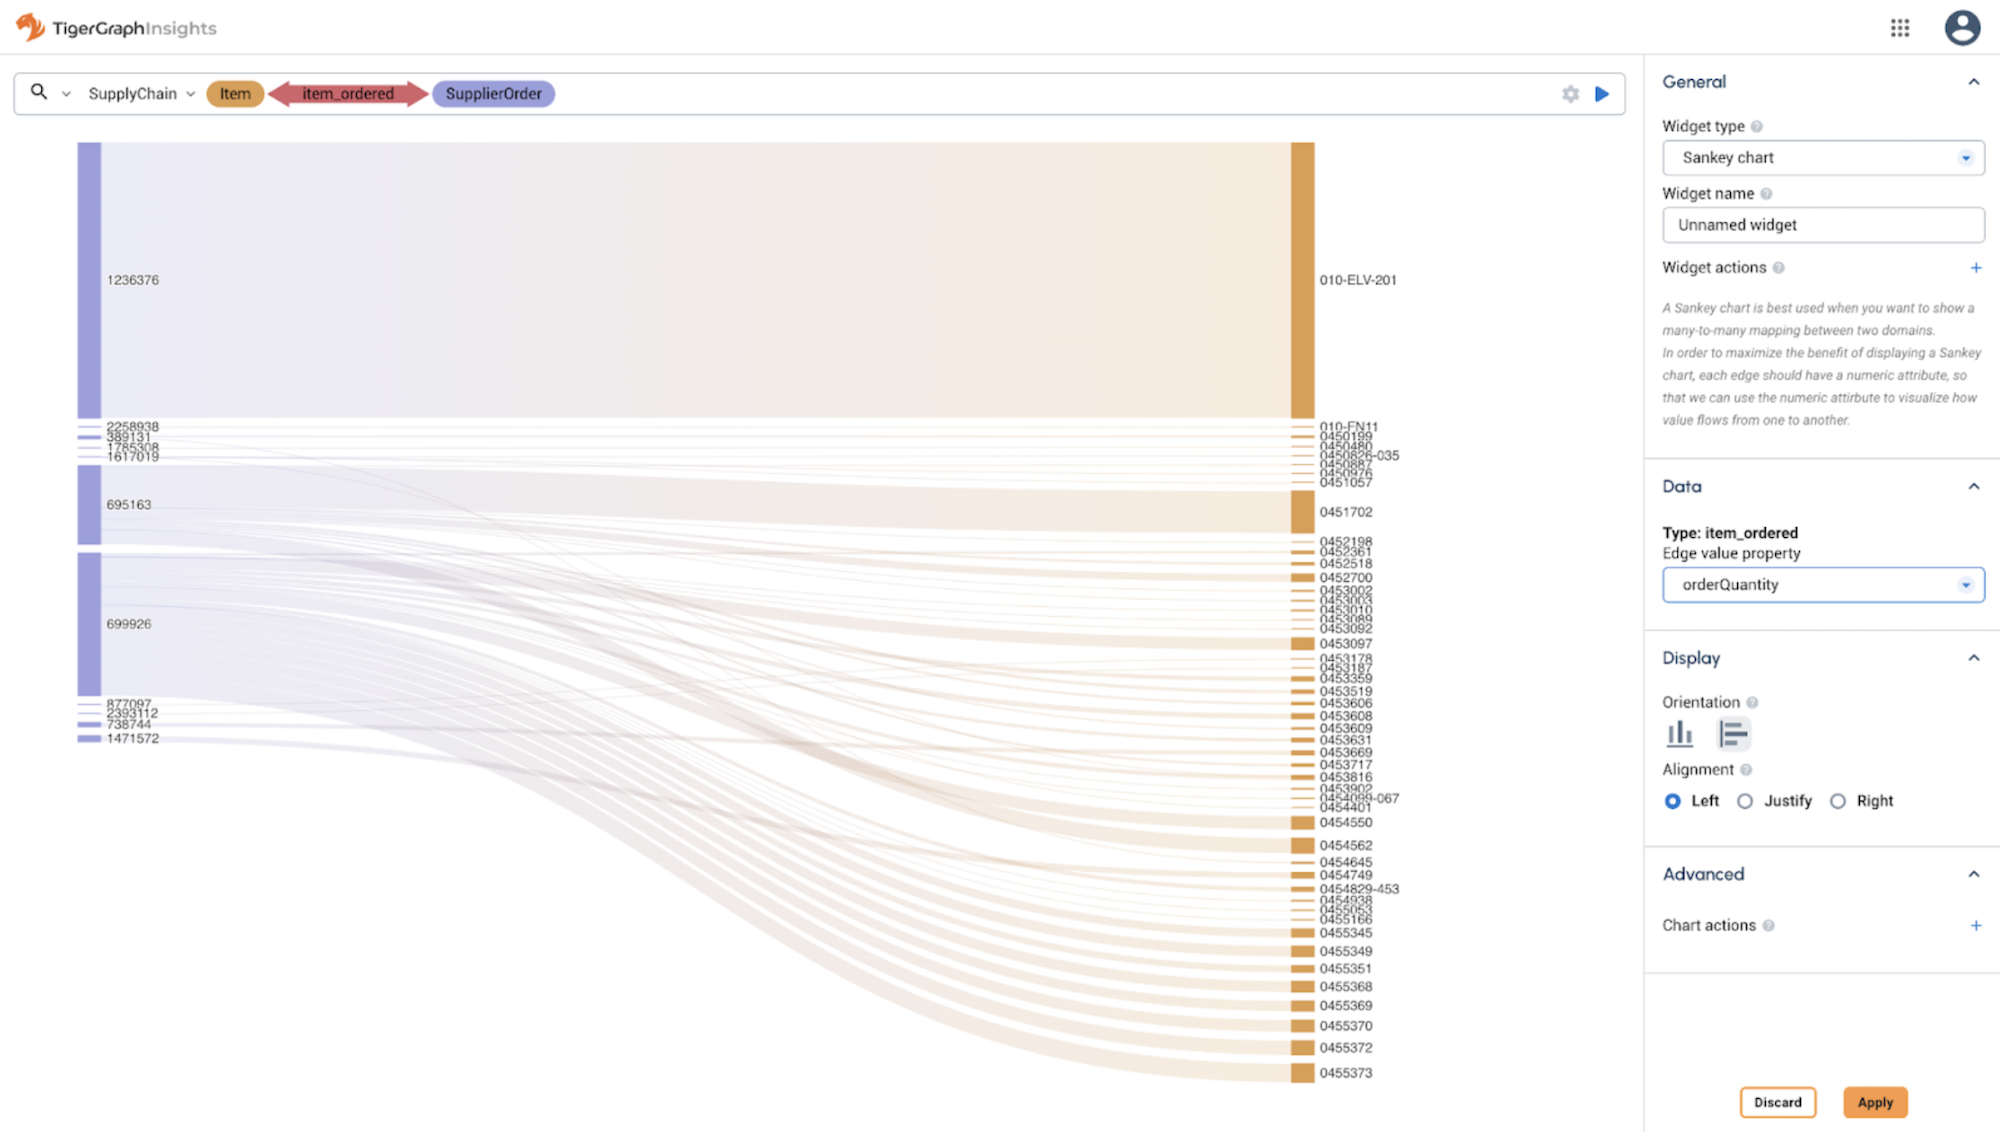
Sankey Chart Widget
The Sankey Chart Widget displays a Sankey chart showing proportional edge strength between different vertices.
A Sankey chart is similar to a regular Graph visualization, except that its focus is not on a web of connections but on how strong each connection is.
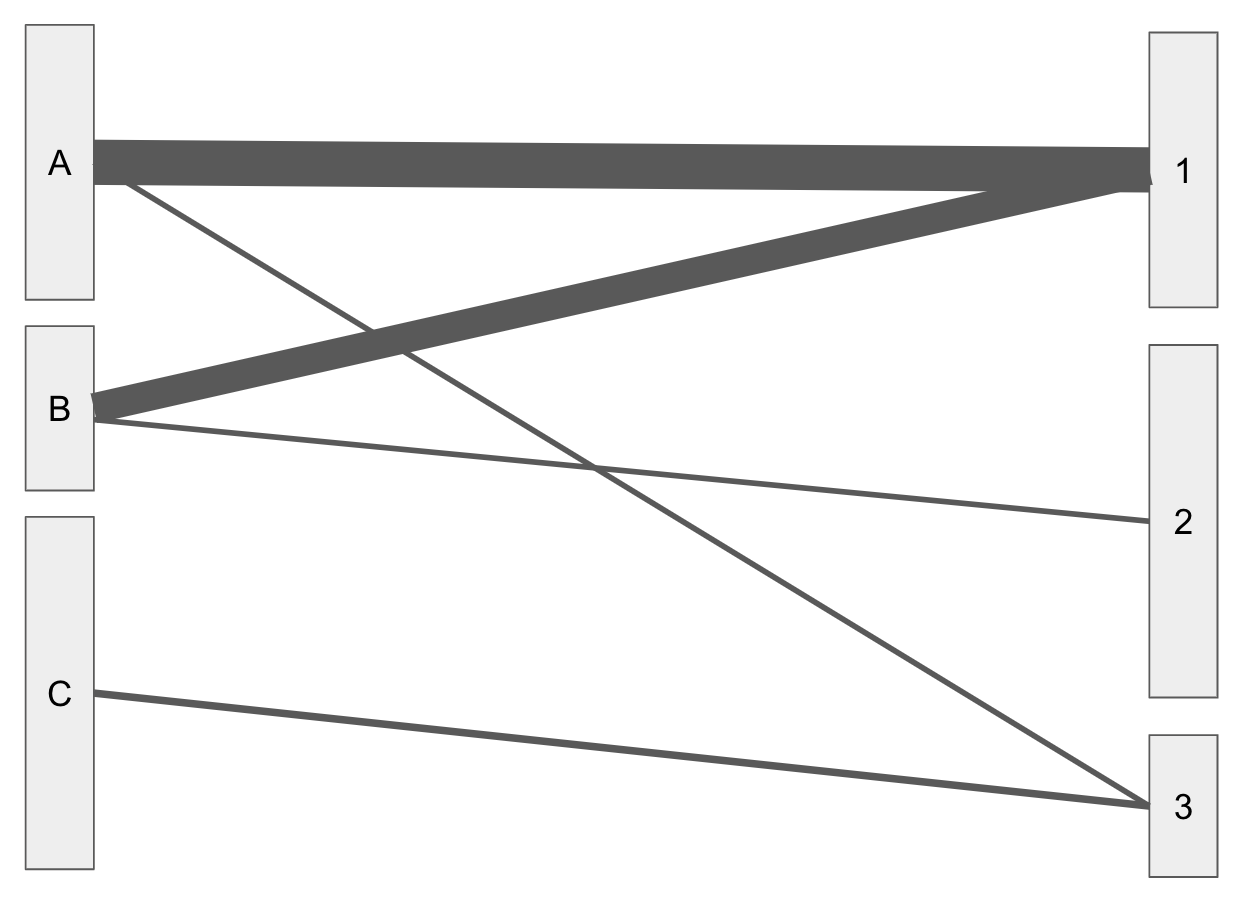
The thickness of the connections in a Sankey chart is related to the "strength" of the connection, meaning the amount flowing from the start to the end.
In this abstracted example, it is clear that the connections from A and B on the left side to 1 on the right side are much stronger than connections between any other vertices.