Overview
TigerGraph Insights is a no-code visual graph analyzer that makes building data analytics dashboards intuitive. Non-technical users can quickly and easily obtain meaningful visual insights that would remain hidden without a deep graph-enabled analysis of their connected data.
Features
-
Intuitive visual query builder
-
Ability to explore graph data through Widgets, including graphs, maps, tables, charts, and more
-
Responsive and interactive demos for displaying graph information to a general audience
Quick Start
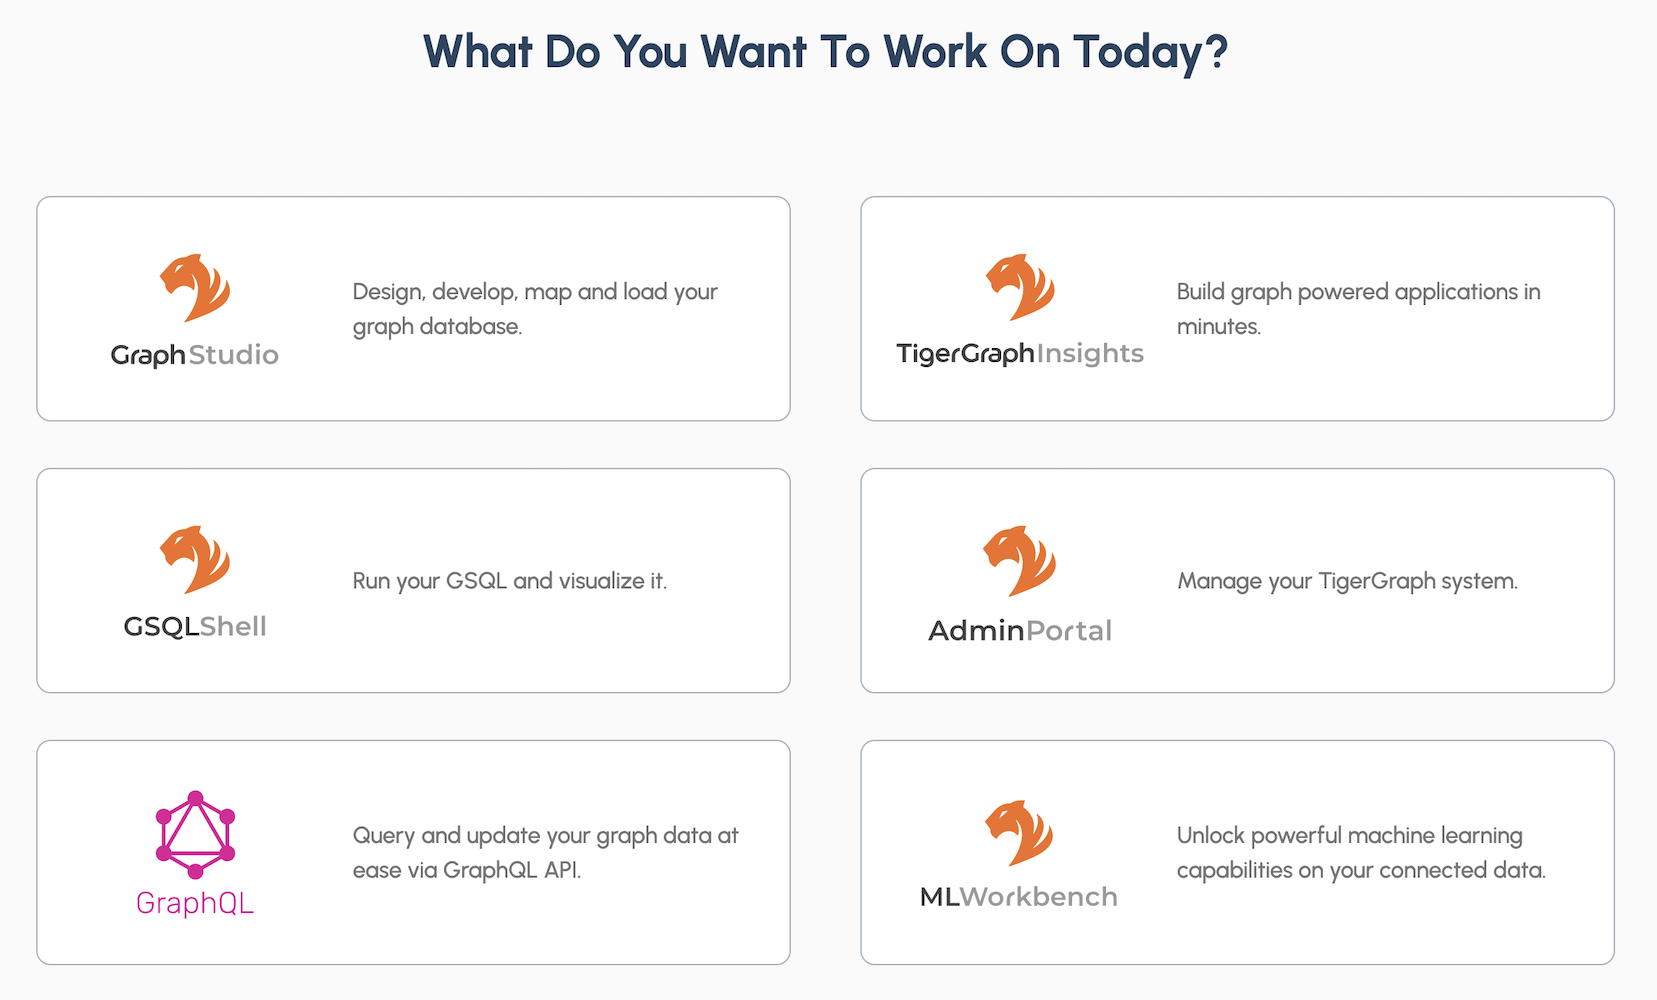
Launch TigerGraph Insights from the nine-dot TigerGraph Suite button  in the GUI of any cloud or local TigerGraph instance.
From there, you can create Applications that display Widgets for users to interact with.
Supported Browsers
As of November 2022, Insights is certified on the following browsers:
| Chrome | Safari | Firefox | Edge |
|---|---|---|---|
Version 107.0.5304.107 (Official Build) (arm64) |
Version 15.4 (17613.1.17.1.13) |
Version 106.0.3 |
Version 107.0.1418.42 (Official build) (arm64) |
Not all features are guaranteed to work on other browsers. Please make sure to enable JavaScript and cookies in your browser settings.