Troubleshooting Guide
|
This troubleshooting guide is only up to date for v2.6 and below. |
The Troubleshooting Guide teaches you how to monitor the status of your TigerGraph system, and when needed, find the log files in order to get a better understanding of why certain errors are occurring. This guide covers log file debugging for data loading and querying.
For a overview of available log files, their locations, and what information they contain, please refer to the Log Files documentation page.
General
Before any deeper investigation, always run these general system checks:
$ gadmin status        (Make sure all TigerGraph services are UP.)

$ df -lh               (Make sure all servers are getting enough disk space.)

$ free -g              (Make sure all servers have enough memory.)

$ tsar                 (Make sure there is no irregular memory usage on the system.)

$ dmesg -T | tail      (Make sure there are no Out of Memory, or any other errors.)

$ grun all "date"      (Make sure the time across all nodes are synchronized
with time difference under 2 seconds. )Installation Error Debugging
Missing Dependencies
The installation will quit if there are any missing dependency packages, and output a message. Please run bash install_tools.sh to install all missing packages. You will need an internet connection to install the missing dependencies.
Pinpoint The Failed Step
Using the -x flag during installation will show you the detailed shell commands being run during installation.
bash -x install.sh
Disk Space Errors
-
The
/homedirectory requires at least 200MB of space, or the installation will fail with an out of disk message. This is temporary only during installation and will be moved to the root directory once installation is complete. -
The
/tmpdirectory requires at least 1GB of space, or the installation will fail with an out of disk message -
The directory in which you choose to install TigerGraph requires at least 20GB of space, or the installation will report the error and exit.
Firewall Errors
If your firewall blocks all ports not defined for use, we recommend opening up internal ports 1000-50000.
If you are using a cloud instance, you will need to configure the firewall rules through the respective consoles.
e.g. Amazon AWS or Microsoft Azure
If you are managing a local machine, you can manage your open ports using the iptables command. Please refer to the example below to help with your firewall configuration.
# iptables help page
$ sudo iptables -h

# This will list your firewall rules
$ sudo iptables -L

# Allow incoming SSH connections to port 22 from the 192.168.0.0 subnet
$ sudo iptables -A INPUT -p tcp --dport 22 -s 192.168.0.0/24 -j ACCEPT
$ sudo iptables -A INPUT -p tcp --dport 22 -s 127.0.0.0/8 -j ACCEPT
$ sudo iptables -A INPUT -p tcp --dport 22 -j DROP
Query Debugging
Checking the Logs - Flow of a query in the system
To better help you understand the flow of a query within the TigerGraph system, we’ve provided the diagram below with arrows showing the direction of information flow. We’ll walk through the execution of a typical query to show you how to observe the information flow as recorded in the log files.
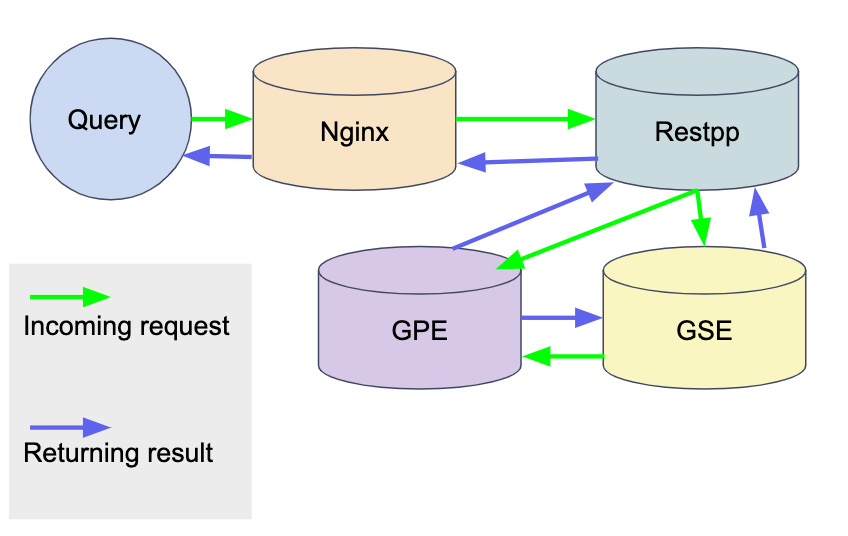
From calling a query to returning the result, here is how the information flows:
-
Nginx receives the request.
grep <QUERY_NAME> /home/tigergraph/tigergraph/logs/nginx/ngingx_1.access.log
-
Nginx sends the request to Restpp.
grep <QUERY_NAME> /home/tigergraph/tigergraph/logs/RESTPP_1_1/log.INFO
-
Restpp sends an ID translation task to GSE and a query request to GPE.
-
GSE sends the translated ID to GPE, and the GPE starts to process the query.
-
GPE sends the query result to Restpp, and sends a translation task to GSE, which then sends the translation result to Restpp.
grep <REQUEST_ID> /home/tigergraph/tigergraph/logs/GPE_1_1/log.INFO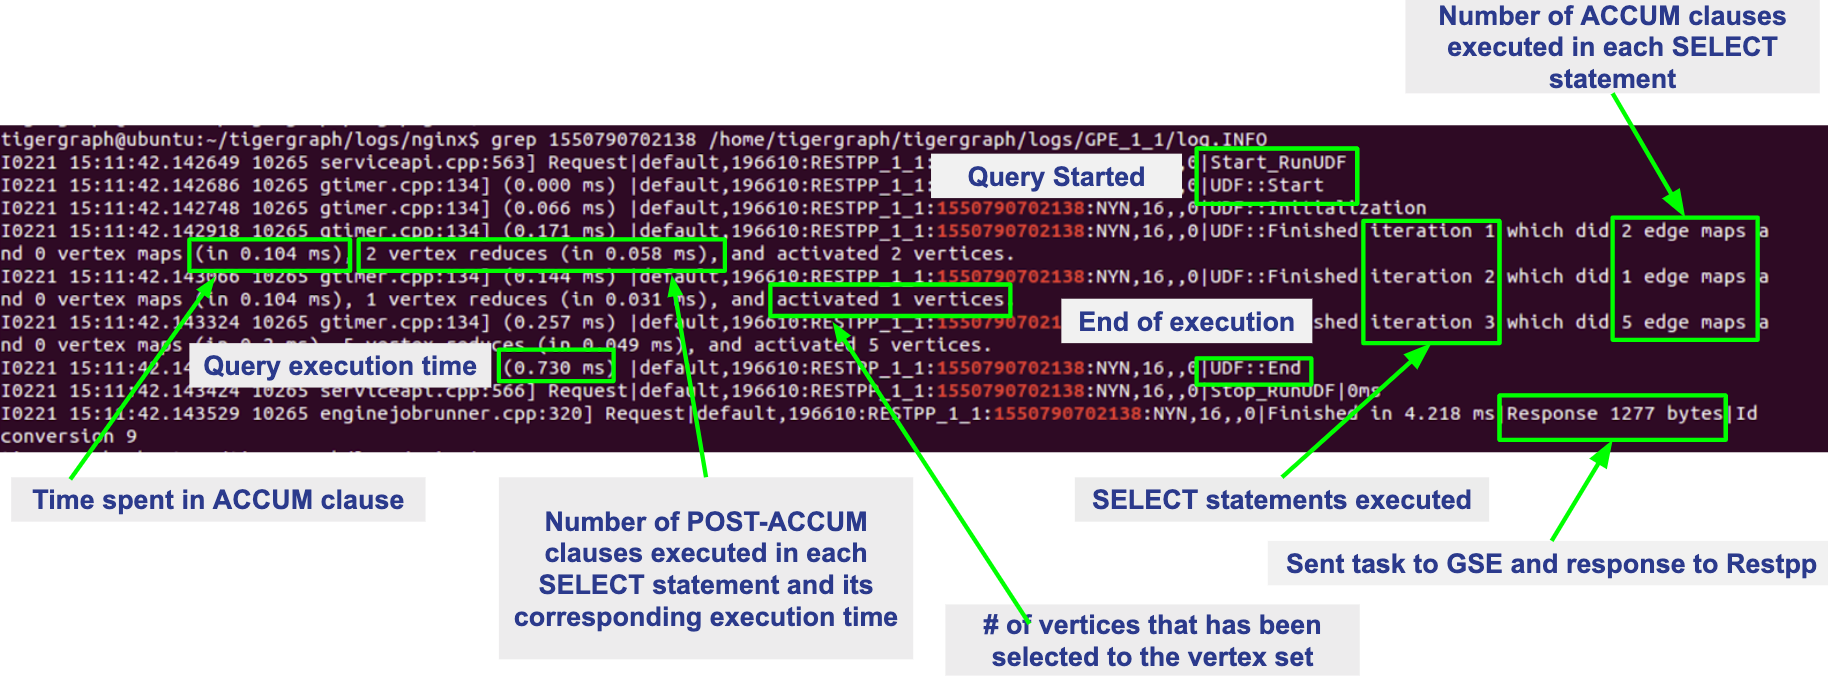
grep <REQUEST_ID> /home/tigergraph/tigergraph/logs/GSE_1_1/log.INFO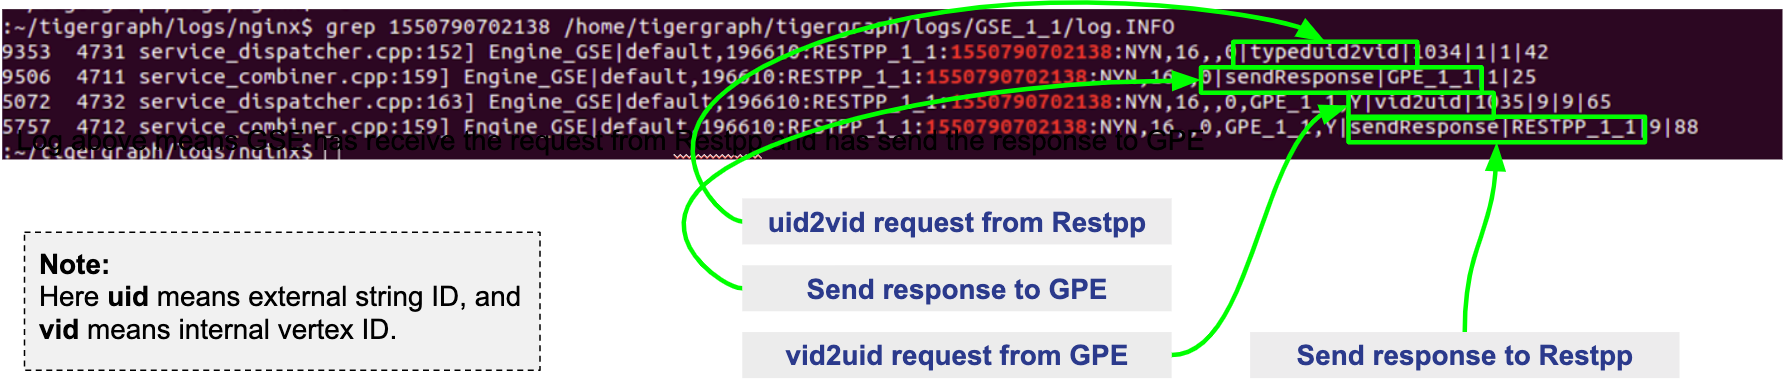
-
Restpp sends the result back to Nginx.
grep <REQUEST_ID> /home/tigergraph/tigergraph/logs/RESTPP_1_1/log.INFO
-
Nginx sends the response.
grep <QUERY_NAME> /home/tigergraph/tigergraph/logs/nginx/nginx_1.access.log
Other Useful Commands for Query Debugging
Check recently executed query:
$ grep UDF:: /home/tigergraph/tigergraph/logs/GPE_1_1/log.INFO | tail -n 50

Get the number of queries executed recently:
$ grep UDF::End /home/tigergraph/tigergraph/logs/GPE_1_1/log.INFO | wc -l

Grep distributed query log:
$ grep “Action done” /home/tigergraph/tigergraph/logs/GPE_1_1/log.INFO | tail -n 50


Grep logs from all servers:
$ grun all “grep UDF:: /home/tigergraph/tigergraph/logs/GPE_*/log.INFO | tail -n 50”
Slow Query Performance
Multiple situations can lead to slower than expected query performance:
-
Insufficient Memory When a query begins to use too much memory, the engine will start to put data onto the disk, and memory swapping will also kick in. Use the Linux command:
free -gto check available memory and swap status, or you can also monitor the memory usage of specific queries through GPE logs. To avoid running into insufficient memory problems, optimize the data structure used within the query or increase the physical memory size on the machine. -
GSQL Logic Usually, a single server machine can process up to 20 million edges per second. If the actual number of vertices or edges is much much lower, most of the time it can be due to inefficient query logic. That is, the query logic is now following the natural execution of GSQL. You will need to optimize your query to tune the performance.
-
Disk IO When the query writes the result to the local disk, the disk IO may be the bottleneck for the query’s performance. Disk performance can be checked with this Linux command :
sar 1 10. If you are writing (PRINT) one line at a time and there are many lines, storing the data in one data structure before printing may improve the query performance. -
Huge JSON Response If the JSON response size of a query is too massive, it may take longer to compose and transfer the JSON result than to actually traverse the graph. To see if this is the cause, check the GPE log.INFO file. If the query execution is already completed in GPE but has not been returned, and CPU usage is at about 200%, this is the most probable cause. If possible, please reduce the size of the JSON being printed.
-
Memory Leak This is a very rare issue. The query will progressively become slower and slower, while GPE’s memory usage increases over time. If you experience these symptoms on your system, please report this to the TigerGraph team.
-
Network Issues When there are network issues during communication between servers, the query can be slowed down drastically. To identify that this is the issue, you can check the CPU usage of your system along with the GPE log.INFO file. If the CPU usage stays at a very low level and GPE keeps printing
???, it means network IO is very high. -
Frequent Data Ingestion in Small Batches Small batches of data can increase the data loading overhead and query processing workload. Please increase the batch size to prevent this issue.
Query Hangs
When a query hangs or seems to run forever, it can be attributed to these possibilities:
-
Services are down Please check that TigerGraph services are online and running. Run
gadmin statusand possibly check the logs for any issues that you find from the status check. -
Query is in an infinite loop To verify this is the issue, check the GPE log.INFO file to see if graph iteration log lines are continuing to be produced. If they are, and the edgeMaps log the same number of edges every few iterations, you have an infinite loop in your query. If this is the case, please restart GPE to stop the query :
gadmin restart gpe -y. Proceed to refine your query and make sure your loops within the query are able to break out of the loop. -
Query is simply slow If you have a very large graph, please be patient. Ensure that there is no infinite loop in your query, and refer to the slow query performance section for possible causes.
-
GraphStudio Error If you are running the query from GraphStudio, the loading bar may continue spinning as if the query has not finished running. You can right-click the page and select inspect→console (in the Google Chrome browser) __and try to find any suspicious errors there.
Query Returns No Result
If a query runs and does not return a result, it could be due to two reasons:
-
Data is not loaded.
From the Load Data page on GraphStudio, you are able to check the number of loaded vertices and edges, as well as the number of each vertex or edge type. Please ensure that all the vertices and edges needed for the query are loaded. -
Properties are not loaded.
The number of vertices and edges traversed can be observed in the GPE log.INFO file. If for one of the iterations you see activated 0 vertices, this means no target vertex satisfied your searching condition. For example, the query can fail to pass a WHERE clause or a HAVING clause.
If you see 0 vertex reduces while the edge map number is not 0, that means that all edges have been filtered out by the WHERE clause, and that no vertices have entered into the POST-ACCUM phase. If you see more than 0 vertex reduces, but activated 0 vertices, this means all the vertices were filtered out by the HAVING clause.
To confirm the reasoning within the log file, use GraphStudio to pick a few vertices or edges that should have satisfied the conditions and check their attributes for any unexpected errors.
Query Installation Failed
Query Installation may fail for a handful of reasons. If a query fails to install, please check the GSQL log file. The default location for the GSQL log is here:
/home/tigergraph/tigergraph/logs/gsql_server_log/GSQL_LOGGo down to the last error and it will point you to the error. This will show you any query errors that could be causing the failed installation. If you have created a user-defined function, you could potentially have a c++ compilation error.
|
If you have a c++ user-defined function error, your query will fail to install, even if it does not utilize the UDF. |
Debugging Memory-related Failures
How to monitor memory usage by query
GPE records memory usage by query at different stages of the query and saves it to $(gadmin config get System.LogRoot)/gpe/log.INFO. You can monitor how much memory a query is using by searching the log file for the request ID and filter for lines that contain "QueryMem":
grep -i <request_id> $(gadmin config get System.LogRoot)/gpe/log.INFO |
    grep -i "querymem"
You can also run a query first, and then run the following command immediately after to retrieve the most recent query logs and filter for "QueryMem":
tail -n 50 $(gadmin config get System.LogRoot)/gpe/log.INFO |
    grep -i "querymem"
You will get results that look like the following, which shows memory usage by the query at different stages of its execution. The number at the end of each line indicates the number of bytes of memory utilized by the query:
0415 01:33:40.885433  6553 gpr.cpp:195] Engine_MemoryStats|     \
ldbc_snb::,196612.RESTPP_1_1.1618450420870.N,NNN,15,0,0|        \
MONITORING Step(1) BeforeRun[GPR][QueryMem]: 116656

I0415 01:33:42.716199  6553 gpr.cpp:241] Engine_MemoryStats|    \
ldbc_snb::,196612.RESTPP_1_1.1618450420870.N,NNN,15,0,0|        \
MONITORING Step(1) AfterRun[GPR][QueryMem]: 117000
How to check system free memory percentage
You can check how much free memory your system has as a percentage of its total memory by running the following command:
tail -n 50 $(gadmin config get System.LogRoot)/gpe/log.INFO | grep -i 'freepct'The number following "FreePct" indicates the percentage of the system free memory. The following example shows the system free memory is 69%:
I0520 23:40:09.845811  7828 gsystem.cpp:622]
System_GSystem|GSystemWatcher|Health|ProcMaxGB|0|ProcAlertGB|0|
CurrentGB|1|SysMinFreePct|10|SysAlertFreePct|30|FreePct|69
When free memory drops below 10 percent (SysMinFreePct), all queries are aborted. This threshold is adjustable through gadmin config.
Data Loading Debugging
Checking the Logs
GraphStudio
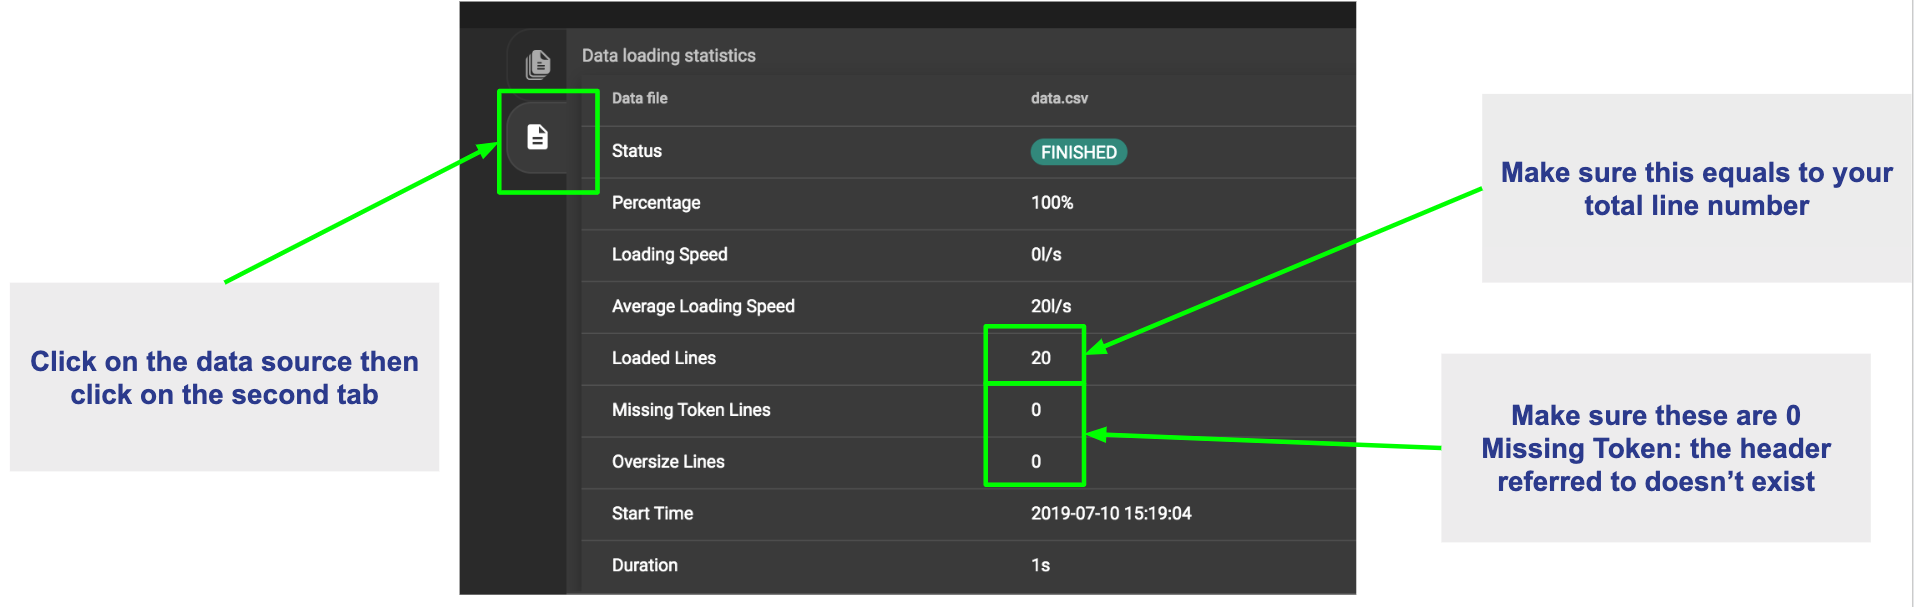
Using GraphStudio, you are able to see, from a high-level, a number of errors that may have occurred during the loading. This is accessible from the Load Data page.
Click on one of your data sources, then click on the second tab of the graph statistics chart. There, you will be able to see the status of the data source loading, number of loaded lines, number of lines missing, and lines that may have an incorrect number of columns. (Refer to picture below.)
Command Line
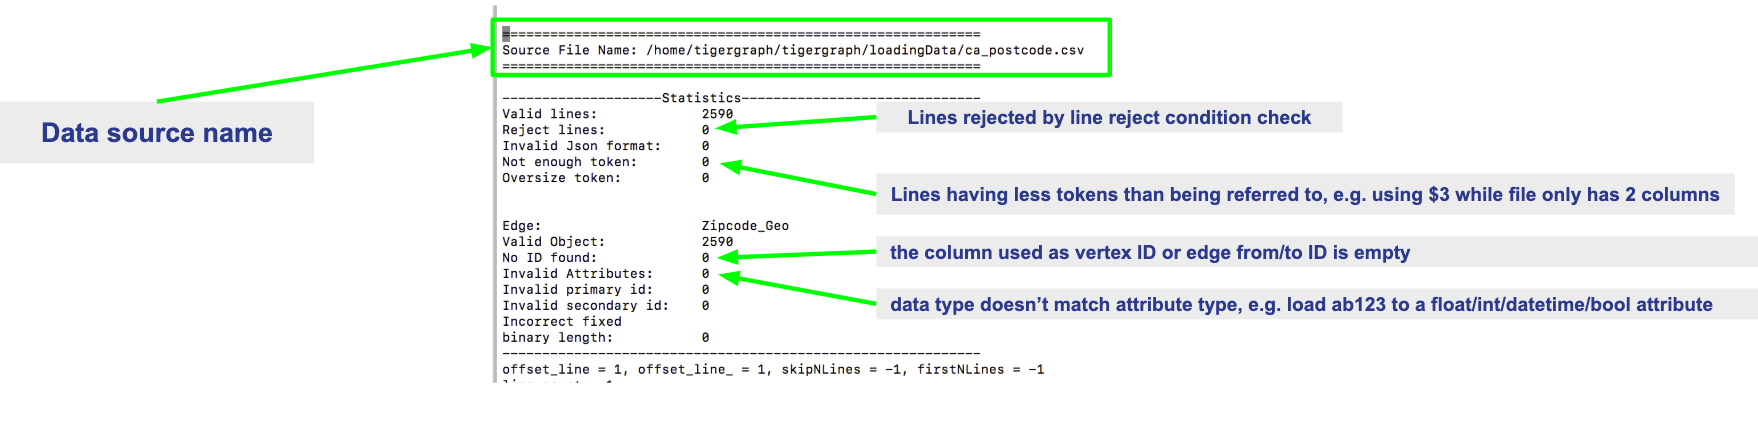
If you see there are a number of issues from the GraphStudio Load Data page, you can dive deeper to find the cause of the issue by examining the log files. Check the loading log located here:
/home/tigergraph/tigergraph/logs/restpp/restpp_loader_logs/<GRAPH_NAME>/Open up the latest .log file and you will be able to see details about each data source. The picture below is an example of a correctly loaded data file.
Here is an example of a loading job with errors:
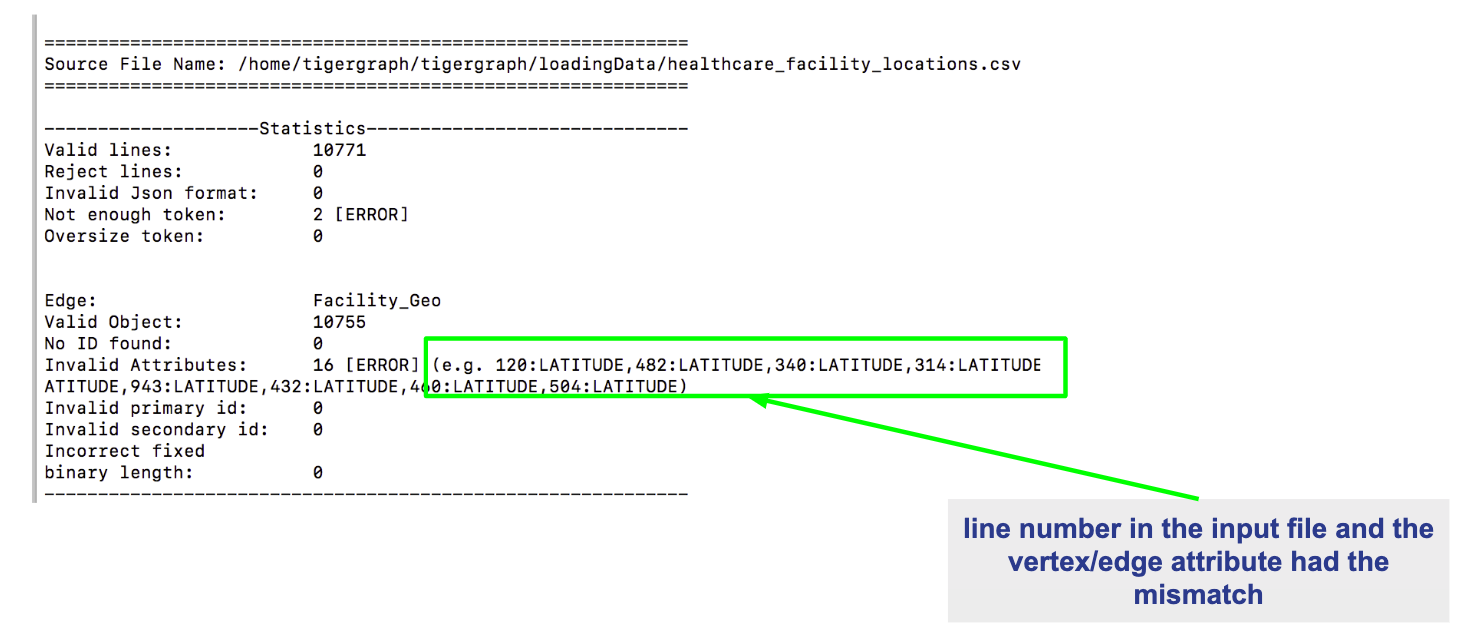
From this log entry, you are able to see the errors being marked as lines with invalid attributes. The log will provide you the line number from the data source which contains the loading error, along with the attribute it was attempting to load to.
Slow Loading
Normally, a single server running TigerGraph will be able to load from 100k to 1000k lines per second, or 100GB to 200GB of data per hour. This can be impacted by any of the following factors:
-
Loading Logic How many vertices/edges are generated from each line loaded?
-
Data Format Is the data formatted as JSON or CSV? Are multi-level delimiters in use? Does the loading job intensively use temp_tables?
-
Hardware Configuration Is the machine set up with HDD or SSD? How many CPU cores are available on this machine?
-
Network Issue Is this machine doing local loading or remote POST loading? Any network connectivity issues?
-
Size of Files How large are the files being loaded? Many small files may decrease the performance of the loading job.
-
High Cardinality Values Being Loaded to String Compress Attribute Type How diverse is the set of data being loaded to the String Compress attribute?
To combat the issue of slow loading, there are also multiple methods:
-
If the computer has many cores, consider increasing the number of Restpp load handlers.
$ gadmin --config handler
increase the number of handlers
save
$ gadmin --config apply-
Separate
~/tigergraph/kafkafrom~/tigergraph/gstoreand store them on separate disks. -
Do distributed loading.
-
Do offline batch loading.
-
Combine many small files into one larger file.
Loading Hangs
When a loading job seems to be stuck, here are things to check for:
-
GPE is DOWN You can check the status of GPE with this command :
gadmin status gpeIf GPE is down, you can find the logs necessary with this command :gadmin log -v gpe -
Memory is full Run this command to check memory usage on the system :
free -g -
Disk is full Check disk usage on the system :
df -lh -
Kafka is DOWN You can check the status of Kafka with this command :
gadmin status kafkaIf it is down, take a look at the log with this command :vim ~/tigergraph/kafka/kafka.out -
Multiple Loading Jobs By default, the Kafka loader is configured to allow a single loading job. If you execute multiple loading jobs at once, they will run sequentially.
Data Not Loaded
If the loading job completes, but data is not loaded, there may be issues with the data source or your loading job. Here are things to check for:
-
Any invalid lines in the data source file. Check the log file for any errors. If an input value does not match the vertex or edge type, the corresponding vertex or edge will not be created.
-
Using quotes in the data file may cause interference with the tokenization of elements in the data file. Please check the GSQL Language Reference section under Other Optional LOAD Clauses. Look for the QUOTE parameter to see how you should set up your loading job.
-
Your loading job loads edges in the incorrect order. When you defined the graph schema, the from and to vertex order will affect the way you write the loading job. If you wrote the loading job in reversed order, the edges will not be created, possibly also affecting the population of vertices.
Loading is Incorrect
If you know what data you expect to see (number of vertices and edges, and attribute values), but the loaded data does not mean your expectations, there are a number of possible causes to investigate:
-
First, check the logs for important clues.
-
Are you reaching and reading all the data sources (paths and permissions)?
-
Is the data mapping correct?
-
Are your data fields correct? In particular, check data types. For strings, check for unwanted extra strings. Leading spaces are not removed unless you apply an optional token function to trim the extra spaces.
-
Do you have duplicate ids, resulting in the same vertex or edge being loading more than once. Is this intended or unintended? TigerGraph’s default loading semantics is UPSERT. Check the loading documentation to maker sure you understand the semantics in detail: Cumulative Loading.
Schema Change Debugging
This section will only cover the debugging schema change jobs, for more information about schema changes, please read the Modifying a Graph Schema page.
Understanding what happens behind the scenes during a schema change.
-
DSC (Dynamic Schema Change) Drain - Stops the flow of traffic to RESTPP and GPE If GPE receives a DRAIN command, it will wait 1 minute for existing running queries to finish up. If the queries do not finish within this time, the DRAIN step will fail, causing the schema change to fail.
-
DSC Validation - Verification that no queries are still running.
-
DSC Apply - Actual step where the schema is being changed.
-
DSC Resume - Traffic resumes after schema change is completed. Resume will automatically happen if a schema change fails. RESTPP comes back online. All buffered query requests will go through after RESTPP resumes, and will use the new updated schema.
|
Schema changes are not recommended for production environments. Schema changes are all or nothing. If a schema change fails in the middle, changes will not be made to the schema. |
Signs of Schema Change Failure
-
Failure when creating a graph
-
Global Schema Change Failure
-
Local Schema Change Failure
-
Dropping a graph fails
-
If GPE or RESTPP fail to start due to YAML error, please report this to TigerGraph.
If you encounter a failure, please take a look at the GSQL log file : gadmin log gsql. Please look for these error codes:
-
Error code 8 - The engine is not ready for the snapshot. Either the pre-check failed or snapshot was stopped. The system is in critical non-auto recoverable error state. Manual resolution is required. Please contact TigerGraph support.
-
Error code 310 - Schema change job failed and the proposed change has not taken effect. This is the normal failure error code. Please see next section for failure reasons.
Reasons For Dynamic Schema Change Failure
-
Another schema change or a loading job is running. This will cause the schema change to fail right away.
-
GPE is busy. Potential reasons include :
-
Long running query.
-
Loading job is running.
-
Rebuild process is taking a long time.
-
-
Service is down. (RESTPP/GPE/GSE)
-
Cluster system clocks are not in sync. Schema change job will think the request is stale, causing this partition’s schema change to fail.
-
Config Error. If the system is shrunk manually, schema change will fail.
Log Files
You will need to check the logs in this order : GSQL log, admin_server log, service log.
Admin_server log files can be found here : ~/tigergraph/logs/admin_server/ You will want to take a look at the INFO file.
The service log is each of the services respectively. gadmin log <service_name> will show you the location of these log files.
Example of a successful schema change job. (admin_server log)
$ grep DSC ~/tigergraph/logs/admin_server/INFO.20181011-101419.98774

I1015 12:04:14.707512 116664 gsql_service.cpp:534] Notify RESTPP DSCDrain successfully.
I1015 12:04:15.765108 116664 gsql_service.cpp:534] Notify GPE DSCDrain successfully.
I1015 12:04:16.788666 116664 gsql_service.cpp:534] Notify GPE DSCValidation successfully.
I1015 12:04:17.805620 116664 gsql_service.cpp:534] Notify GSE DSCValidation successfully.
I1015 12:04:18.832386 116664 gsql_service.cpp:534] Notify GPE DSCApply successfully.
I1015 12:04:21.270011 116664 gsql_service.cpp:534] Notify RESTPP DSCApply successfully.
I1015 12:04:21.692147 116664 gsql_service.cpp:534] Notify GSE DSCApply successfully.
Example of DSC fail
E1107 14:13:03.625350 98794 gsql_service.cpp:529] Failed to notify RESTPP with command: DSCDrain. rc: kTimeout. Now trying to send Resume command to recover.
E1107 14:13:03.625562 98794 gsql_service.cpp:344] DSC failed at Drain stage, rc: kTimeout
E1107 14:14:03.814132 98794 gsql_service.cpp:513] Failed to notify RESTPP with command: DSCResume. rc: kTimeout
In this case, we see that RESTPP failed at the DRAIN stage. We need to first look at whether RESTPP services are all up. Then, verify that the time of each machine is the same. If all these are fine, we need to look at RESTPP log to see why it fails. Again, use the "DSC" keyword to navigate the log.
GSE Error Debugging
To check the status of GSE, and all other processes, run gadmin status to show the status of key TigerGraph processes. As with all other processes, you are able to find the log file locations for GSE by the gadmin log command. Refer to the Location of Log Files for more information about which files to check.
$ gadmin log gse
[Warning] License will expire in 5 days
GSE : /home/tigergraph/tigergraph/logs/gse/gse_1_1.out
GSE : /home/tigergraph/tigergraph/logs/GSE_1_1/log.INFO
GSE Process Fails To Start
If the GSE process fails to start, it is usually attributed to a license issue, please check these factors:
-
License Expiration
gadmin status licenseThis command will show you the expiration date of your license. -
Single Node License on a Cluster If you are on a TigerGraph cluster, but using a license key intended for a single machine, this will cause issues. Please check with your point of contact to see which license type you have.
-
Graph Size Exceeds License Limit Two cases may apply for this reason. The first reason is you have multiple graphs but your license only allows for a single graph. The second reason is that your graph size exceeds the memory size that was agreed upon for the license. Please check with your point of contact to verify this information.
GSE status is "not_ready"
Usually in this state, GSE is warming up. This process can take quite some time depending on the size of your graph.
<INCLUDE PROCESS NAME SHOWING CPU USAGE TO VERIFY THE "WARMING UP" STATE>
|
Very rarely, this will be a ZEROMQ issue. Restarting TigerGraph should resolve this issue
|
GSE crash
GSE crashes are likely due to and Out Of Memory issue. Use the dmesg -T command to check any errors.
|
If GSE crashes, and there are no reports of OOM, please reach out to TigerGraph support. |
GSE High Memory Consumption
If your system has unexpectedly high memory usage, here are possible causes:
-
Length of ID strings is too long GSE will automatically deny IDs with a length longer than 16k. Memory issues could also arise if an ID string is too long ( > 500). One proposed solution to this is to hash the string.
-
Too Many Vertex Types Check the number of unique vertex types in your graph schema. If your graph schema requires more than 200 unique vertex types, please contact TigerGraph support.
GraphStudio Debugging
Browser Crash / Freeze
If your browser crashes or freezes (shown below), please refresh your browser.
GraphStudio Crash
If you suspect GraphStudio has crashed, first run gadmin status to verify all the components are in good shape. Two known causes of GraphStudio crashes are:
-
Huge JSON response User-written queries can return very large JSON responses. If GraphStudio often crashes on large query responses, you can try reducing the size limit for JSON responses by changing the
GUI.RESTPPResponseMaxSizeBytesconfiguration usinggadmin config. The default limit is 33554432 bytes.
$ gadmin config entry GUI.RESTPPResponseMaxSizeBytes
New: 33554431
[   Info] Configuration has been changed. Please use 'gadmin config apply' to persist the changes.
$ gadmin config apply-
Very Dense Graph Visualization On the Explore Graph page, the "Show All Paths" query on a very dense graph is known to cause a crash.
DEBUG mode
To find the location of GraphStudio log files, use this command : gadmin log gui
$ gadmin log vis
[Warning] License will expire in 5 days
VIS : /home/tigergraph/tigergraph/logs/gui/gui_ADMIN.log
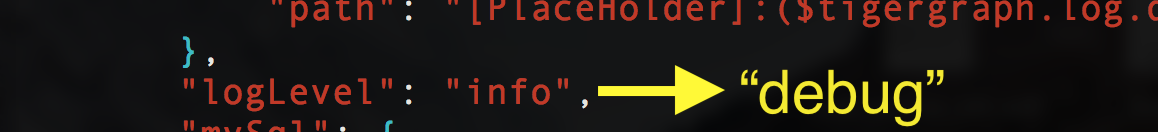
VIS : /home/tigergraph/tigergraph/logs/gui/gui_INFO.logAllowing GraphStudio DEBUG mode will print out more information to the log files. To allow DEBUG mode, please edit the following file : /home/tigergraph/tigergraph/visualization/server/src/config/local.json
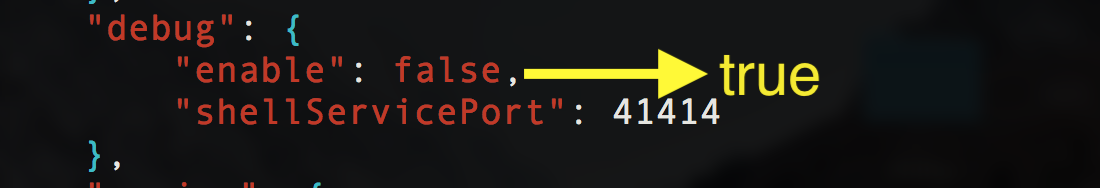
After editing the file, run gadmin restart gui -y to restart the GraphStudio service. Follow along the log file to see what is happening : tail -f /home/tigergraph/tigergraph/logs/gui/gui_INFO.log
Repeat the error-inducing operations in GraphStudio and view the logs.
Known Issues
There is a list of known GraphStudio issues here.
Further Debugging
If after taking these actions you cannot solve the issue, open a support ticket to request assistance.
For faster resolution, download and run the support script (contents shown below) and attach the output to your support ticket. This only needs to be run from a single TigerGraph node.
gsupport_collect.sh
#!/bin/bash

# TigerGraph Support Collector v1.2
# Revised 6/1/2022
TIME_IN_PAST=86400 # 60 * 60 * 24 hours
INSTALL_DIR="/home/tigergraph/tigergraph/app/cmd"
supportdir="support_collection_$(date +%F_%H%M%S)"

Usage(){
  echo ""
  echo "TigerGraph Support Collection Tool"
  echo ""
  echo "Usage: $(basename "$0") [-t <seconds]"
  echo "  -t : time, in seconds, for historical log duration"
  echo "       default is 86400 seconds (or 24 hours)"
  echo " "
  echo "Example:"
  echo "  '$(basename "$0") -t 3600'  : Run this command for logs for last 3600 seconds (60 mins or 1 hour)"
  exit 1
}

while [ -n "$1" ];
do
  case "$1" in
    -t)
      shift
      TIME_IN_PAST=$1
      ;;
    *)
      Usage
      exit 0
      ;;
  esac
  shift
done

if [ ! -e "${INSTALL_DIR}"/gcollect ]; then
  echo "Can't access ${INSTALL_DIR}/gcollect. Check TigerGraph software installation"
  exit 1
fi
echo "Collecting logs/config for last ${TIME_IN_PAST} seconds"
gcollect -o ./"$supportdir" -t "${TIME_IN_PAST}" collect
STATUS=$?

if [ ${STATUS} -ne 0 ]; then
  echo "Error: gcollect command failed to execute"
  exit 1
fi

echo; echo "Collecting current state..."
{
  printf "\n===gssh===\n"
  gssh
  printf "\n===gstatusgraph==="
  gstatusgraph
  printf "===GPE binary checksum==="
  grun_p all "md5sum $(gadmin config get System.AppRoot)/bin/tg_dbs_gped"
  printf "\n===System Date==="
  grun_p all "date"
  printf "\n===TG Process State==="
  grun all "ps aux | grep $(gadmin config get System.AppRoot)/bin/"
  printf "\n===Top Processes==="
  grun all "top -b -n 1 | head -n 25"
  printf "\n===CPU Architecture Information==="
  grun all "lscpu"
  printf "\n===disks==="
  grun all "lsblk -d -e 7 -o name,rota"
} > "${supportdir}"/support.log 2>&1

echo; echo "Compressing support bundle collection (this may take some time)..."
tar -Jcf "$supportdir".tar.xz "$supportdir"; rm -rf "$supportdir"

#ZenDesk has file upload limit of 50MB.
#check the size of the bundle, if it is more than 50MB, then split file into multiple chunks

collectionsize=$(du -s "$supportdir".tar.xz | cut -f1); uploads=$(((collectionsize/500000)+1))
if [ $uploads -ne 1 ]; then
  echo; echo "Due to upload size limits, the support bundle will be split into $(((collectionsize/500000)+1)) peices."
  mkdir "$supportdir";
  split --verbose -d -b 50M "$supportdir".tar.xz "$supportdir"/"$supportdir".tar.xz.part;
  rm "$supportdir".tar.xz;
  echo; echo "Support Collection has been saved under $supportdir directory."
else
  echo; echo "Support Collection has been saved as $supportdir.tar.xz"
fi