Load Data
After mapping data files to the graph schema, you can start loading data. Click "Load Data" on the left side menu bar to go to the Load Data page.
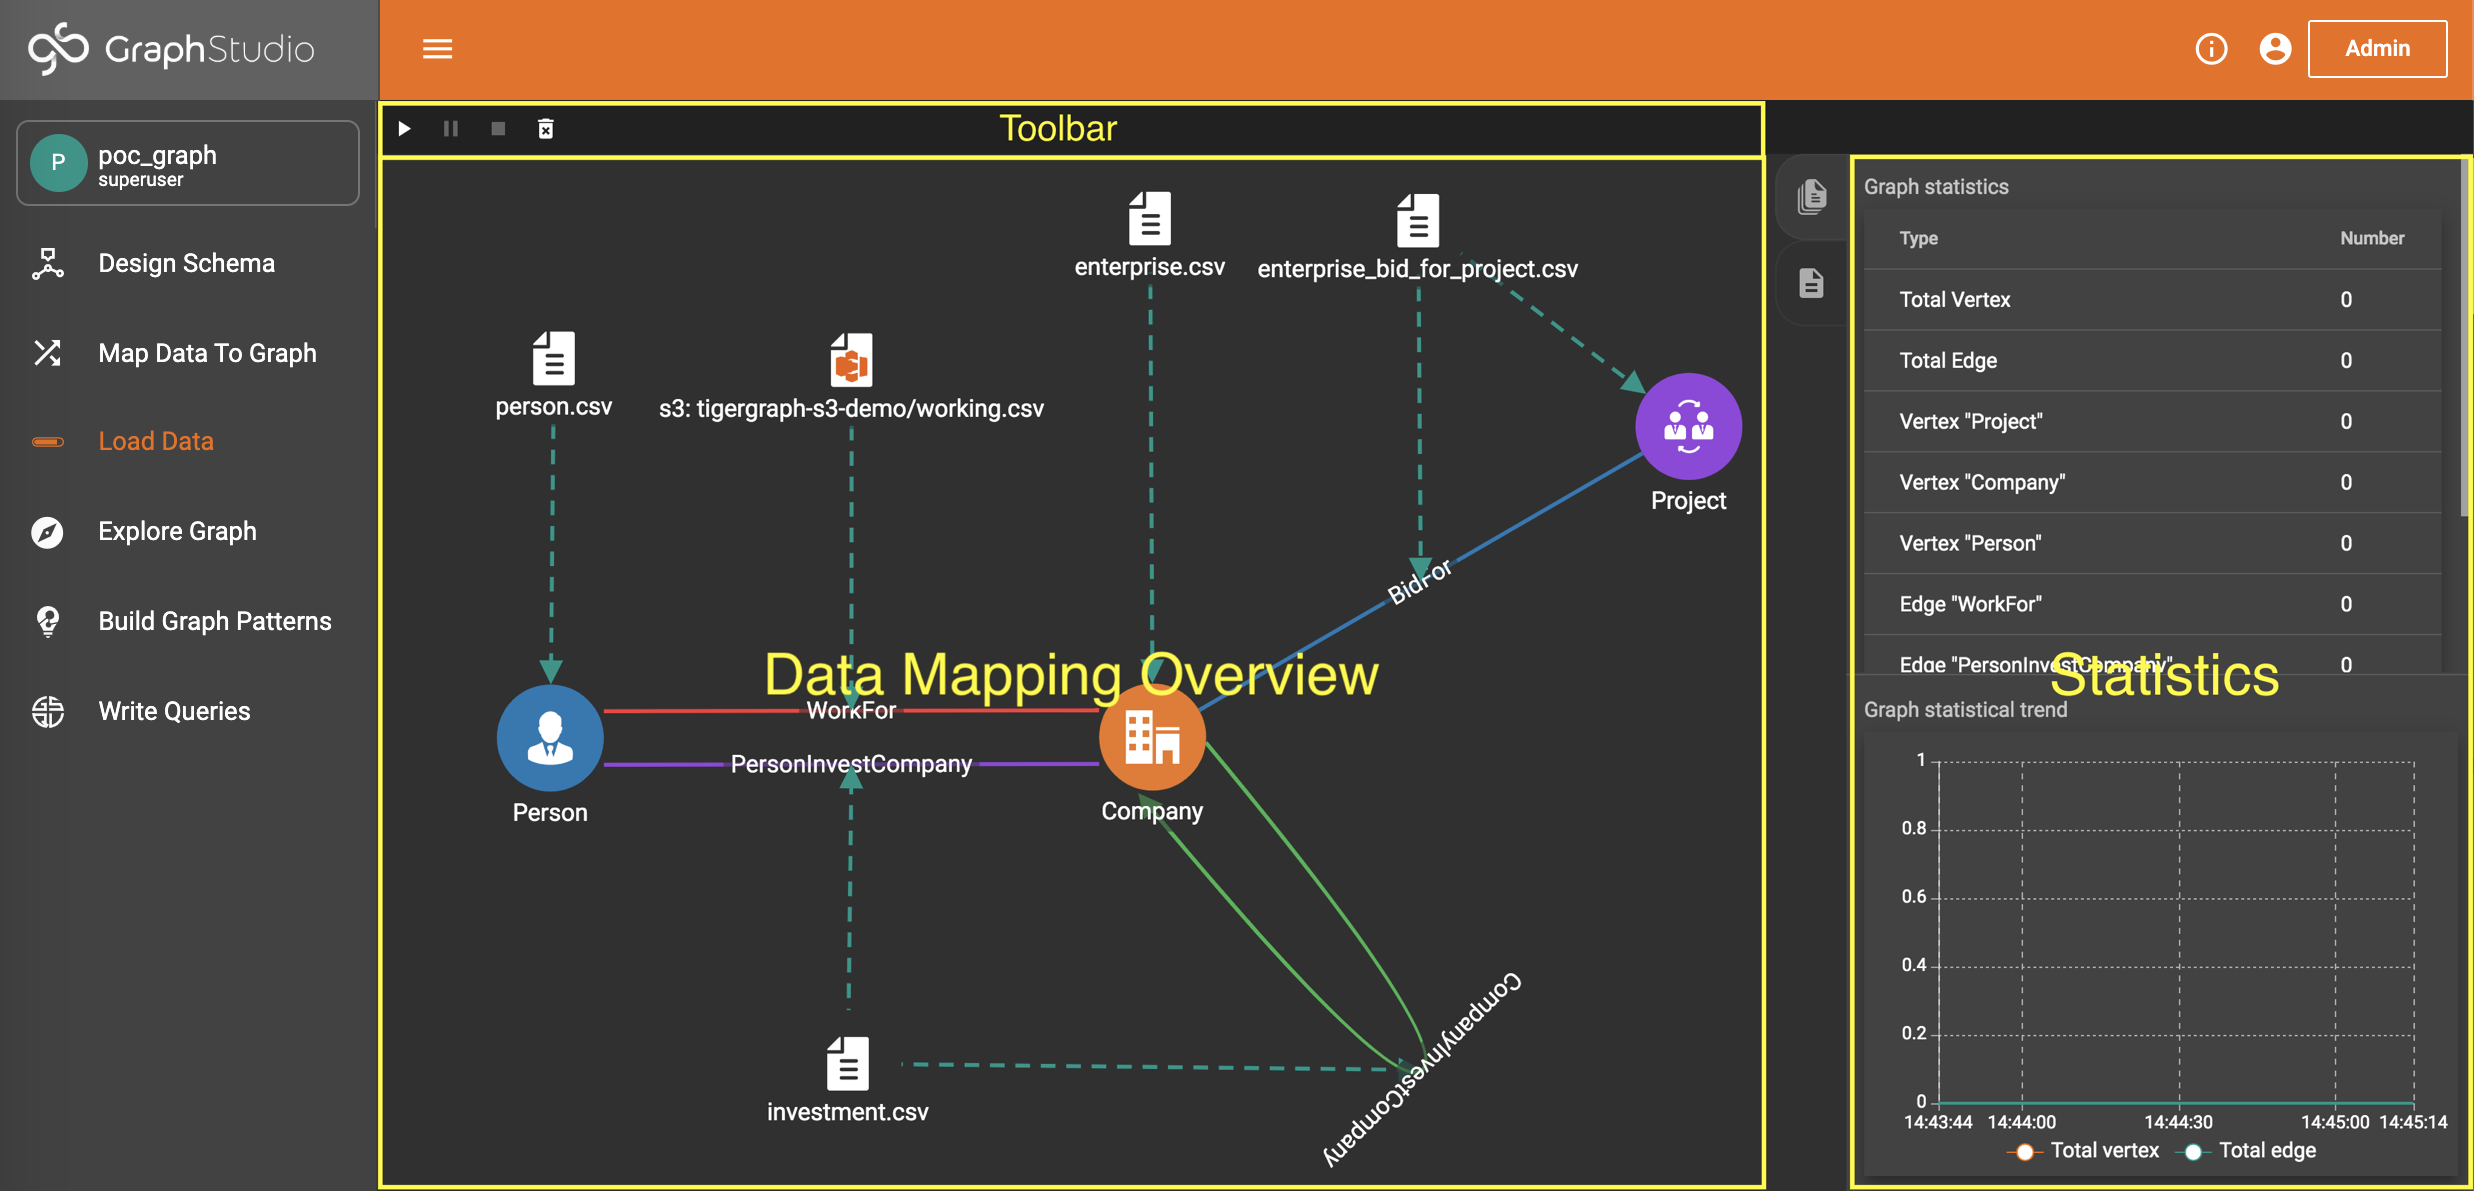
The "Load Data" interface is separated into three parts:
-
Data Mapping Overview
-
Provides a general view of the graph and the data mapping.
-
Shows the loading progress of each data file.
-
-
Toolbar (above Data Mapping)
-
Start/pause/resume/stop data loading and clear graph data buttons.
-
-
Statistics
-
Graph statistics: displays the numbers of vertices and edges in total and per type, with real-time loading progress.
-
Loading statistics: displays the total number of vertices and edges loader vs. time.
-
|
To display real-time graph statistics, this page checks the number of vertices and edges every 10 seconds, which adds overhead. To maximize loading performance, move to a different page after starting loading, and only come back here occasionally to check the progress. |
Loading
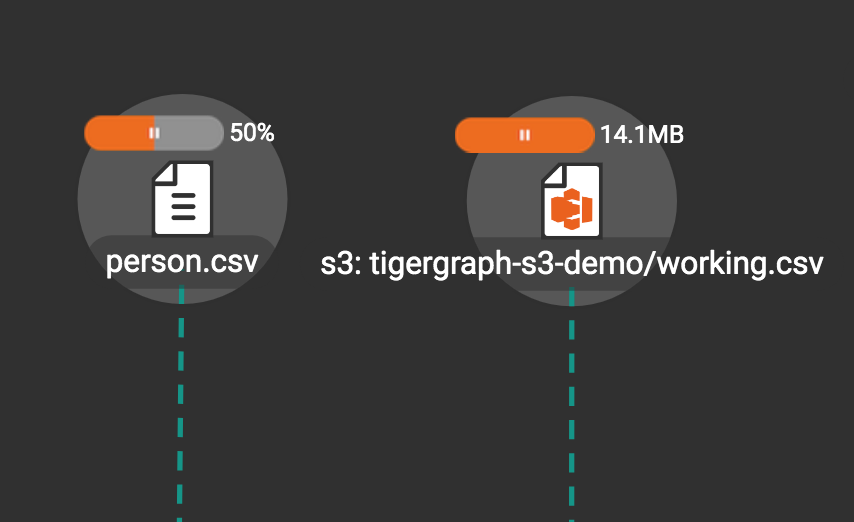
The toolbar at the top of the window has buttons to start/resume, pause, and stop loading data files respectively:


By default, these actions apply to all data files if none are selected.
To start, pause, resume, or stop loading individual files, select them by clicking. Hold Shift and click to select more than one file.
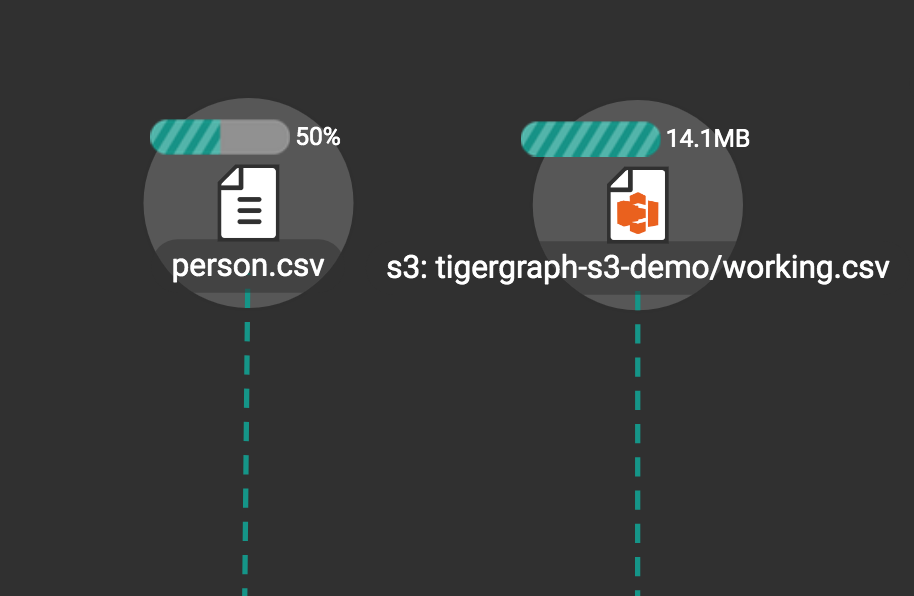
A bar will appear over each data file to show its loading progress.
Statistics Panel
The Statistics panel contains two tabs: Graph Statistics (1st tab) and Data Loading Statistics (2nd tab).
Graph Statistics
If no data file is selected, the Statistics panel will show Graph Statistics by default.
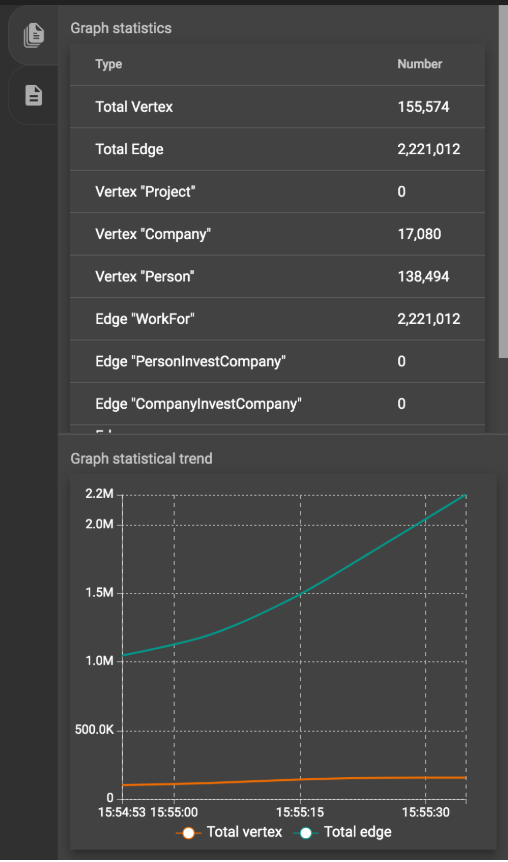
The table at the top shows the number of vertices and edges of each type and the total number of vertices and edges in the graph. The line chart at the bottom shows the number of vertices and edges loaded over time.
Data Loading Statistics
If you click on one data file, the Statistics panel will change to show Data Loading Statistics:
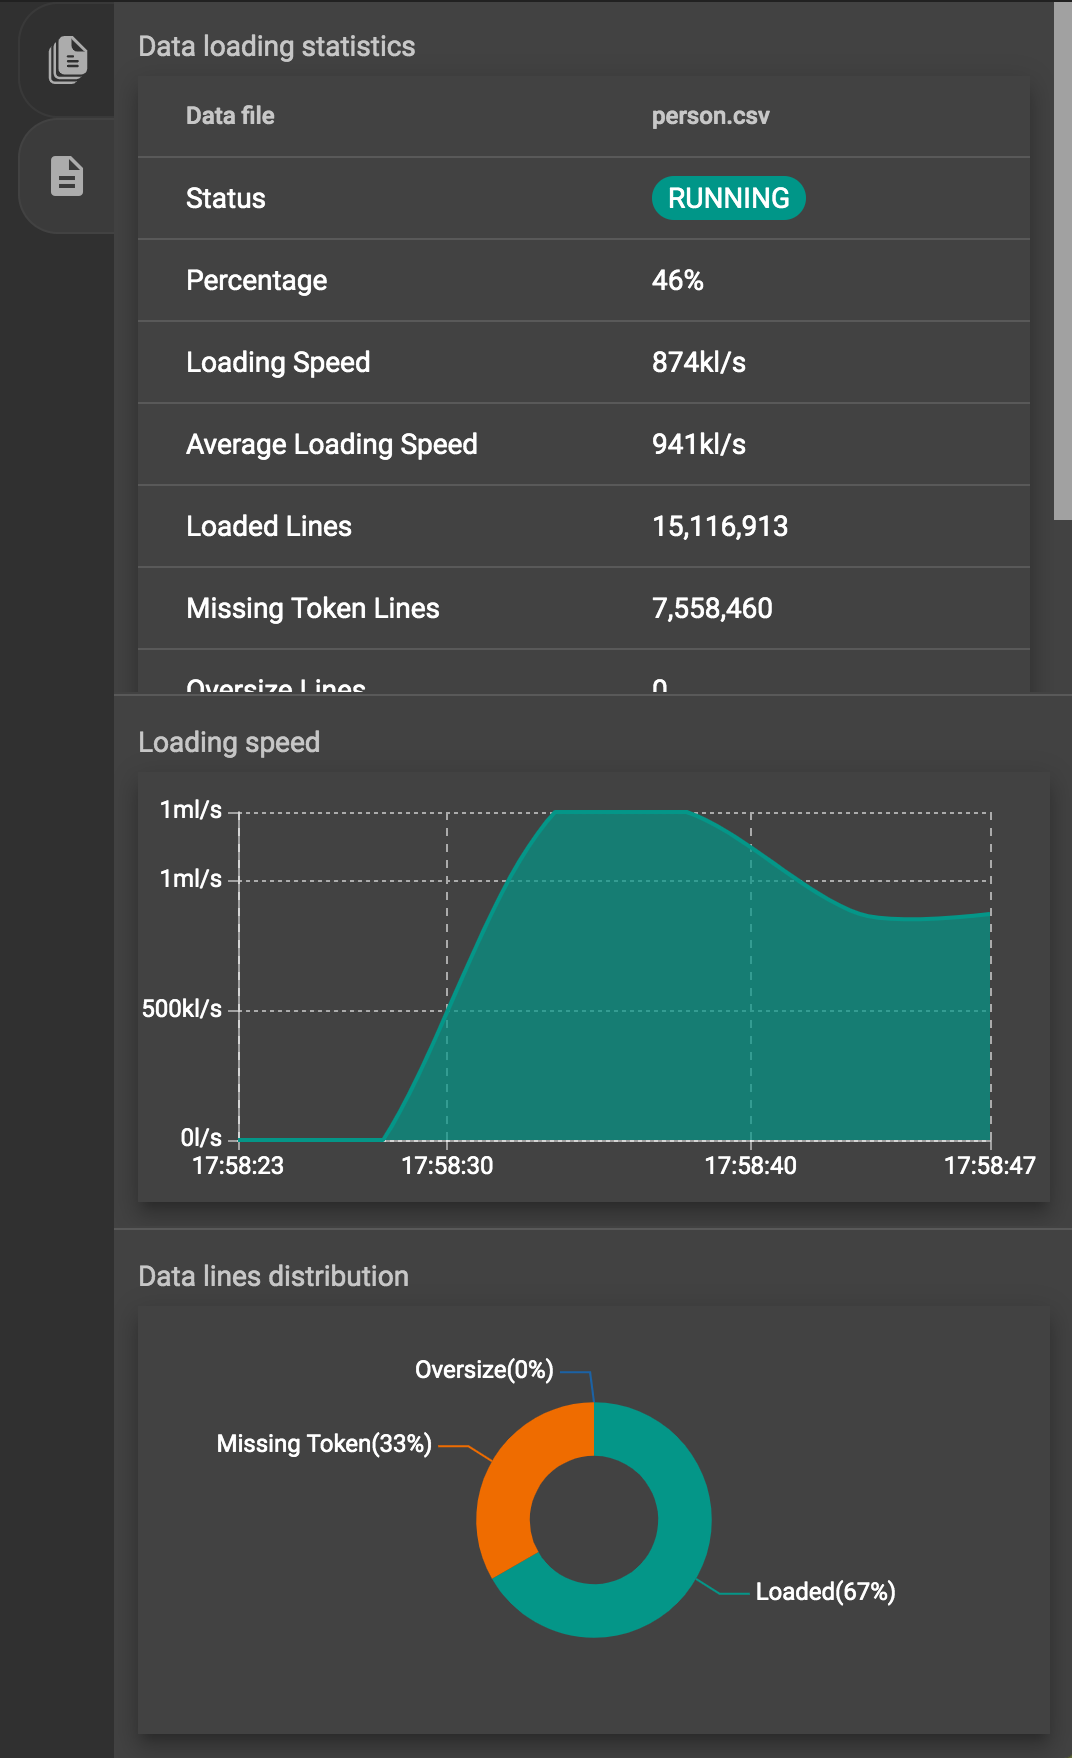
The table at the top shows the detailed loading information of the selected data file, including:
-
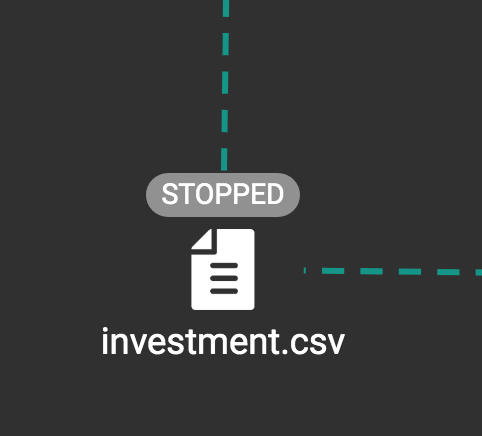
Status (RUNNING, PAUSED, STOPPED, etc)
-
Loaded percentage (for files on server) or loaded size (for S3 file)
-
Loading speed
-
Average loading speed
-
Number of loaded lines
-
Number of missing token lines
-
Number of oversize lines
-
Loading start time
-
Loading duration
The area chart in the middle shows the real-time loading speed for the selected data file in lines per second.
The pie chart at the bottom shows the distribution of data lines, among three categories:
-
Loaded lines
-
Missing token lines (the lines contain fewer tokens than required by the data mapping)
-
Oversize lines (some tokens are too large)
|
The number of loaded lines doesn’t mean all these lines are successfully loaded. Some issues during Data Mapping (like mapping a non-numeric column to an integer attribute) or because of dirty data may cause some of these lines not to be loaded. |
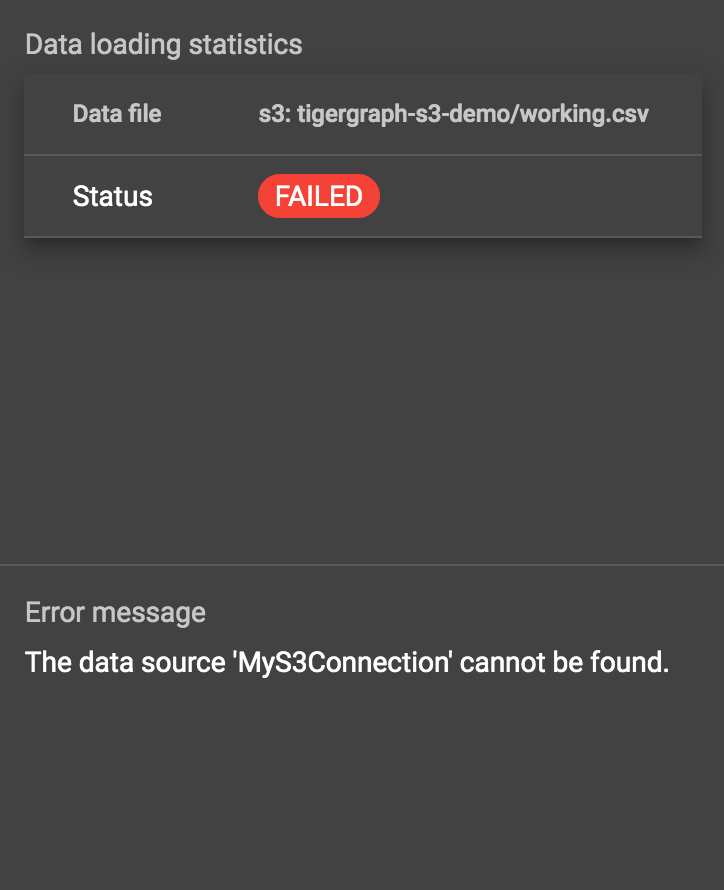
Any error messages generated during loading will be shown at the bottom:
Clear Graph Data
Click on the "clear graph data" button on the toolbar to clear the graph data.
This operation will take about a minute depending on the size of your graph and your hardware capability.
on the toolbar to clear the graph data.
This operation will take about a minute depending on the size of your graph and your hardware capability.
Only users with the superuser role can clear the graph data.
|
Clear Graph Data deletes all data from your database irreversibly. Only the schema and queries will remain. However, if you clear the graph data by accident, the data will remain in your filesystem.
You can start over and re-load the data into the database with the "start/resume loading" button |