Eigenvector Centrality
Eigenvector centrality (also called eigencentrality or prestige score) is a measure of the influence of a vertex in a network. Relative scores are assigned to all vertices in the network based on the concept that connections to high-scoring vertices contribute more to the score of the vertex in question than equal connections to low-scoring vertices.
A high eigenvector score means that a vertex is connected to many vertices who themselves have high scores.
Specifications
CREATE QUERY tg_eigenvector_cent(SET<STRING> v_type_set, SET<STRING> e_type_set,
 INT maximum_iteration = 100, FLOAT conv_limit = 0.000001, INT top_k = 100,
 BOOL print_results = True, STRING result_attribute = "", STRING file_path = ""
 )
Parameters
| Name | Description | Default value |
|---|---|---|
|
Vertex types to assign scores to. |
(empty set of strings) |
|
Edge types to traverse. |
(empty set of strings) |
|
Maximum number of iteration. |
100 |
|
The convergence limit. |
0.000001 |
|
The number of vertices with the highest scores to return. |
100 |
|
If true, print results to JSON output. |
True |
|
If not empty, save the score of each vertex to this attribute. |
(empty string) |
|
If not empty, print results in CSV to this file. |
(empty string) |
Output
Returns an eigenvector centrality score for all vertices of the specified type in the graph. The results are ordered from most central to least central.
There is an optional parameter, top_k, that limits the results to an arbitrary number of vertices with the highest scores in the graph.
This can be useful for larger graphs, since in large graphs there are likely to be many vertices with very low centrality.
The maximum result size is equal to \(V\), the number of vertices, because one centrality score is calculated for each vertex.
Example
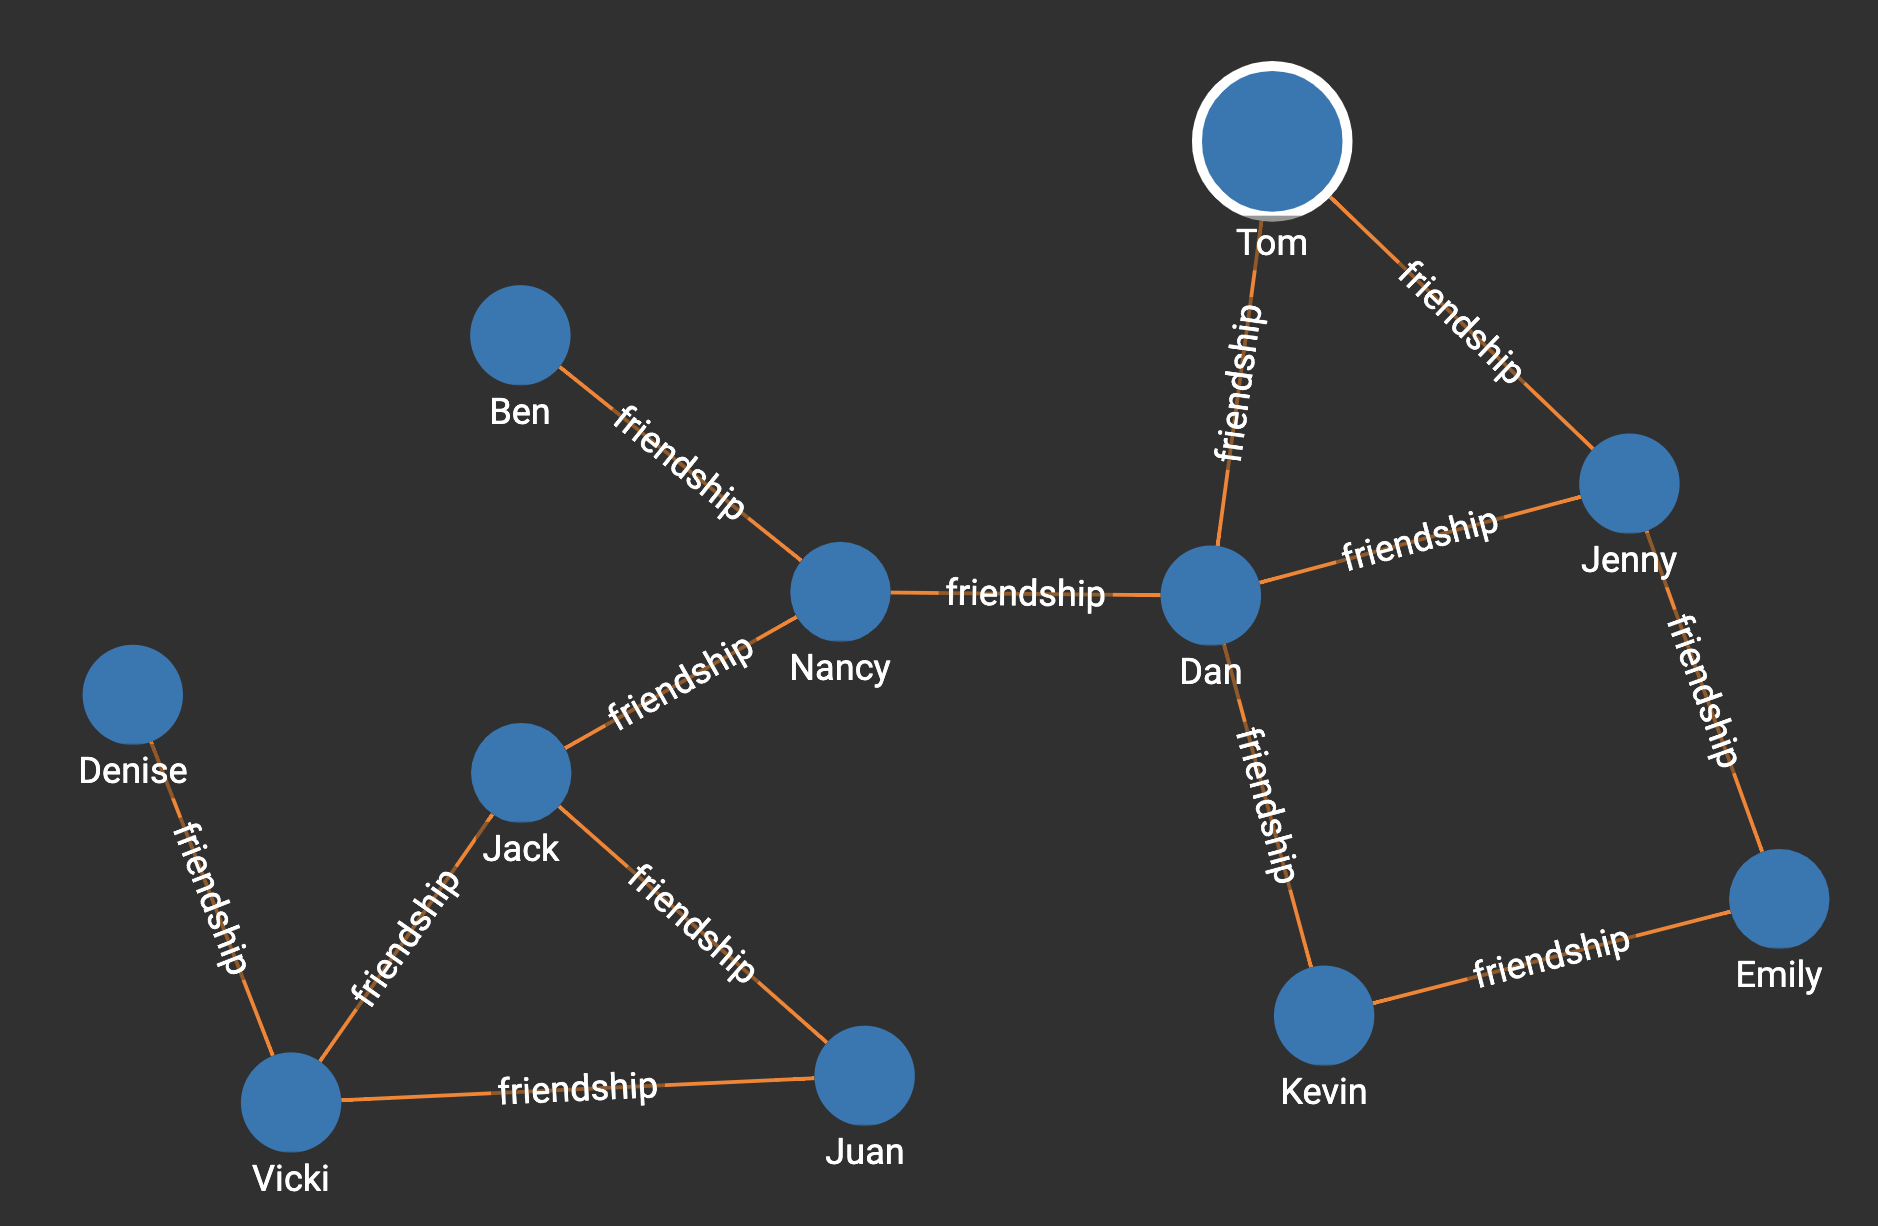
Suppose we have the following graph:

Running the algorithm on the graph will show that Dan has the highest centrality score.
RUN QUERY tg_eigenvector_cent(["person"], ["friendship"])[
{
"top_scores": [
{
"Vertex_ID": "Dan",
"score": 0.52728
},
{
"Vertex_ID": "Jenny",
"score": 0.42913
},
{
"Vertex_ID": "Tom",
"score": 0.35588
},
{
"Vertex_ID": "Nancy",
"score": 0.33529
},
{
"Vertex_ID": "Kevin",
"score": 0.2967
},
{
"Vertex_ID": "Emily",
"score": 0.27009
},
{
"Vertex_ID": "Jack",
"score": 0.24902
},
{
"Vertex_ID": "Vicki",
"score": 0.17584
},
{
"Vertex_ID": "Juan",
"score": 0.15809
},
{
"Vertex_ID": "Ben",
"score": 0.12476
},
{
"Vertex_ID": "Denise",
"score": 0.06543
}
]
}
]