Pie Chart Widget
The Pie Chart Widget displays a standard pie chart to show the proportional size of data values.
Inputs
Accepts data as vertices and edges or a list of objects that contain at least one numeric attribute. There must be one attribute that can comprise the category labels and one attribute that comprises the values.
Widget window
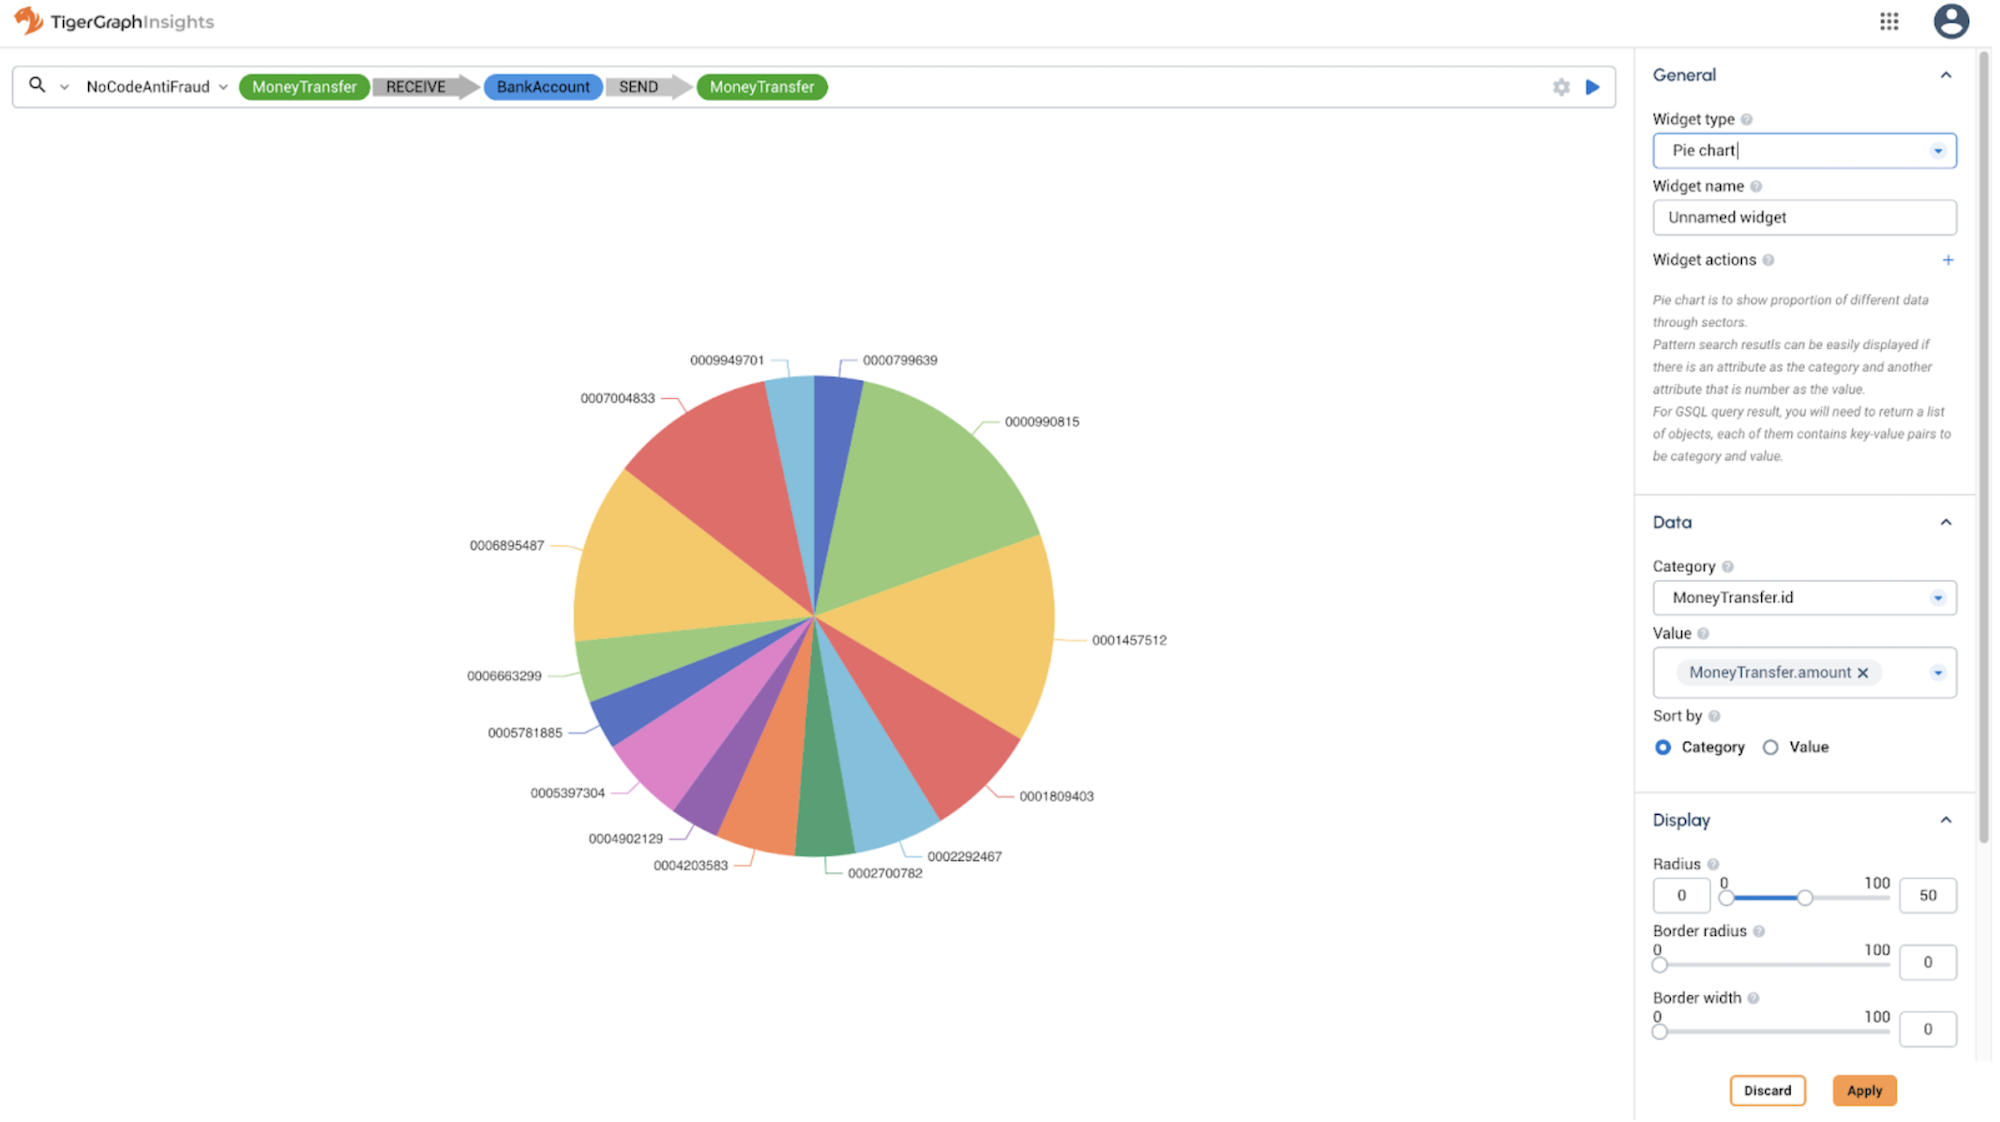
Visual customization
Use the Display section in the menu on the right side of the screen to set the inside and outside radius of the pie chart, the corner radius, and the border width.
You can customize which attributes are mapped to the category and value sections of the pie slices. Values must be numeric.
The pie chart can be adjusted to show as a Nightingale chart, also known as a polar rose diagram.