Overview
TigerGraph GraphStudio™ is a graphic user interface that provides an intuitive, browser-based interface to easily accomplish graph-based application development tasks.
Feature Overview
GraphStudio provides the following features:
1. Design Schema
The Design Schema page is where users edit their graph schema. Users will be able to add and specify the attributes and fields of every vertex and edge they add to the schema and also customize the colors and icons displayed on each vertex or edge. Users will also be able to edit existing vertices and edges in the existing schema in this page.
For more details, see Design Schema
2. Map Data To Graph
The Map Data To Graph page is where users will add data files and map it to the corresponding vertices or edges in the schema. In this page users will be able to add data files as the data source to load their data into the database. Users will also be able to specify the delimiter used to separate the fields in each file. This page also provides the tools that users can use to map each data file to the corresponding vertices and edges that the data should be loaded to. Users will also be able to map each data field in each data file to the corresponding attributes within each vertex or edge.
For more details, see Map Data To Graph
3. Load Data
The Load Data page is where users load their data from their data source to the database. The data is loaded in correspondence with the mapping specified in the Map Data To Graph page. Users can either load all the files in one go or load data from each file individually. In this page users will also be able to see the load status of each file, the speed at which the loading is happening, the size of data that has been loaded and other information pertaining to data loading.
For more details, see Load Data
4. Explore Graph
The Explore Graph page is where users can explore their graph data and uncover insights based on their data. Here users can search for vertices in a graph, discover nearby vertices, find paths between vertices, and run gsql queries. Users will also be able to use the Graph Exploration panel in this page to modify and augment the visualization of their exploration results.
For more details, see Explore Graph
5. Build Graph Patterns
The Build Graph Patterns page is where users can build graph business logic queries visually. In this page we provide tools that users can use to build visual patterns visually in drag and drop fashion. In this way, users will not need to understand any gsql to build business logic queries. The users will be able to run these visual patterns, and check out the results. Users will also have the option to see, copy and save the corresponding generated gsql code if they want to do so.
For more details, see Visual Query Builder
6. Write Queries
The Write Queries page is where users can write and test out their gsql queries. In this page we provide users a query editor where the users can write their gsql code on. The query editor also validates the user’s query syntax and will let the user know if the syntax is wrong. Users can also install their queries on this page and run it to see the results of their queries. If the user does not install their queries first, the queries will be run on interpreted mode.
For more details, see Write Queries
GraphStudio Online Test Drive
Visit TigerGraph Test Drive demos at: https://testdrive.tigergraph.com/
The GraphStudio online Test Drive features several instances of the TigerGraph system, each one targeting a different use case. Each copy of TigerGraph has a GraphStudio interface and is preloaded with application-specific queries and synthetic data. These demo applications are provided in a read-only mode. Users can explore and play with pre-installed queries. Users on these demo systems cannot save changes to the graph schema, the loading job, or queries. The corresponding buttons are disabled.
GraphStudio Availability
Cloud
If you are using GraphStudio in the TigerGraph Cloud environment, you can directly access GraphStudio via your browser.
On-Prem
For on-prem deployment, the server by default is listening on port 14240. Any machine connected to the server can access GraphStudio from a browser with the following address:
http://<your_tigergraph_server_ip_address>:<your_tigergraph_server_port>If you cannot access GraphStudio, check your firewall rules and open 14240 port to public. For example, if your Linux OS uses firewall-cmd:
$ firewall-cmd –zone=public –add-port=14240/tcp –permanentIf you see the error message "Oops, looks like something went wrong" on the login page, the GUI service might be off.
| This error might also be caused by an IP range block rule from your ad blocker. Please try turning off your ad blocker for the GraphStudio page and try again. |
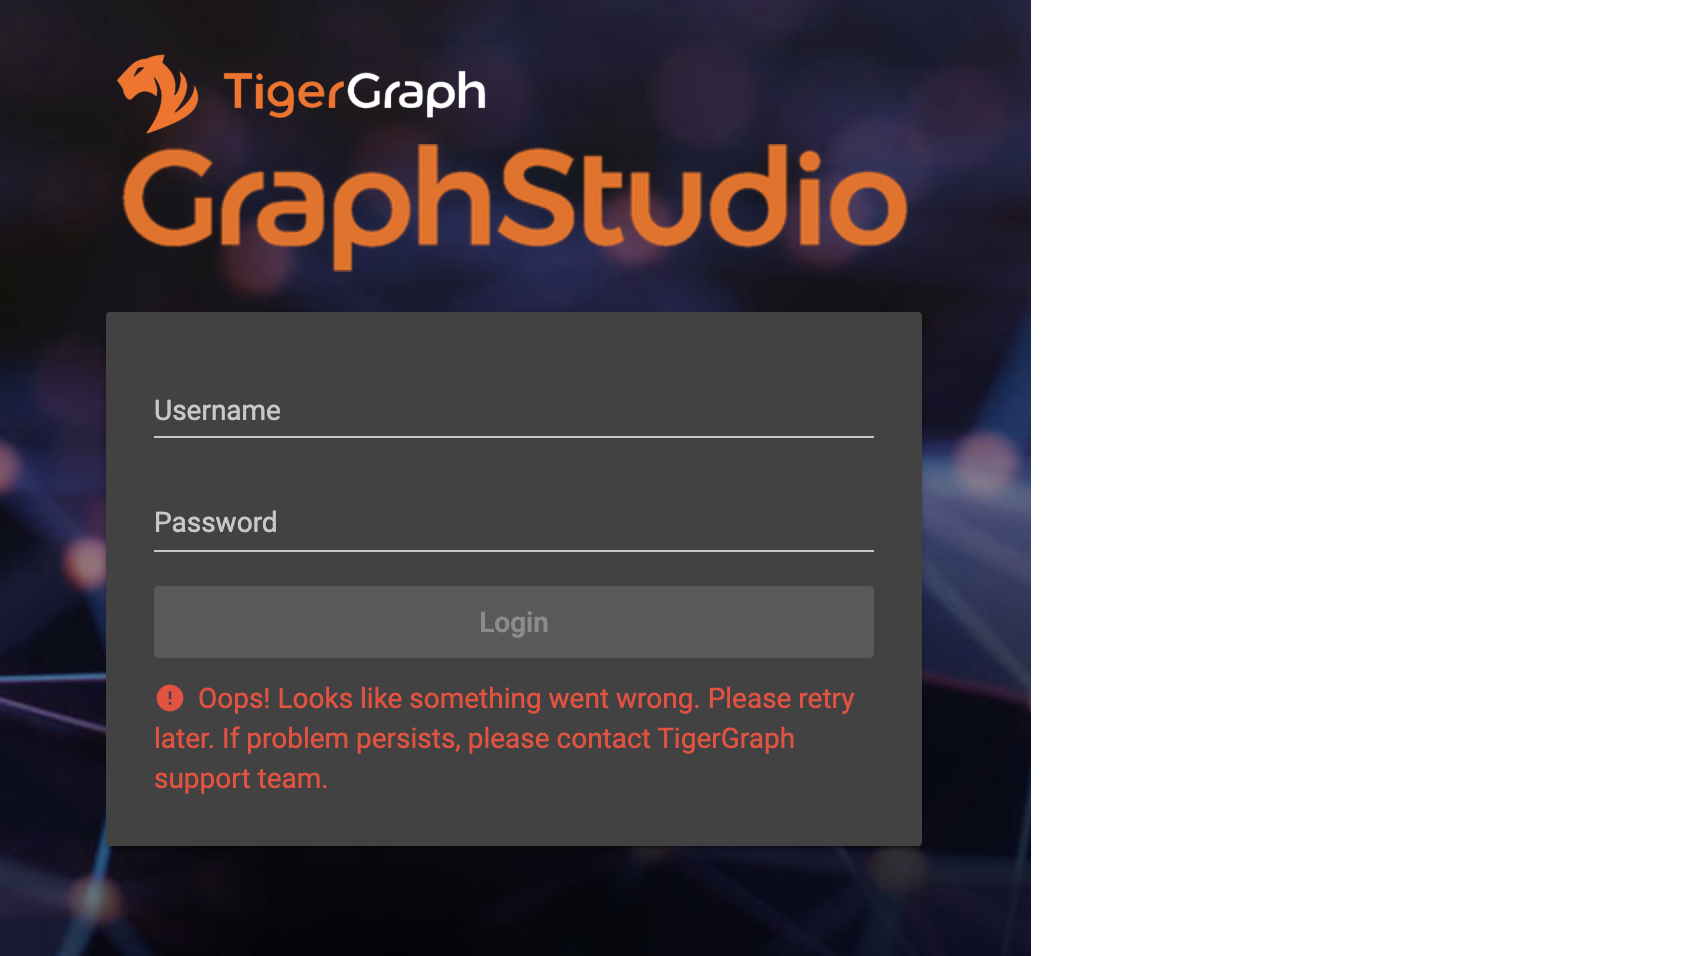
To verify, in a linux shell of the server, run the following:
$ gadmin status gui
If it is off, turn it on by running:
$ gadmin start guiNavigating Features Inside GraphStudio
The home page of GraphStudio contains links to each of the six steps of
solving a business problem: Design Schema, Map Data To Graph, Load Data,
Explore Graph, Build Graph Patterns and Write Queries. Users can also
navigate to each step from the buttons in the left menu bar. Each of
these major steps has its own page. To hide/show the left menu bar,
click the top-left menu
button:
 . Clicking
the logo on the top of the left
menu
. Clicking
the logo on the top of the left
menu ![]() will
take you back to the home page. You can
click
will
take you back to the home page. You can
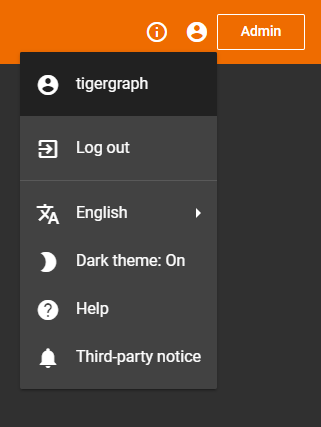
click  to go to
the Admin Portal (read more at Admin Portal UI
Guide).
to go to
the Admin Portal (read more at Admin Portal UI
Guide).
.png)
Switch Between Dark And Light Theme
GraphStudio provides two themes: dark theme and light theme. By default
it uses dark theme. You can click the User
icon  and then toggle
the Dark theme to be Off to switch to light theme:
and then toggle
the Dark theme to be Off to switch to light theme:
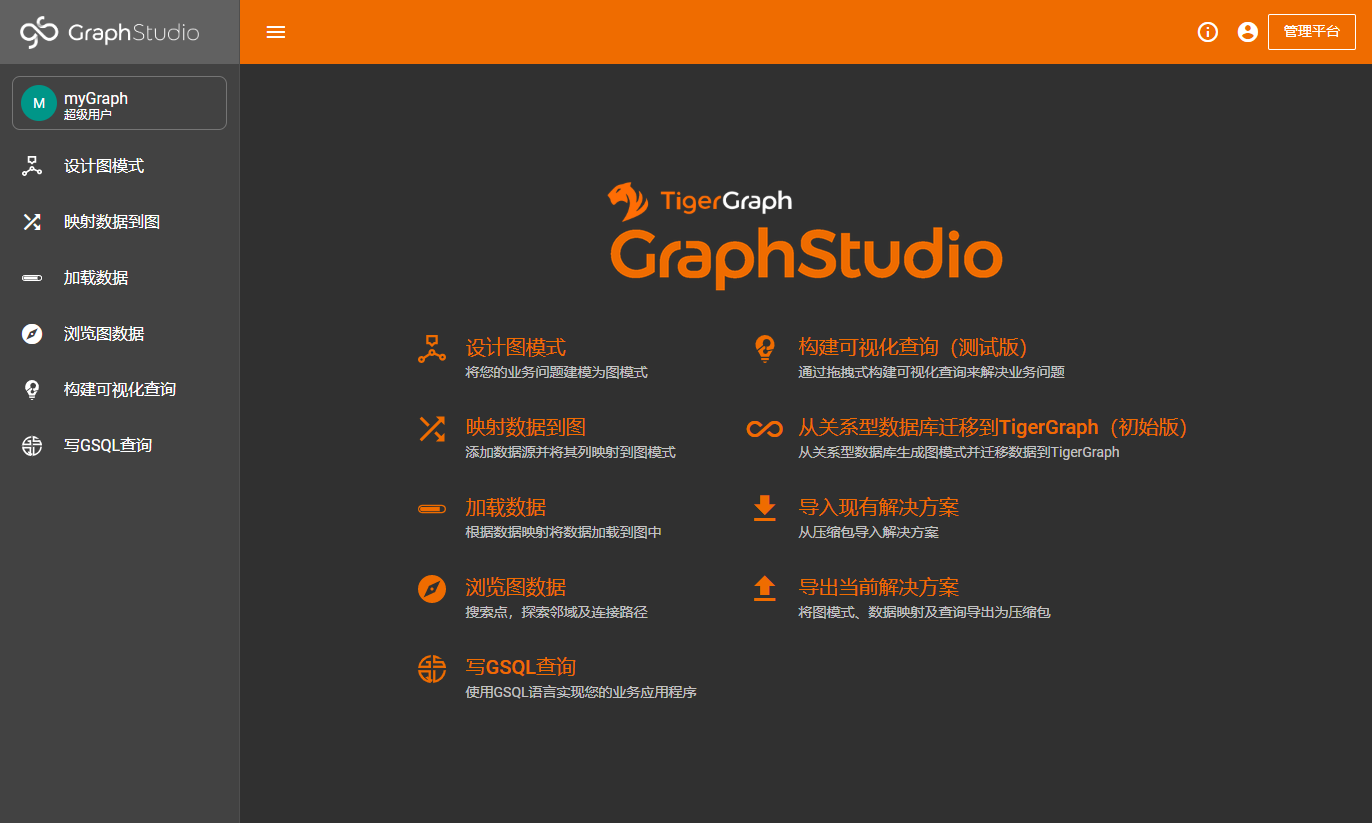
Switch Between Languages
GraphStudio supports 2 languages: English and Chinese. By default it
uses English. You can
click and then select a
language:
.png)
This shows what Home page looks like if you choose Chinese.
GraphStudio Session Timeout
GraphStudio has a default session timeout of 1 week. If, during this time, the user has no interaction with the page, the session will expire and the user will be logged out automatically. The timeout can be configured with:
$ gadmin config set GUI.ClientIdleTimeSec [timeout]Browser Support
As of Jan 2020, the GraphStudio UI is certified on following browsers:
| Browser | Chrome | Safari | Firefox | Opera | Edge | Internet Explorer |
|---|---|---|---|---|---|---|
Supported version |
54.0+ |
11.1+ |
59.0+ |
52.0+ |
80.0+ |
10+ |
Not all features are guaranteed to work on other browsers.
Please make sure to enable JavaScript and cookies in your browser settings.
GraphStudio Limitations
Some features which are available in GSQL are not available in GraphStudio.
Design Schema
-
Fixed binary data types are not supported.
-
PRIMARY KEY and composite key are not supported.
Map Data To Graph
-
Cannot load JSON data.
Load Data
-
Data loading jobs written in a GSQL console are not shown in GraphStudio.
-
USING options are not available.
-
Concurrent loading is not available.
Write Queries
-
You cannot define a user-defined function (you can use the user-defined functions created from TigerGraph server by importing the solution which contains pre-defined UDFs into GraphStudio).