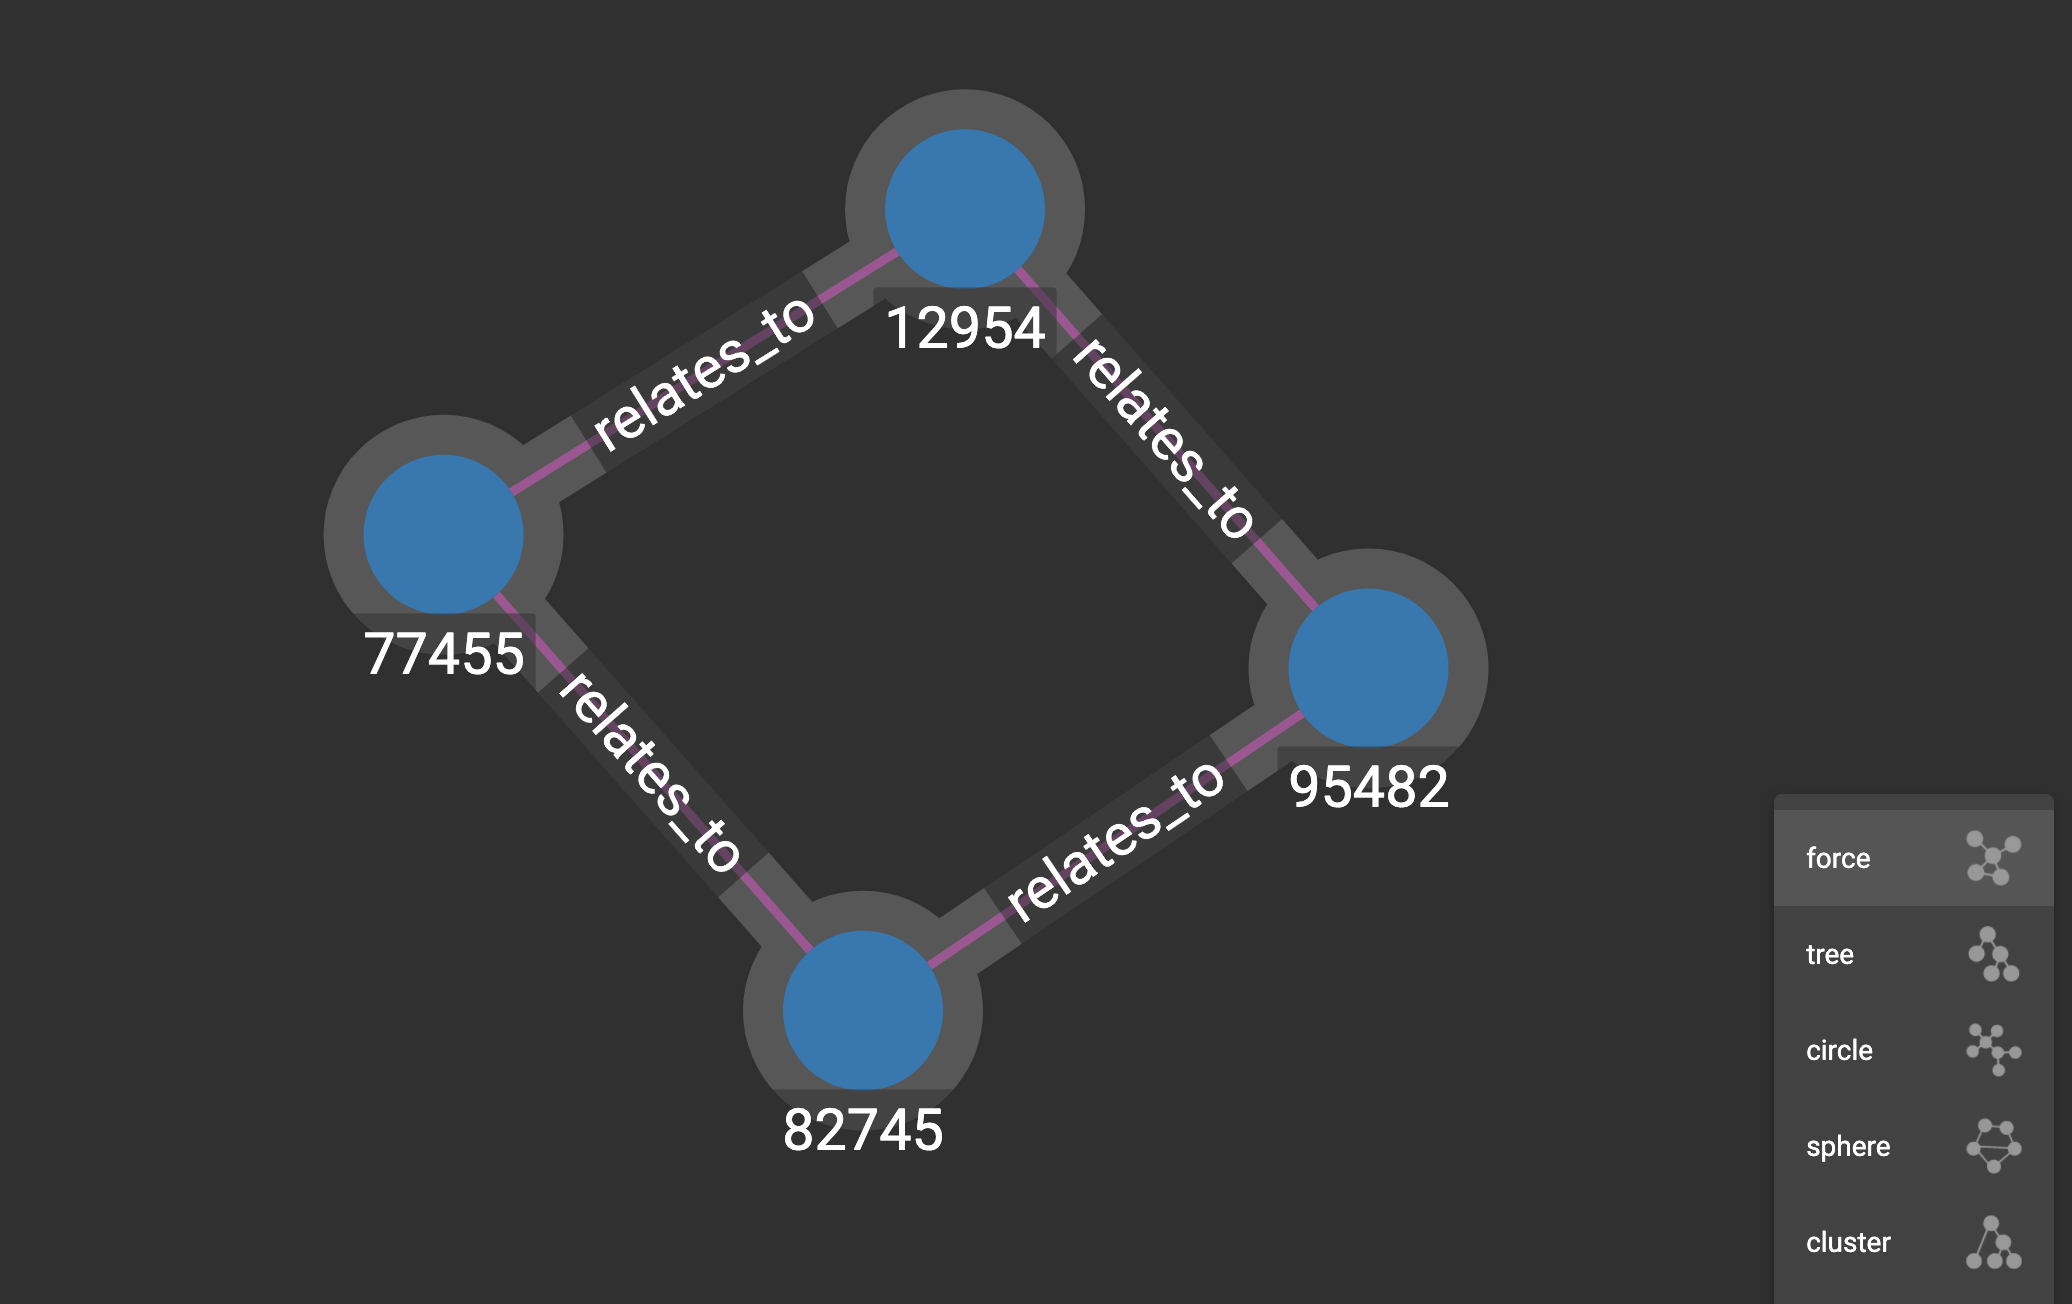
Graph Exploration Panel
The Graph Exploration panel displays the result of your Graph Exploration actions. After you have a subgraph displayed in the Graph Exploration Panel, you can use the buttons in the Explorer View Menu or the options in the bottom right corner to customize the display. Additionally, you can make modifications to the graph database itself in edit mode.

Customize visualization
The Graph Exploration panel provides you with multiple ways of customizing the visualization of your graph exploration results.
Zoom in/out
Although you can use a mouse scroller to zoom in and zoom out the graph exploration result, you can also use the two buttons in the bottom-right corner to do that: 
Refresh result
The graph exploration result only reflects a snapshot of the graph data. If the data is changed due to CRUD operations (maybe in another session), the snapshot is outdated.
You can click the refresh button ![]() to get all vertices and edges synced with the graph database. All vertices and edges that already got removed will be removed from the exploration panel, and all the attribute values will also get updated.
to get all vertices and edges synced with the graph database. All vertices and edges that already got removed will be removed from the exploration panel, and all the attribute values will also get updated.
Export result
You can export the current visualization result as a png file or a zip file containing csv files by clicking  . When you click the button, a drop-down menu will appear, as shown below:
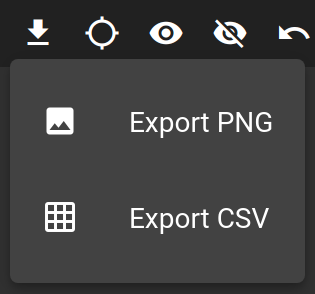
You can select different export types by clicking on different items.
When you choose to Export PNG, your browser will automatically download a picture named export.png.
Below is an example of an exported .png file.

You can also choose the Export CSV option, and your browser will download a zip file named [GraphName]_export_vertices_and_edges.zip.
The zip file contains .csv files that describe the exploration result.
Each file corresponds to a vertex or edge type:
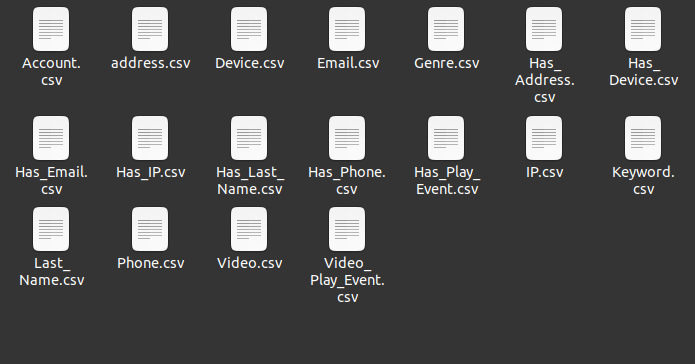
The CSV file for each vertex type contains Vertex ID and Vertex Type, in addition to the attributes of each vertex. Below is an example:

For edge types, the CSV file contains Edge Type, Source Vertex ID, Source Vertex Type, Target Vertex ID, Target Vertex Type and any edge attributes. Below is an example:

|
If a user does not have the APP_ACCESS_DATA privilege, Export PNG and Export CSV buttons will be disabled. |
Locate vertex
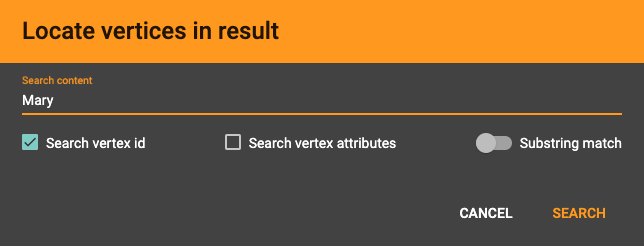
The Locate Vertex In Result feature  searches for and then zooms in on vertices that match the given value for ID and/or attribute.
For example, if you type "Mary" in Locate Vertices in Result popup window, and have both of the checkboxes selected, then this feature will look for any vertices where "Mary" is an exact match for either the ID or any of the attribute values.
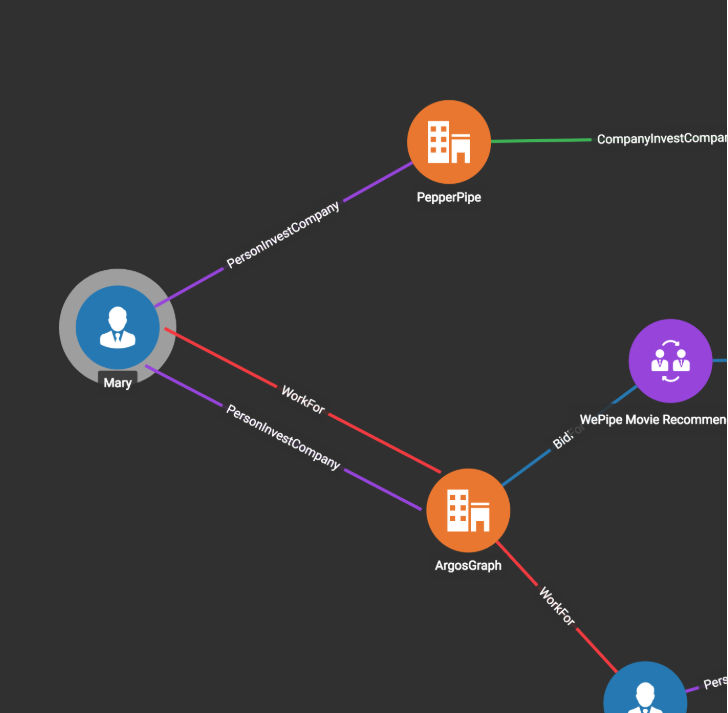
Those vertices will be selected (and all other objects will be unselected). The display will zoom in to focus on the selected objects.
The vertices with the matching ID or attributes will be selected:
Show selected vertices and edges
Click the Show Selections button  to hide all the vertices and edges which are not currently selected. However, if the two endpoints of an edge are selected, the edge will be selected as well. Also, if nothing is selected, nothing will be hidden.
Hide vertices and edges
Click the Hide button  to hide the currently selected vertices and edges. If nothing is selected, all vertices and edges in the Graph Exploration Panel will be hidden.
Undo and redo
The Explore Graph page records the whole history of the current session’s changes to the visualization result set. Click the Undo and the Redo buttons  to go back or forward in the history.
|
Database changes (adding or deleting vertices/edges, editing attributes) cannot be undone with the Undo feature. |
Save and open graph exploration result
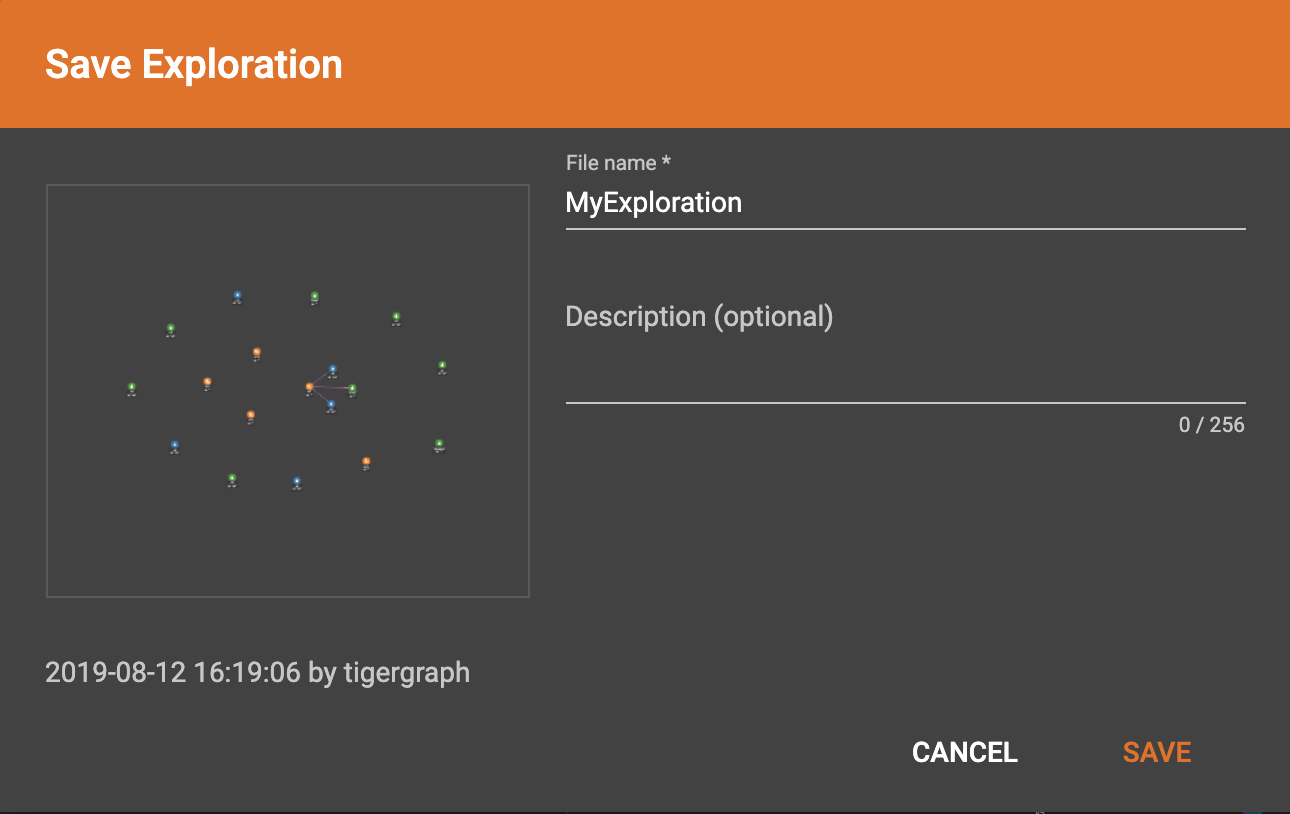
When you find something interesting during exploration and want to save the result as a picture, you can click the Save Exploration button  . In the popup window, you can give the result a file name and an optional description, then click Save:
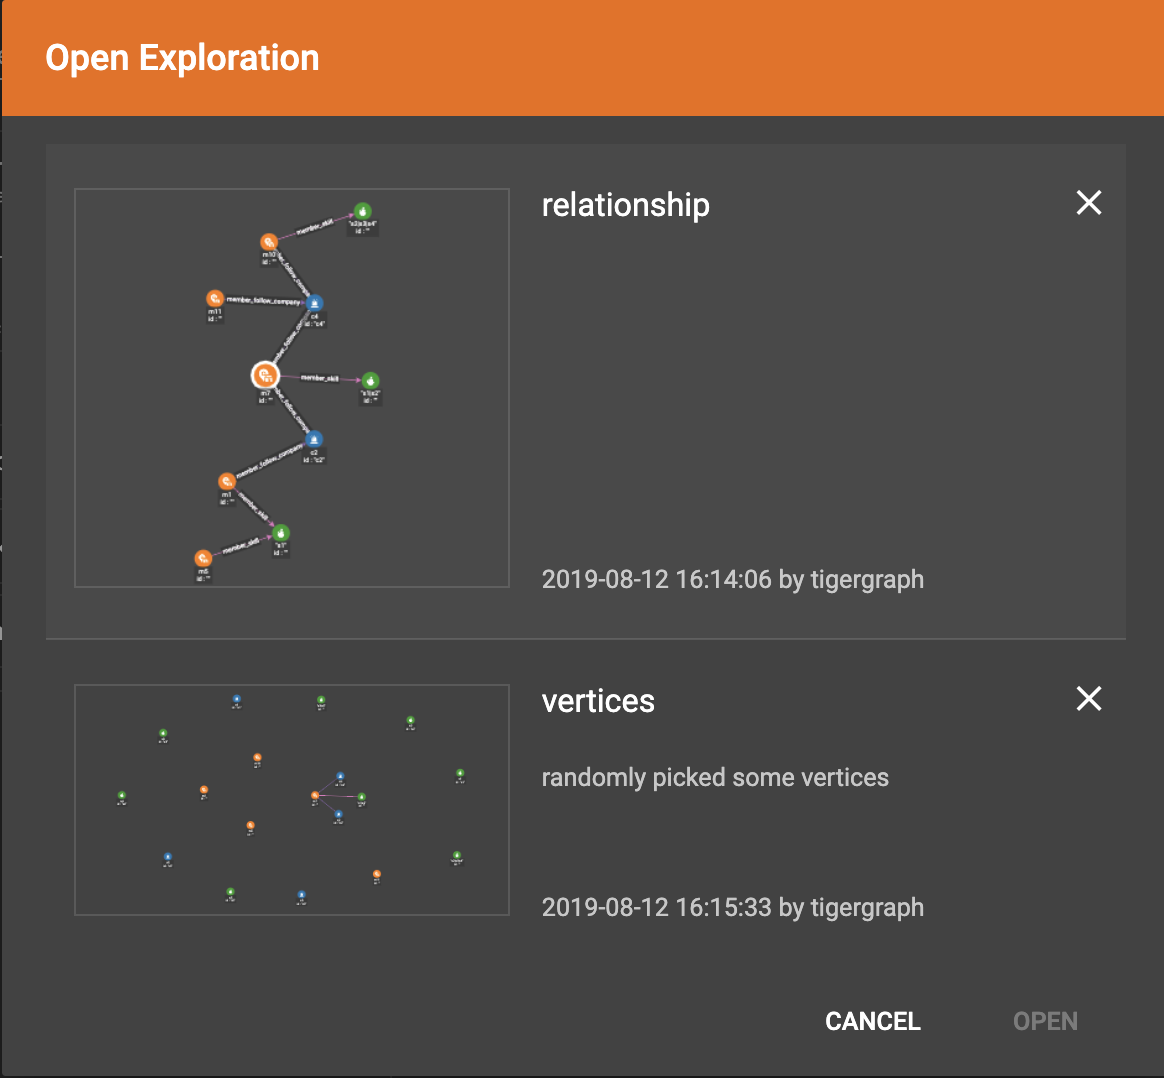
In the future, you can open a previously saved exploration result by clicking the Open Exploration History button  and choose one result from the list:
Save screenshot
When you find something interesting during exploration and want to save the result as a picture, you can click the Save Screenshot button  . The exploration result will be saved as a PNG picture to your local file system.
Change settings
To change graph exploration settings by clicking Settings button  .
Currently, you can select what attributes to show for each vertex type and edge type, and set whether to show an object’s detailed information in a popup tooltip when the cursor hovers over it.
Click Apply and the new settings will take effect.

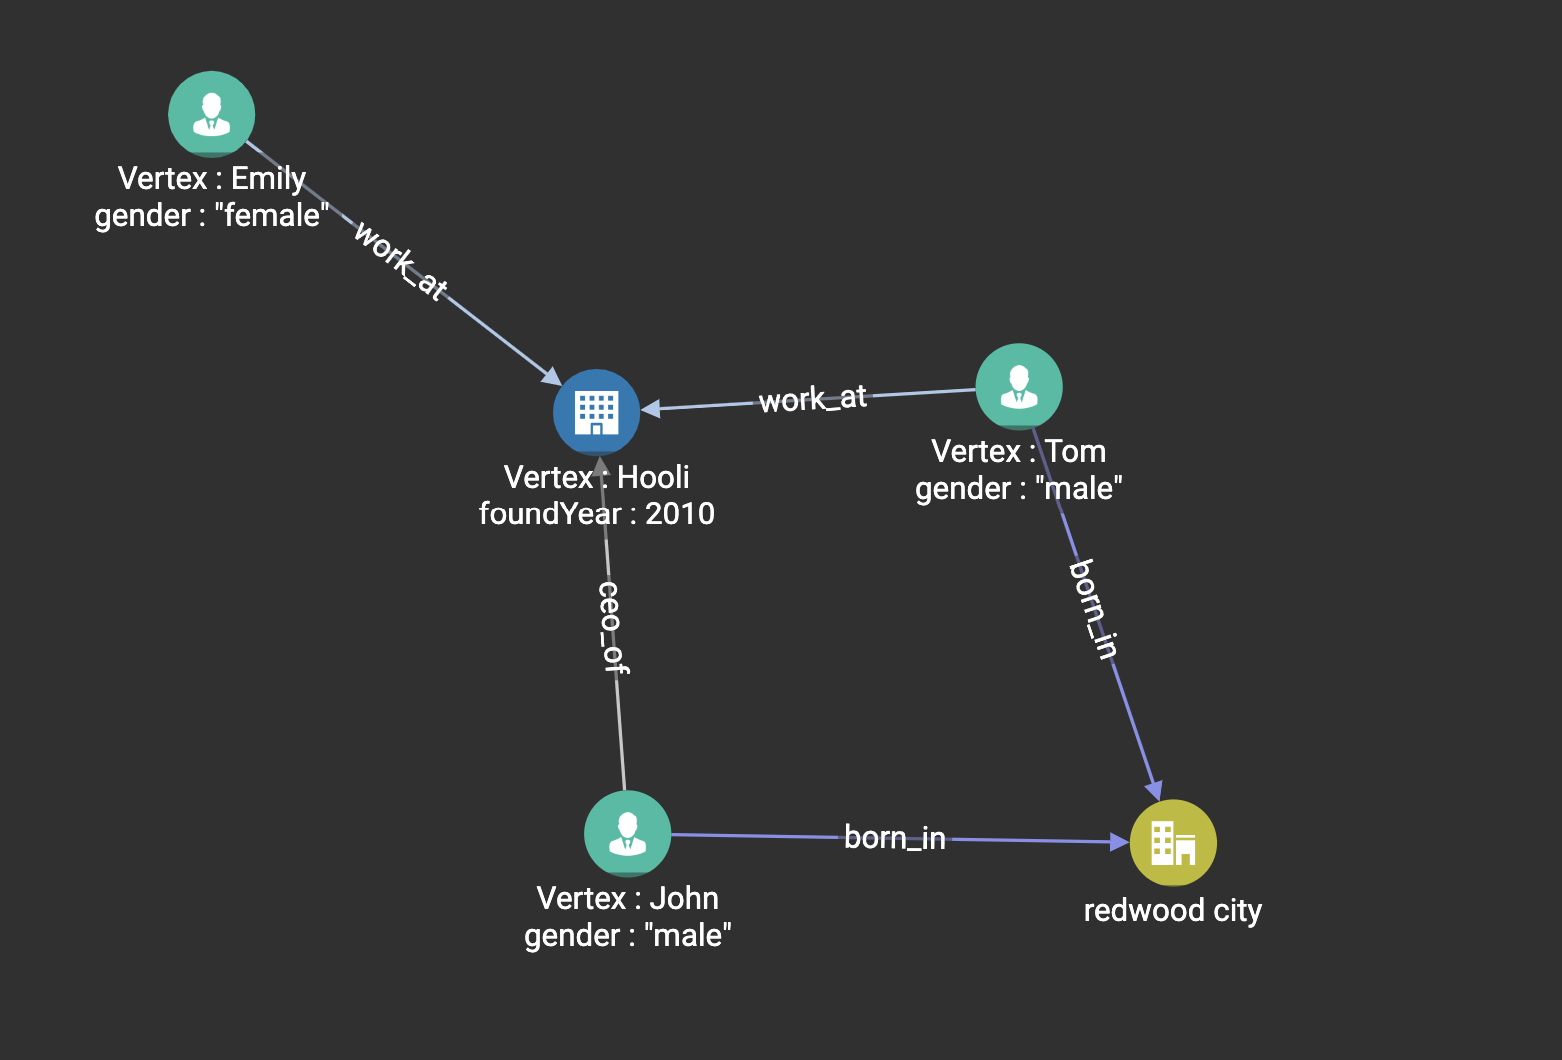
In the example below, the ID and gender for person vertices are shown. The ID and the foundYear attributes for company vertices are shown.
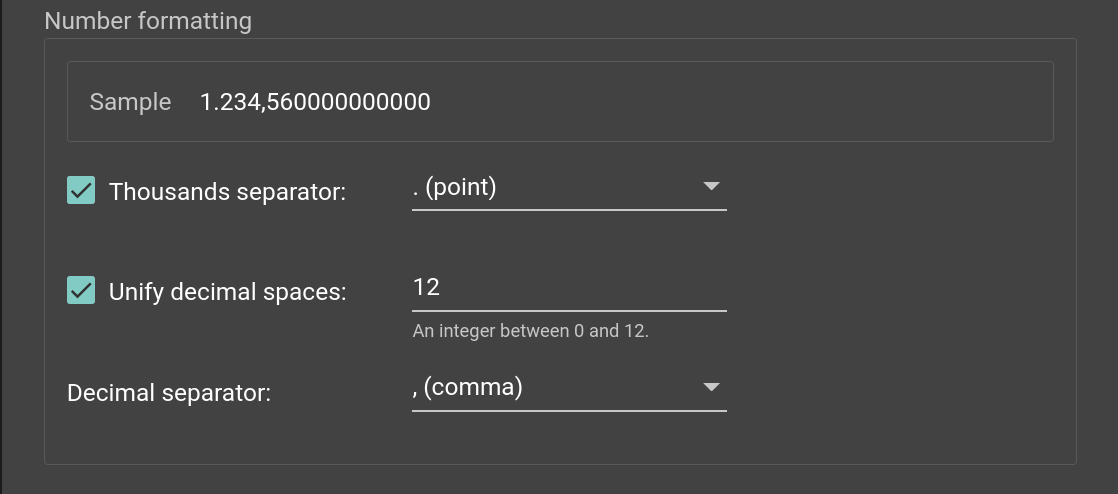
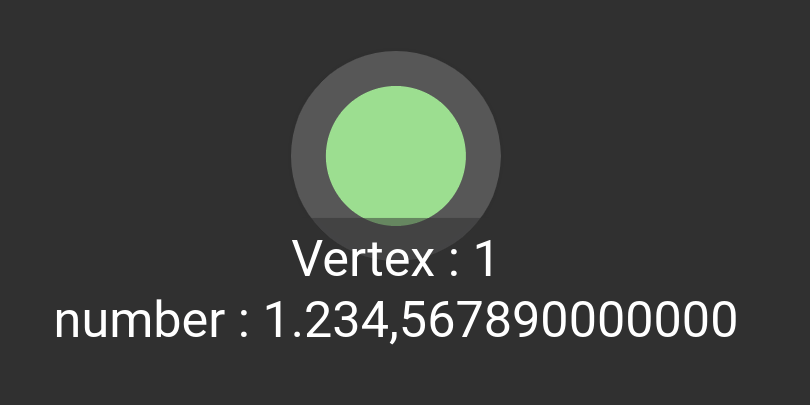
You can set the number format you want to display through settings. This setting allows you to define the thousandth place and its separator, the number of decimal places and its separator. Every time you modify the settings, a sample at the top will show your modifications in real time.
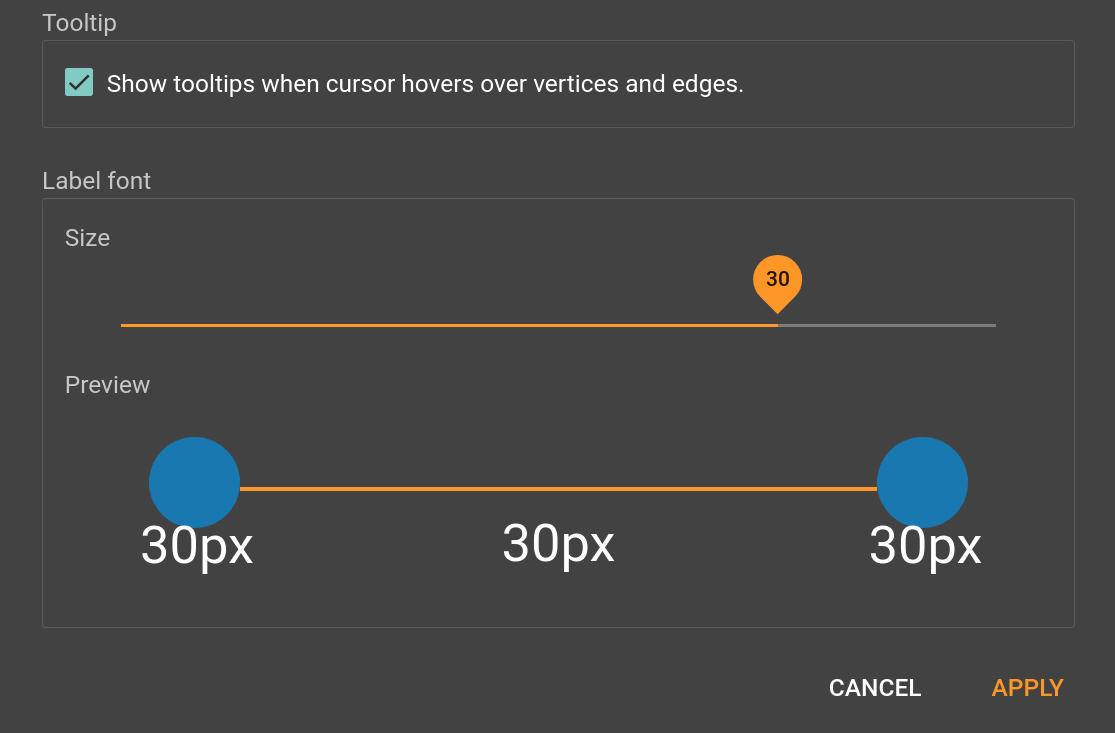
You can also configure the text font size of vertex and edge labels and properties.
Other than the above, you can also configure vertex and edge size and color to augment the visualization in settings. See Augment Visualization Result.
Edit graph
Beside customizing the view of your graph exploration results, you can also enable the edit mode and make edits to the graph itself by adding or removing vertices and edges, as well as changing their attributes.
In order to perform any of the actions in this section, you need to enable edit mode by clicking on the toggle next to Edit mode. Once you are in the edit mode, the four buttons that allow you to edit the graph will appear on the right.

Add new vertex
In edit mode, click the Add New Vertex button  to add a new vertex to the graph database. The Add New Vertex window will pop up. Choose a vertex type and then fill in values for the ID and the attributes. Click ADD and the vertex will be inserted into the TigerGraph database. It will also be shown in the Graph Exploration Panel.
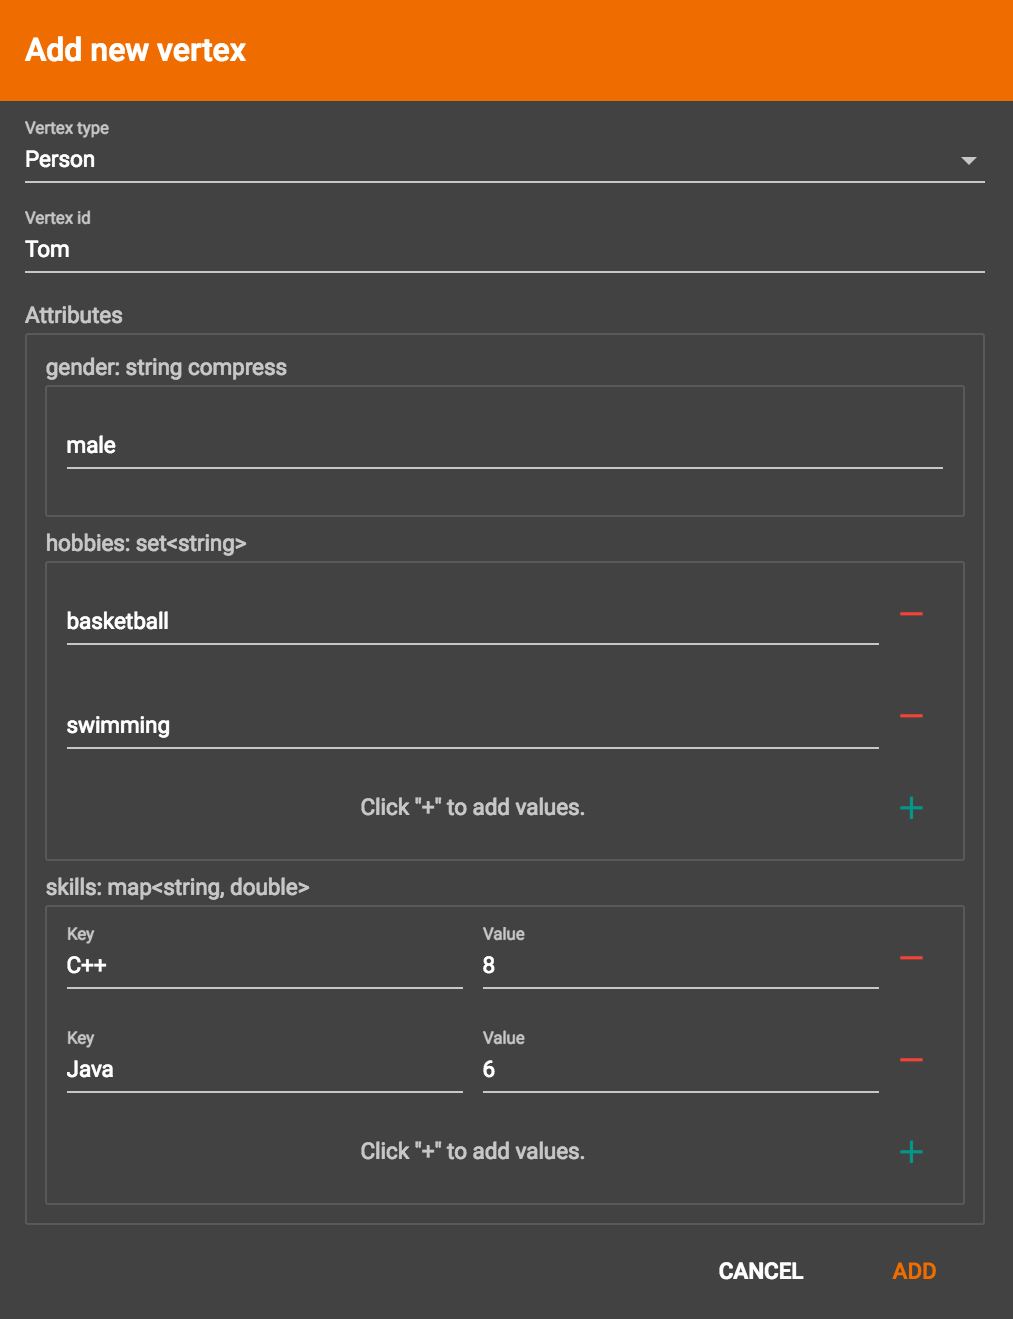
|
If you provide a vertex ID that is already used, GraphStudio will ask you whether you want to overwrite the existing vertex. If you say no, then it will not add or update anything. |
Add new edge
In edit mode, click the Add New Edge button  to add a new edge to the graph database. Next, click the source vertex of the edge in the Graph Exploration Panel, and then click the target vertex of the edge. Then the Add New Edge panel will pop up. Choose the edge type from the dropdown menu. Only types that match the two vertices you selected are shown. (It is possible that there are no eligible edge types). Fill in values for attributes and click ADD. Your new edge will be inserted into the TigerGraph database. It will also be shown in the Graph Exploration Panel.
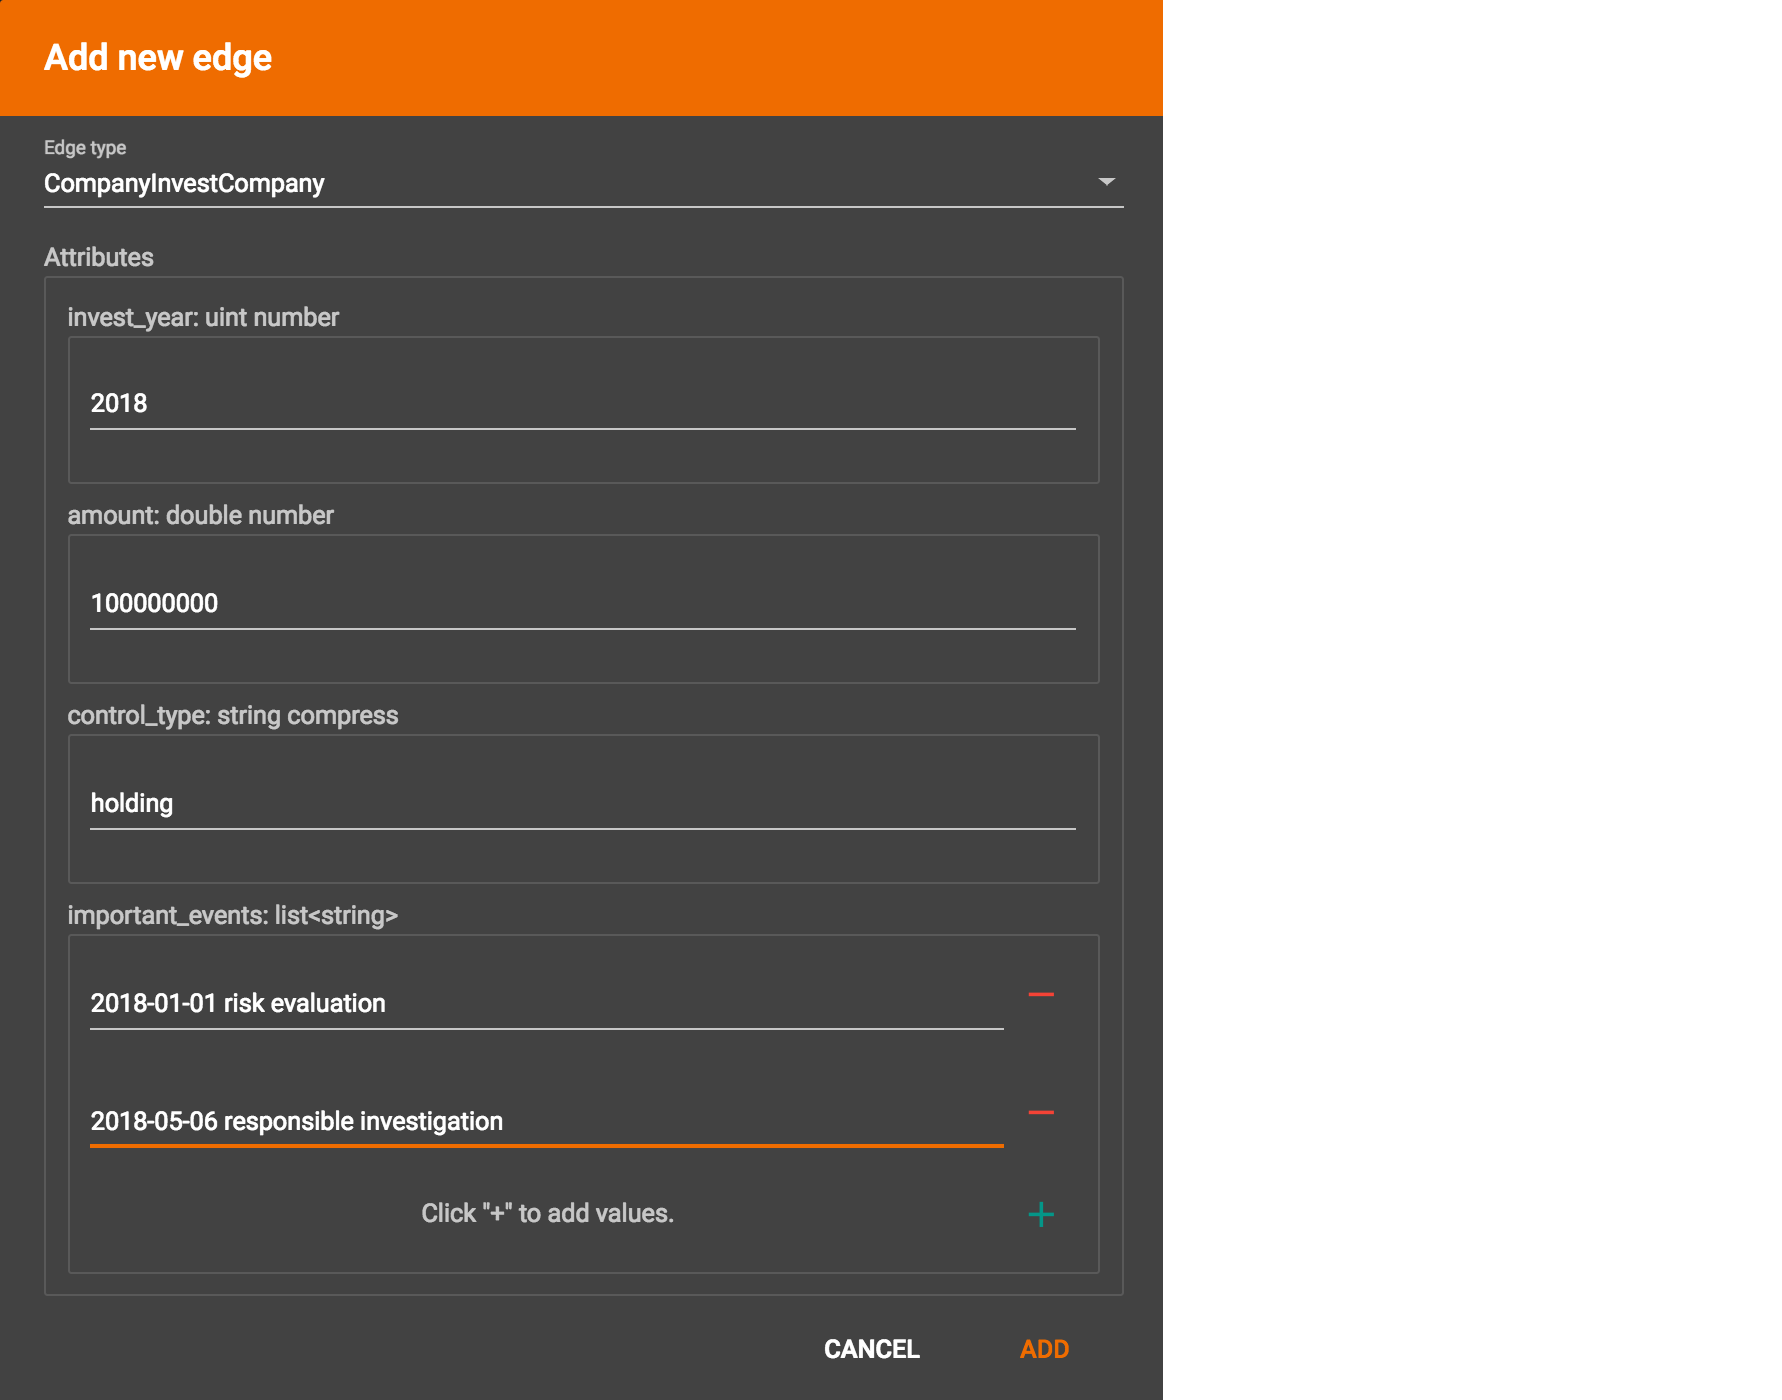
|
If you select an edge type that already exists between the two vertices, GraphStudio will ask if you want to overwrite the existing edge. If you say no, nothing will be added or updated. The current TigerGraph system does not support having multiple edges of the same type between two specific vertices. |
Edit attributes
To edit the attributes of one vertex or edge, select one object and then click the Edit Attributes button  in edit mode.
The edit attributes panel will pop up.
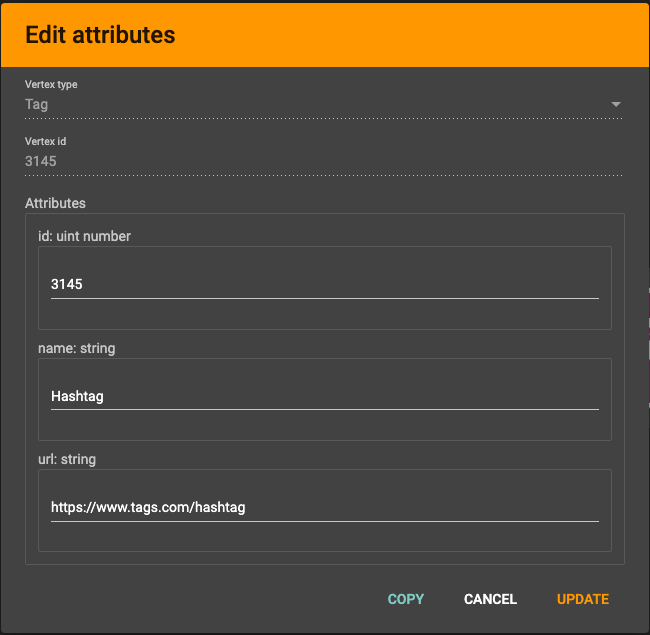
When you finish editing, click the Update button to apply the change.
Copy attributes
In the Edit Attributes window, click COPY to copy the attributes of a vertex or edge. The attributes are copied to clipboard in JSON format.
Delete vertices and edges
To delete vertices or edges, select the objects you want to delete, and click the Delete Selected Elements button  in edit mode.
|
"Delete" permanently removes data from the graph database. Deleted vertices and edges cannot be restored with Undo. To restore them, you must manually add them back. If you delete a vertex, all of its outgoing and incoming edges will also be deleted |

