Search for Vertices
The first button in the Explore Graph Menu is the "Search Vertices" option  . This option lets you select an initial set of vertices for your exploration. It is also the default option when you first enter the Explore Graph page. Clicking the button again will hide the Parameter Panel to increase space for the Graph Exploration Panel.
Search for vertices by ID
Choose a vertex type from the Vertex type dropdown list, and enter the vertex id in the Vertex id input box, then click the Search button. If there is one vertex that matches the vertex type and ID, it will be shown in the Graph Exploration panel.

Let GraphStudio pick vertices
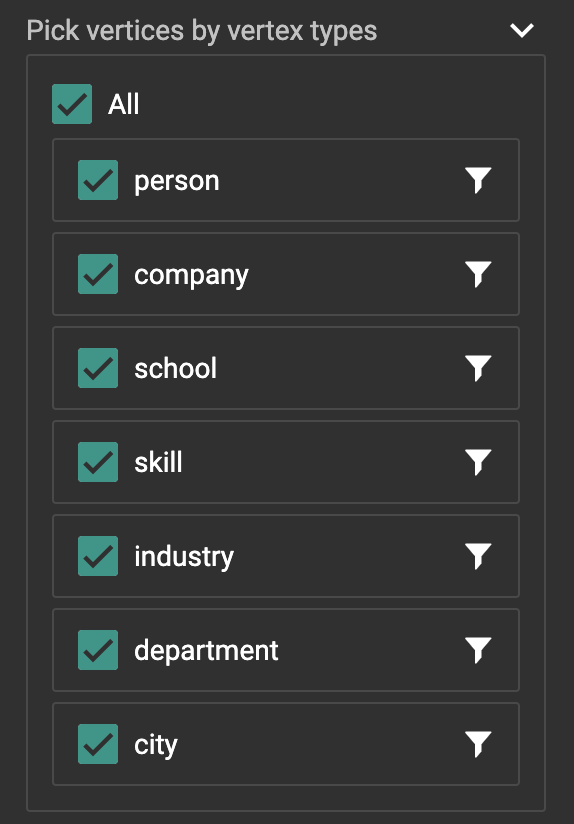
If you don’t have a particular vertex ID in mind, you can have GraphStudio pick some vertices for you. In the Parameter Panel, enter a number of vertices to pick, and click on the Pick vertices button . The explorer will pick this number of vertices for each vertex type included in your search.

The Configuration section in the Parameter Panel specifies which types of vertices you want to include in your selection. By default, all vertex types are selected. Uncheck some boxes if you want to narrow your selection.

Search with attribute filters
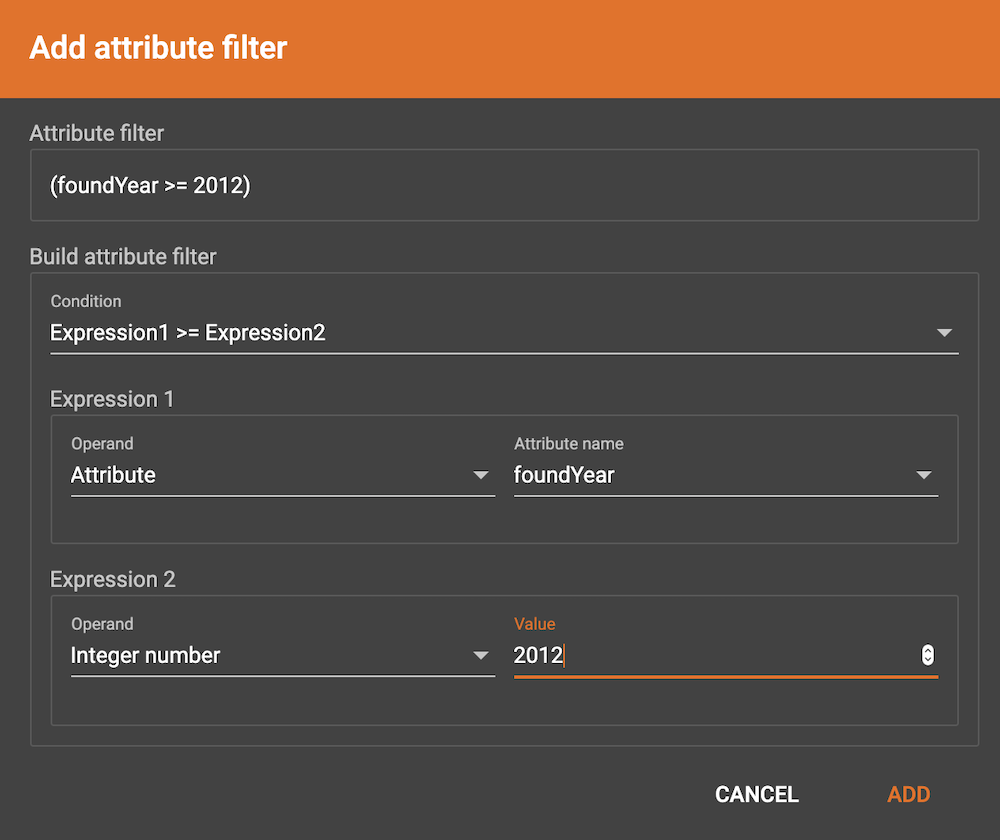
You can control vertex search in finer granularity by creating attribute filters. Click the filter button%20(1)%20(2).png) to the right of any vertex type. In the pop-up window, you can create a condition involving attributes of the vertex type. The user experience is the same as creating data filters when you do data mapping. Here is an example attribute filter for searching company vertices with
to the right of any vertex type. In the pop-up window, you can create a condition involving attributes of the vertex type. The user experience is the same as creating data filters when you do data mapping. Here is an example attribute filter for searching company vertices with foundYear >= 2012:

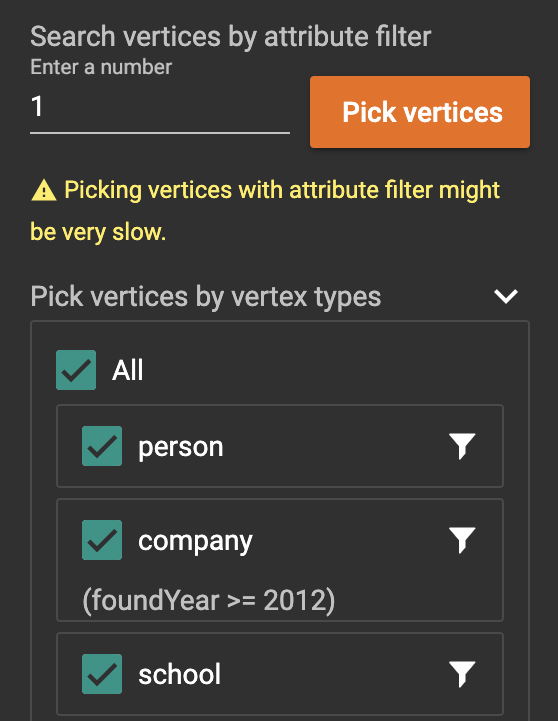
Click ADD, then the filter condition is shown below company vertex type:

Click the Pick vertices button  again, TigerGraph will search for up to 1 company vertex with a
 foundYear >= 2012.
|
If your graph contains a large number of vertices, searching vertices with attribute filters can be extremely slow. |
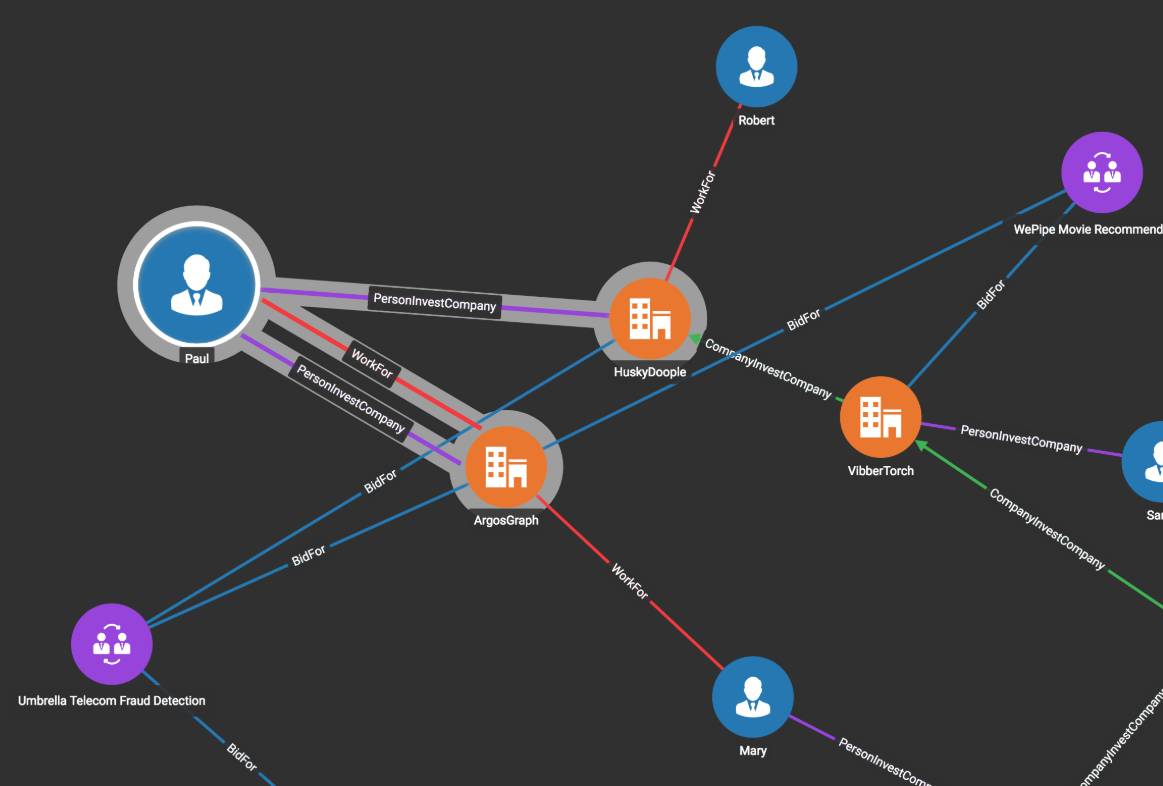
If you keep exploring the graph on the Explore Graph page, the previous exploration result won’t be automatically erased. Instead, your new exploration result will be merged together with the previous visualized graph. The objects from the most recent exploration will be selected (highlighted with a thick gray border) to distinguish them from the previous visualized graph.
