Log Files
TigerGraph captures key information about activities across its components through log files. These logs are essential for troubleshooting and auditing. Logs may contain sensitive information, so direct access is restricted.
This page provides an overview of the log files available in TigerGraph, including where to find them, how they are stored, and what information they contain.
Audit logs are structured in JSON, ensuring machine-readability and facilitating easy integration with third-party tools. TigerGraph Linux admin users also use the gcollect utility to search for and gather selected information from the logs. We also provide instructions on how to set up log viewing with Elasticsearch, Kibana, or Filebeat.
Available Log Files
TigerGraph generates a variety of log files for its different components. Understanding what logs are available and what they contain is the first step in effective troubleshooting and system monitoring.
Log File Locations
Logs in TigerGraph are stored in the log root directory, which is configured at install time. You can find this location by running:
gadmin config get System.LogRootWithin this directory, you will find subdirectories for each TigerGraph component (admin, gpe, gsql, gui, kafka, nginx, zk, etc.).
$ ls /home/tigergraph/tigergraph/log
admin       dict  executor    gpe  gsql  informant  kafkaconn     nginx       zk
controller  etcd  fileLoader  gse  gui   kafka      kafkastrm-ll  restpp
Use the gadmin log command to list log files:
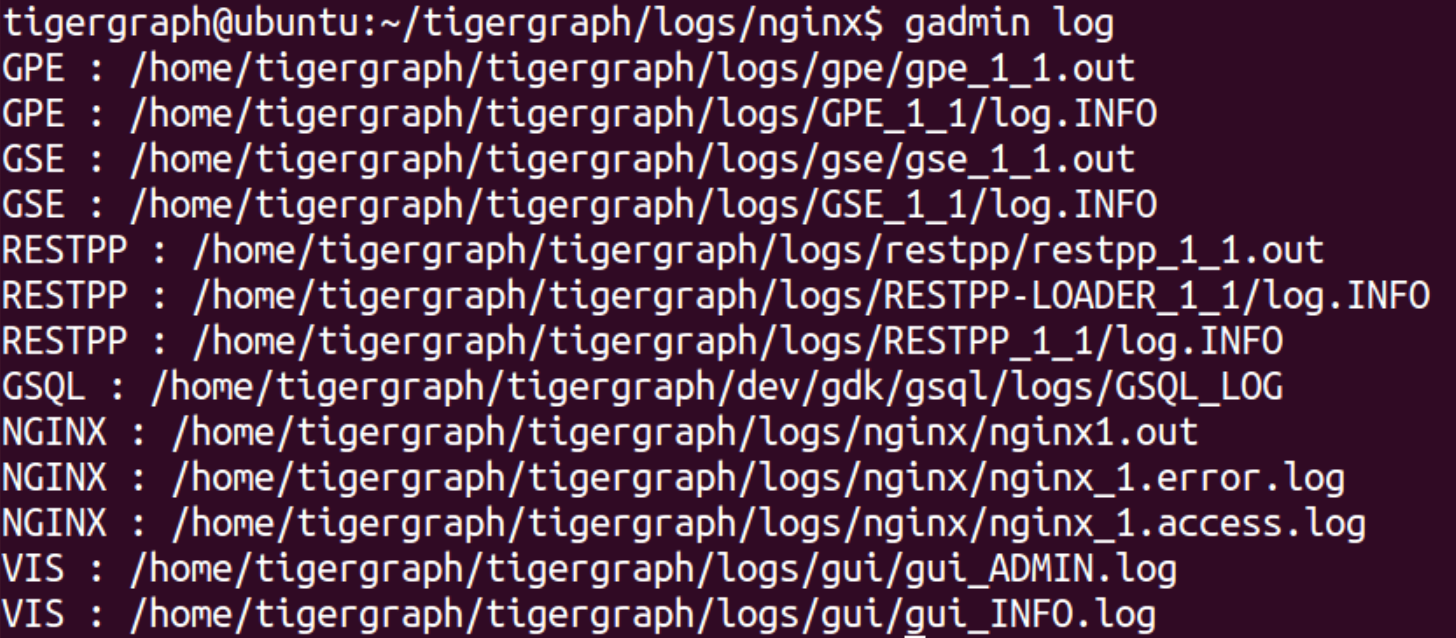
$ gadmin log
ADMIN  : /home/tigergraph/tigergraph/log/admin/ADMIN#1.out
ADMIN  : /home/tigergraph/tigergraph/log/admin/ADMIN.INFO
CTRL   : /home/tigergraph/tigergraph/log/controller/CTRL#1.log
CTRL   : /home/tigergraph/tigergraph/log/controller/CTRL#1.out
...
ZK     : /home/tigergraph/tigergraph/log/zk/ZK#1.out
ZK     : /home/tigergraph/tigergraph/log/zk/zookeeper.log
Use the command gadmin log <service name> to get the logs for a specific service:
$ gadmin log gpe
GPE    : /home/tigergraph/tigergraph/log/gpe/GPE_1#1.out
GPE    : /home/tigergraph/tigergraph/log/gpe/log.INFO
Third-Party components like Zookeeper and Kafka have logs that are not listed by gadmin log. You can find them at:
zookeeper : ~/tigergraph/zk/zookeeper.out.*
kafka     : ~/tigergraph/kafka/kafka.out
In a TigerGraph cluster, each node maintains logs only for the activities that occur on that node. Logs are not automatically replicated across nodes.
For example, the GSQL logs on the m1 node reflect only the operations performed on m1.
To determine which node is currently the GSQL leader, check the most recent log.INFO file on m1.
For example, the logs below recorded a GSQL leader switch from m2 to m1:
I@20210709 13:56:52.214  (GsqlHAHandler.java:231) GSQL leader switches from 'm2' to 'm1' ...
E@20210709 13:56:52.215  (GsqlHAHandler.java:246) GSQL HA leader switches to 'm1', abort and clear all sessions now.
If you want to lower the chance of leader switch by increasing timeout, please use 'gadmin config' to increase 'Controller.LeaderElectionHeartBeatMaxMiss' and/or 'Controller.LeaderElectionHeartBeatIntervalMS'.
I@20210709 13:56:52.219  (SessionManager.java:197) Abort and clear all sessions...
I@20210709 13:56:52.220  (SessionManager.java:204) All sessions aborted.
I@20210709 13:56:52.224  (GsqlHAHandler.java:283) switched to new leader m1
TigerGraph Component Log Files
-
.outfiles capture standard output (stdout) and log runtime information, including error stack traces when services crash or unexpected errors occur. These logs are especially useful for errors that aren’t logged by the service’s internal logging mechanism. -
.ERRORfiles are used to log errors captured by the system, typically from exceptions caught in try-catch blocks. If an error occurs before the logging system initializes or is uncaught, it is logged in the.outfile instead. -
.INFOfiles log regular operational information about the system’s normal functioning.
To diagnose an issue for a given component, check the .out log file for that component.
|
The GUI component writes all log levels to a single log file and does not generate separate
Replace |
Symbolic Links
In directories with frequently checked logs, such as restpp, gsql, and admin, symbolic links make it easier to access the latest log file.
These links are automatically updated to point to the newest log.
For example, log.INFO is a symbolic link that points to the current .INFO log file. To see what a symbolic link points to, use ls -ll followed by the symbolic link name:
ls -ll log.INFO
log.INFO -> log.INFO.2024-07-01-10-00-00
Here, log.INFO is a symbolic link pointing to the current .INFO log file.
Third-Party Component Log Files
TigerGraph uses several open-source components (such as Kafka, Nginx, ZooKeeper, Kafkaconn, Kafkastream) that maintain their own log conventions.
-
NGINX Logs: The NGINX log files (e.g.,
nginx.out,nginx.error.log,nginx.access.log) are generated directly by the NGINX web server itself and are not internal TigerGraph component logs. -
Kafka Logs: Kafka logs include
controller.log,kafka.log,kafka-request.log,state-change.log, andserver.log. -
ZooKeeper Logs: ZooKeeper logs are typically found as
zookeeper.out.*in the ZooKeeper directory.
TigerGraph log structure
|
Log formats may differ between |
-
log.INFO: Contains regular output and errors. -
log.ERROR: Contains errors only. -
<component_name>.out: Contains all output from the component process. Current.outlogs have the form<service name>.out. Historical logs have the form<service name>-old-YYYY-MM-DDTHH-MM-SS.fff.out -
log.WARNINGorlog.DEBUG-
log.WARNINGcontains warnings and all error-level messages. -
log.DEBUGcontains debug-level messages (not created by default).
-
-
log.FATAL: Contains outputs for any fatal level events
|
All services do not create a |