Pattern Search
Patterns search involves looking for specific patterns or sequences within a dataset or system. It can be used to identify recurring trends, anomalies, or correlations in data. By analyzing patterns, developers can gain insights and make informed decisions.
How to use Pattern Search
-
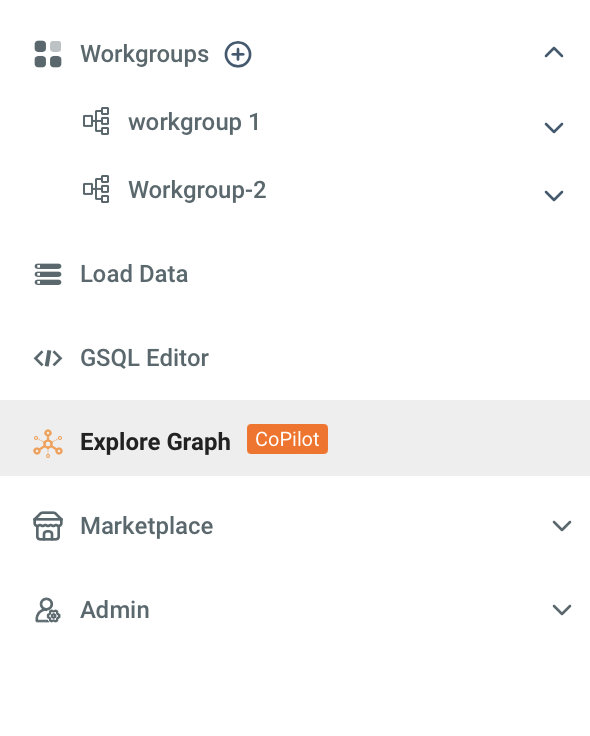
Navigate to the Explore Graph tab in the left navigation.
-
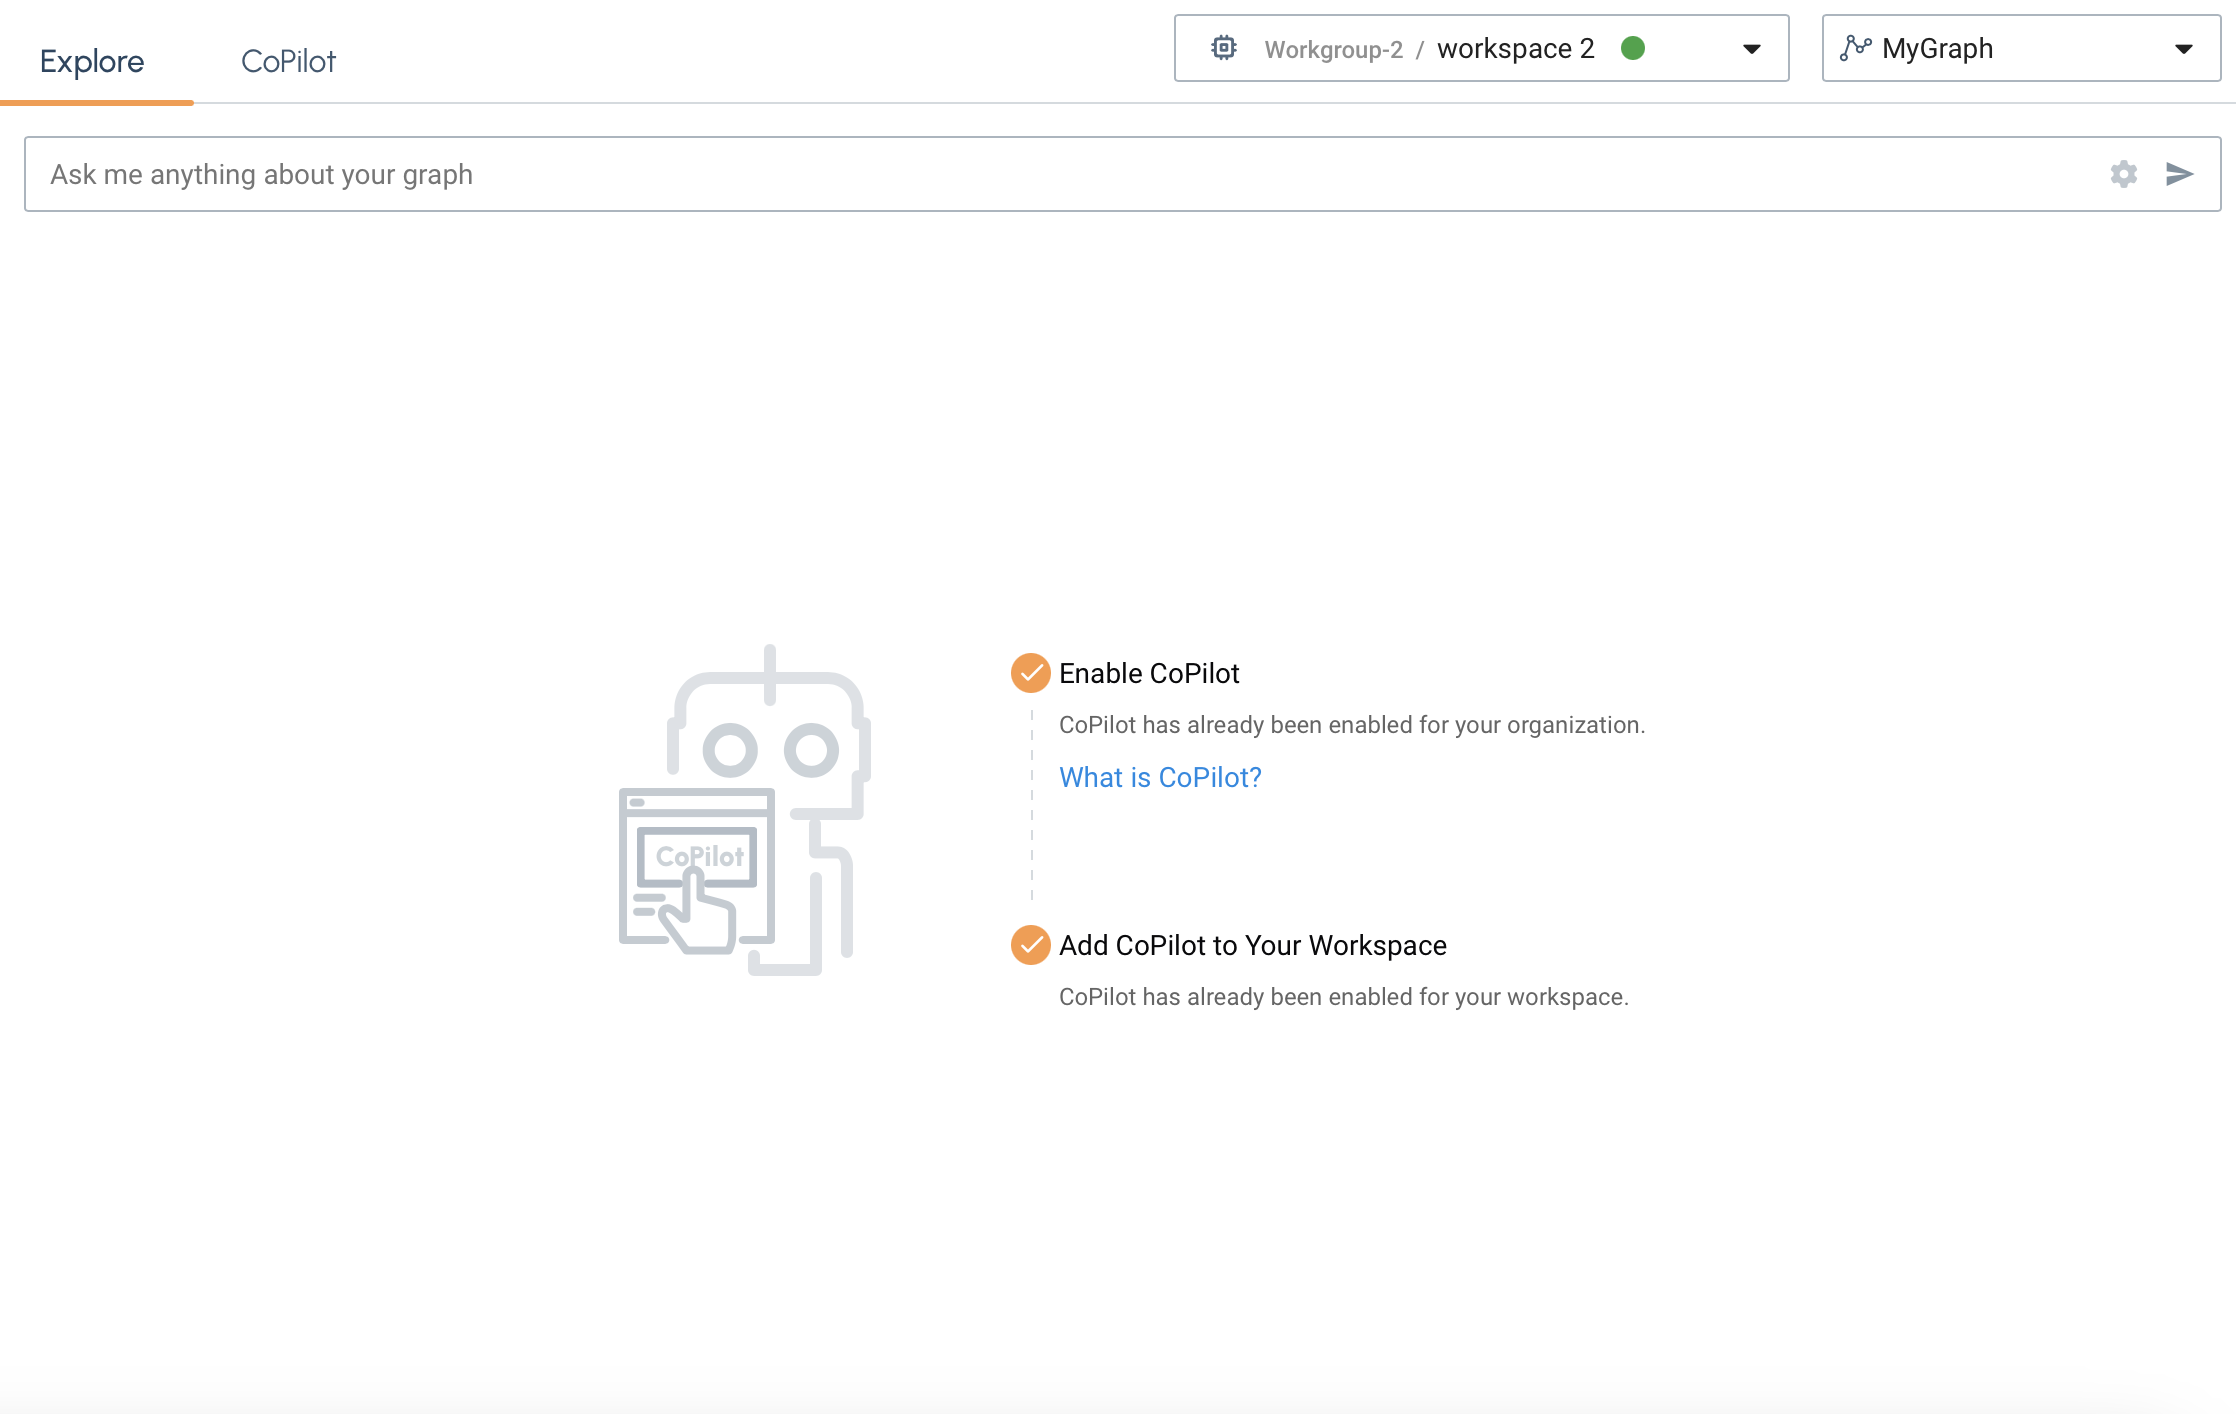
You will then see the Explore window.
-
Next, chose the workspace you want to use from the dropdown menu.

-
Then, choose which graph data you want to visualize patterns in.

-
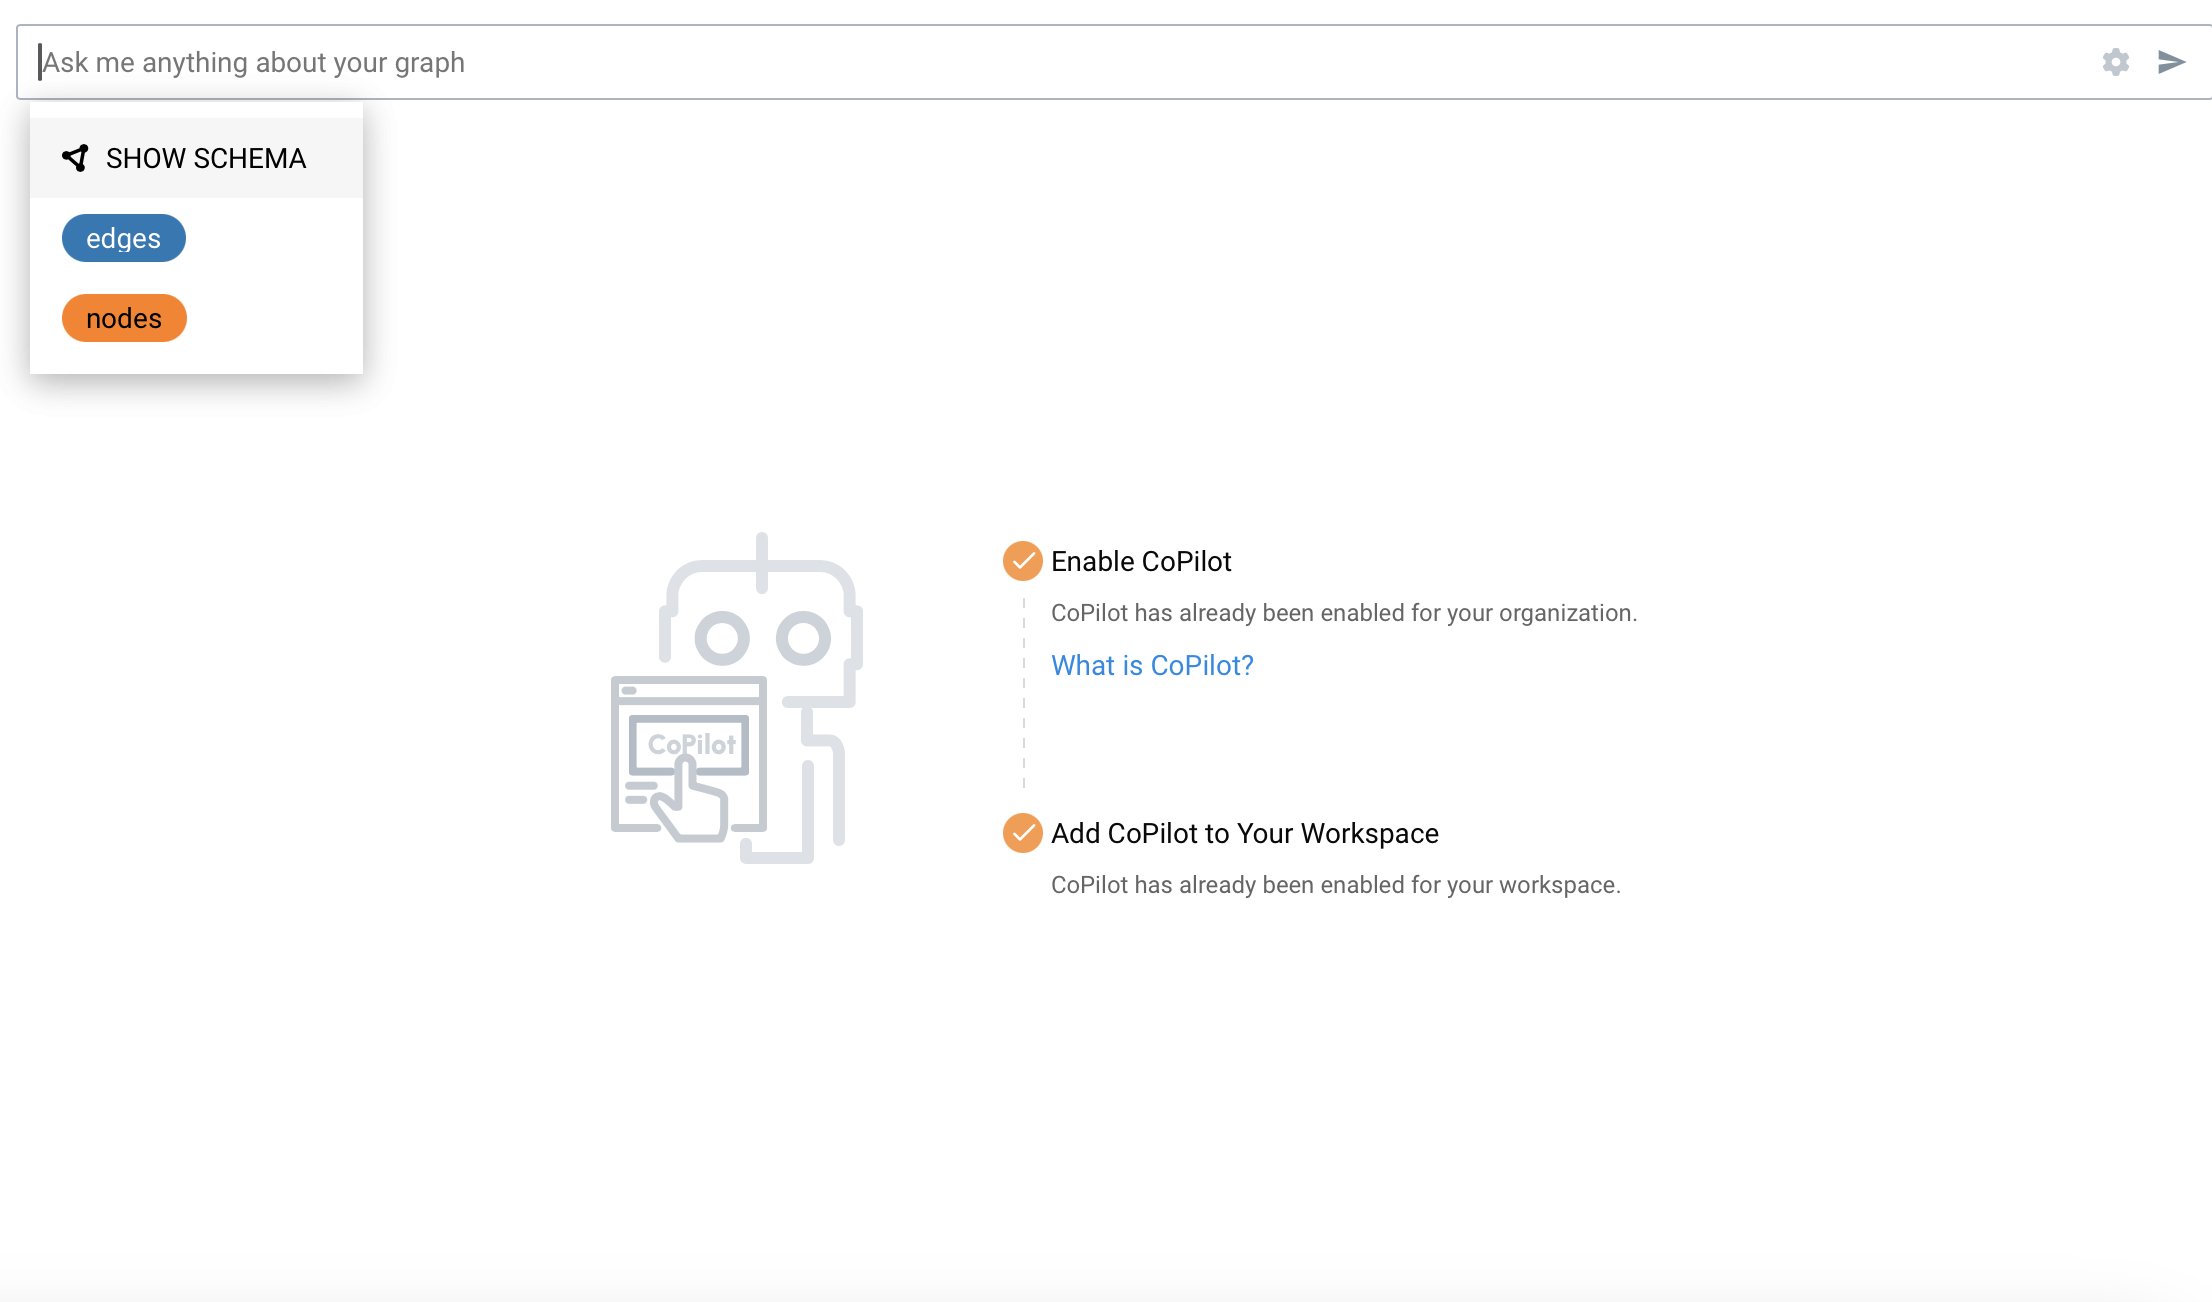
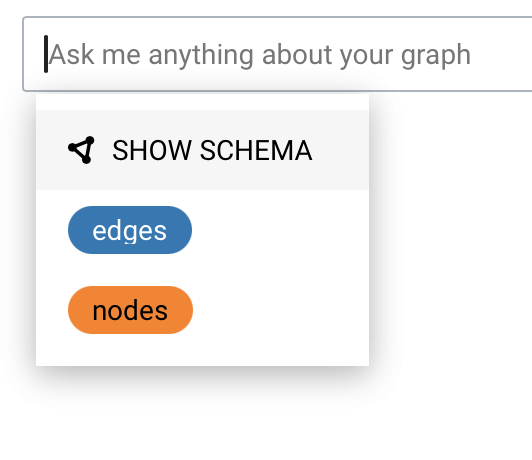
Once, you have the workspace and graph selected you can choose SHOW SCHEMA to visualized the schema created when you loaded your data.
-
Now, select the
 or hit the ENTER on your keyboard to run the visualizer.
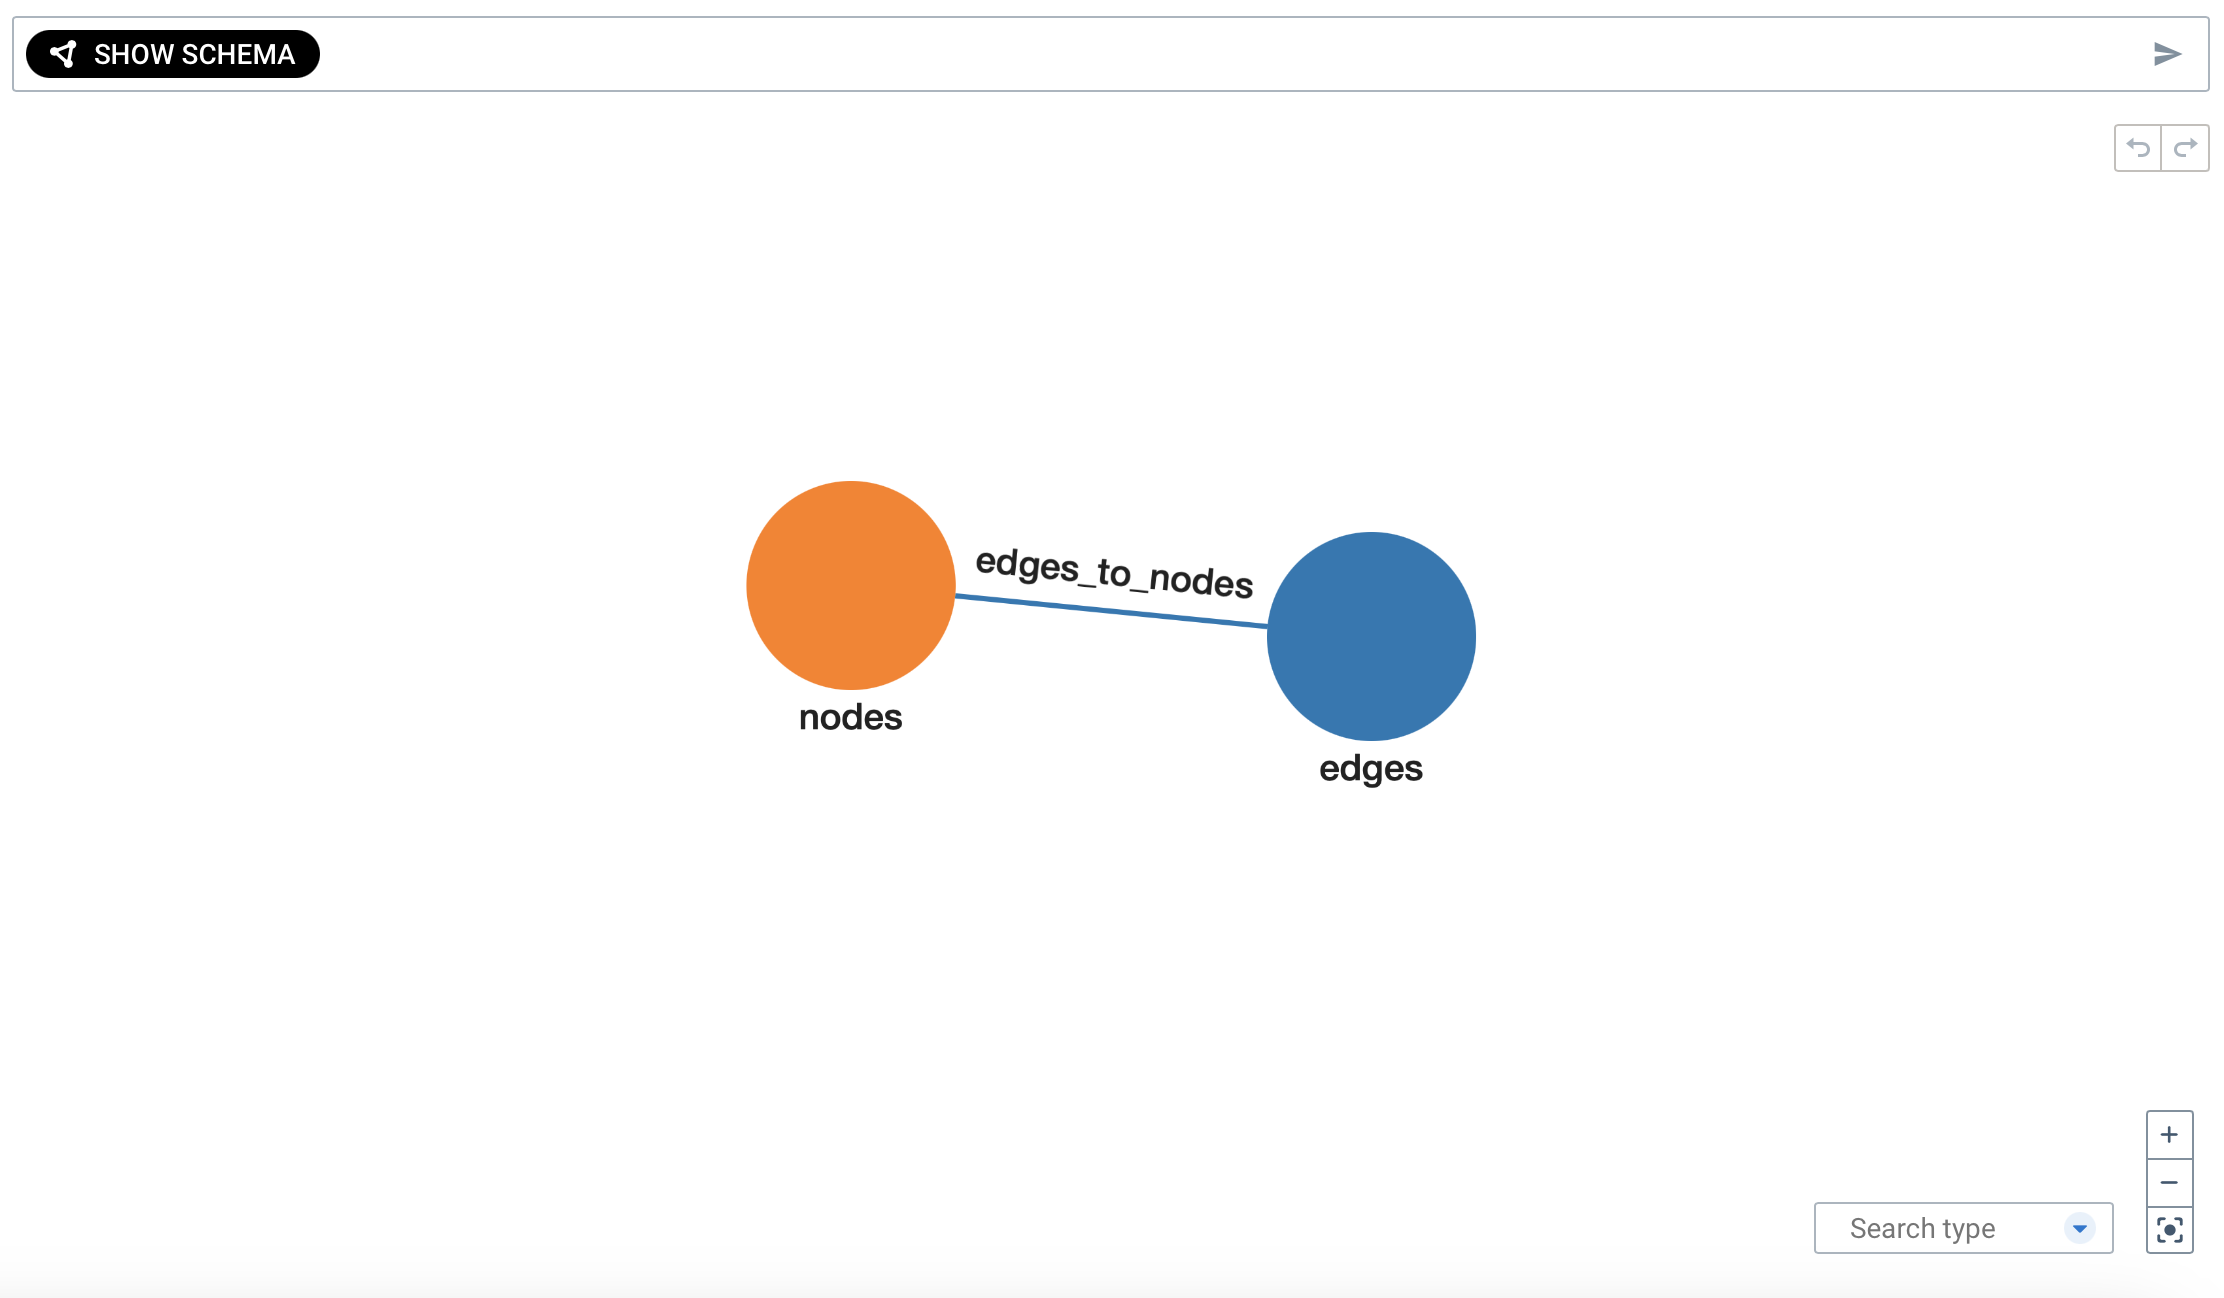
Customize Your Pattern Search
-
First we will select or nodes data.
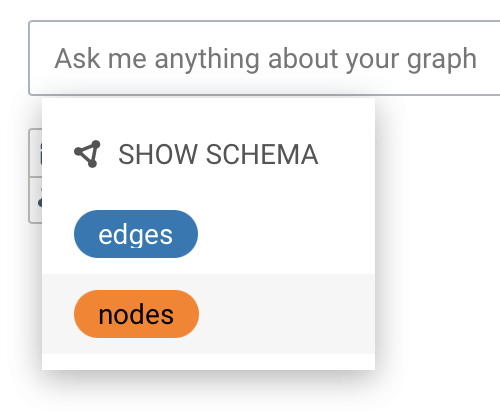
-
Next, we will select Add filter
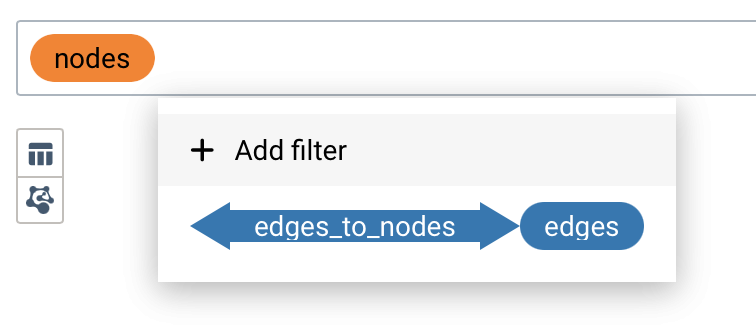
-
You should see a list of column entries from the data that was laoded in this workspace database. Select the one you want to search and visualize.
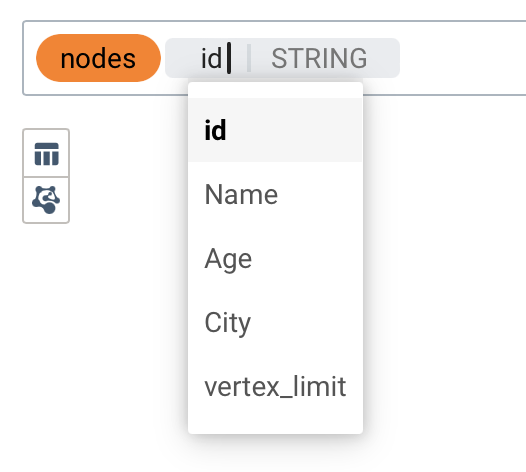
-
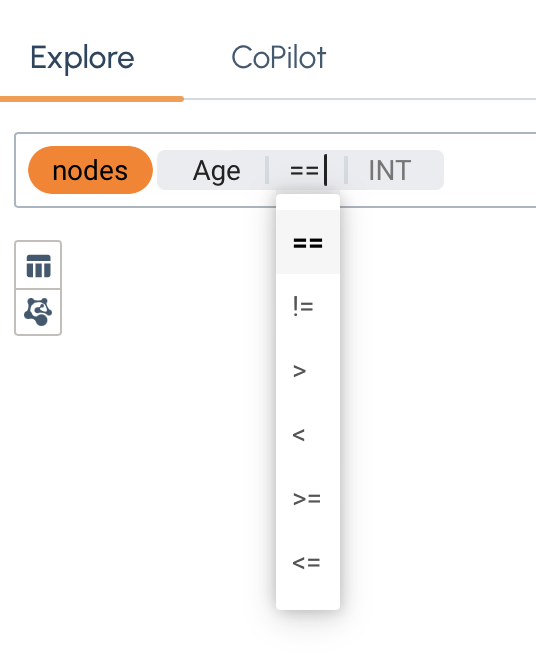
Chose the operator and type in a number into the box on the right side of the equation.
-
Now, select the
 or hit the ENTER on your keyboard to run the visualizer and a result from your graph should appear.
If nothing appears the data does not exist in the graph data.

-
Continue to experiment with more filters and searches to visualize your data and gain unique insights
Next Steps
Next, learn about TigerGraph CoPliot or checkout the Marketplace Overview.
Return to the Overview page for a different topic.